0590
In-silico study of internal gradient distribution effects on diffusion-weighted signals of white matter tracts models at 9.4 T1Centro Atomico Bariloche, CONICET, CNEA, S. C. de Bariloche, Argentina, 2Instituto de Nanociencia y Nanotecnologia, CNEA, CONICET, S. C. de Bariloche, Argentina, 3Instituto Balseiro, CNEA, Universidad Nacional de Cuyo, S. C. de Bariloche, Argentina
Synopsis
Keywords: Microstructure, Susceptibility, Internal Gradient, IGDT, white matter
Motivation: Non-invasively detecting tissue microstructure changes associated with pathologies holds immense diagnostic promise. Our approach complements conventional DWI methods by capturing distinct microstructural information.
Goal(s): We investigate the relationship between axon microstructure parameters and Internal Gradients distributions' influence on MRI signals.
Approach: We employed the Finite Perturber Method (FPM) to calculate intravoxel magnetic gradients and MonteCarlo simulations to simulate the spins diffusion using a MGSE sequence.
Results: Our findings demonstrate up to 2.5 % signal variations when incorporating Internal Gradient Distribution terms, offering insights into signal behavior with varying microstructure parameters.
Impact: The complementary findings of addressing non-invasive tissue-microstructure changes based on probing internal gradients paves the way for early pathological detection. This empowers clinicians to in-depth investigations, transforming our approach to diagnostics and enhancing healthcare outcomes.
Introduction
Understanding the microstructure of biological tissues through magnetic resonance imaging (MRI) is of paramount importance in medical diagnostics and research. The interaction between the primary magnetic field B0 and the susceptibility difference (∆χ) leads to localized alterations in the magnetic field (∆B), giving rise to internal magnetic gradients (IG). These IG carry critical information about the tissue's microstructure, making them highly valuable in medical imaging. However, a comprehensive understanding of IG in relation to key microstructural parameters characterizing WM and GM axons and how it is connected to the MRI signal is lacking. In this study, we employ numerical simulations to explore this relationship, focusing on IG distributions parallel to B0. Our findings reveal a direct impact on the MRI signal when using a MGSE sequence, allowing for IGDT [1] extraction. This study extends and refines previous work presented in abstract form [2]. This research provides an alternative probe of tissue microstructure changes induced by development of pathologies and diseases.Methods
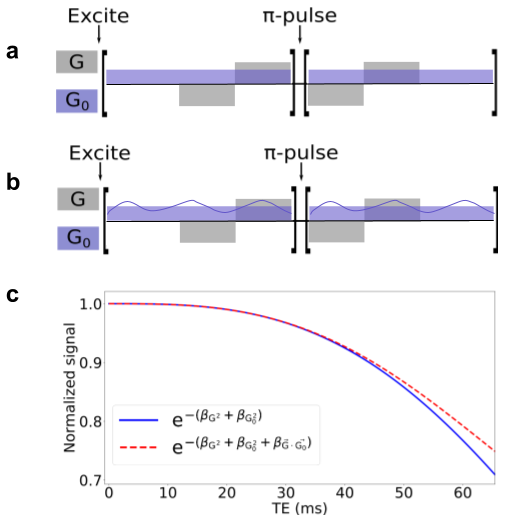
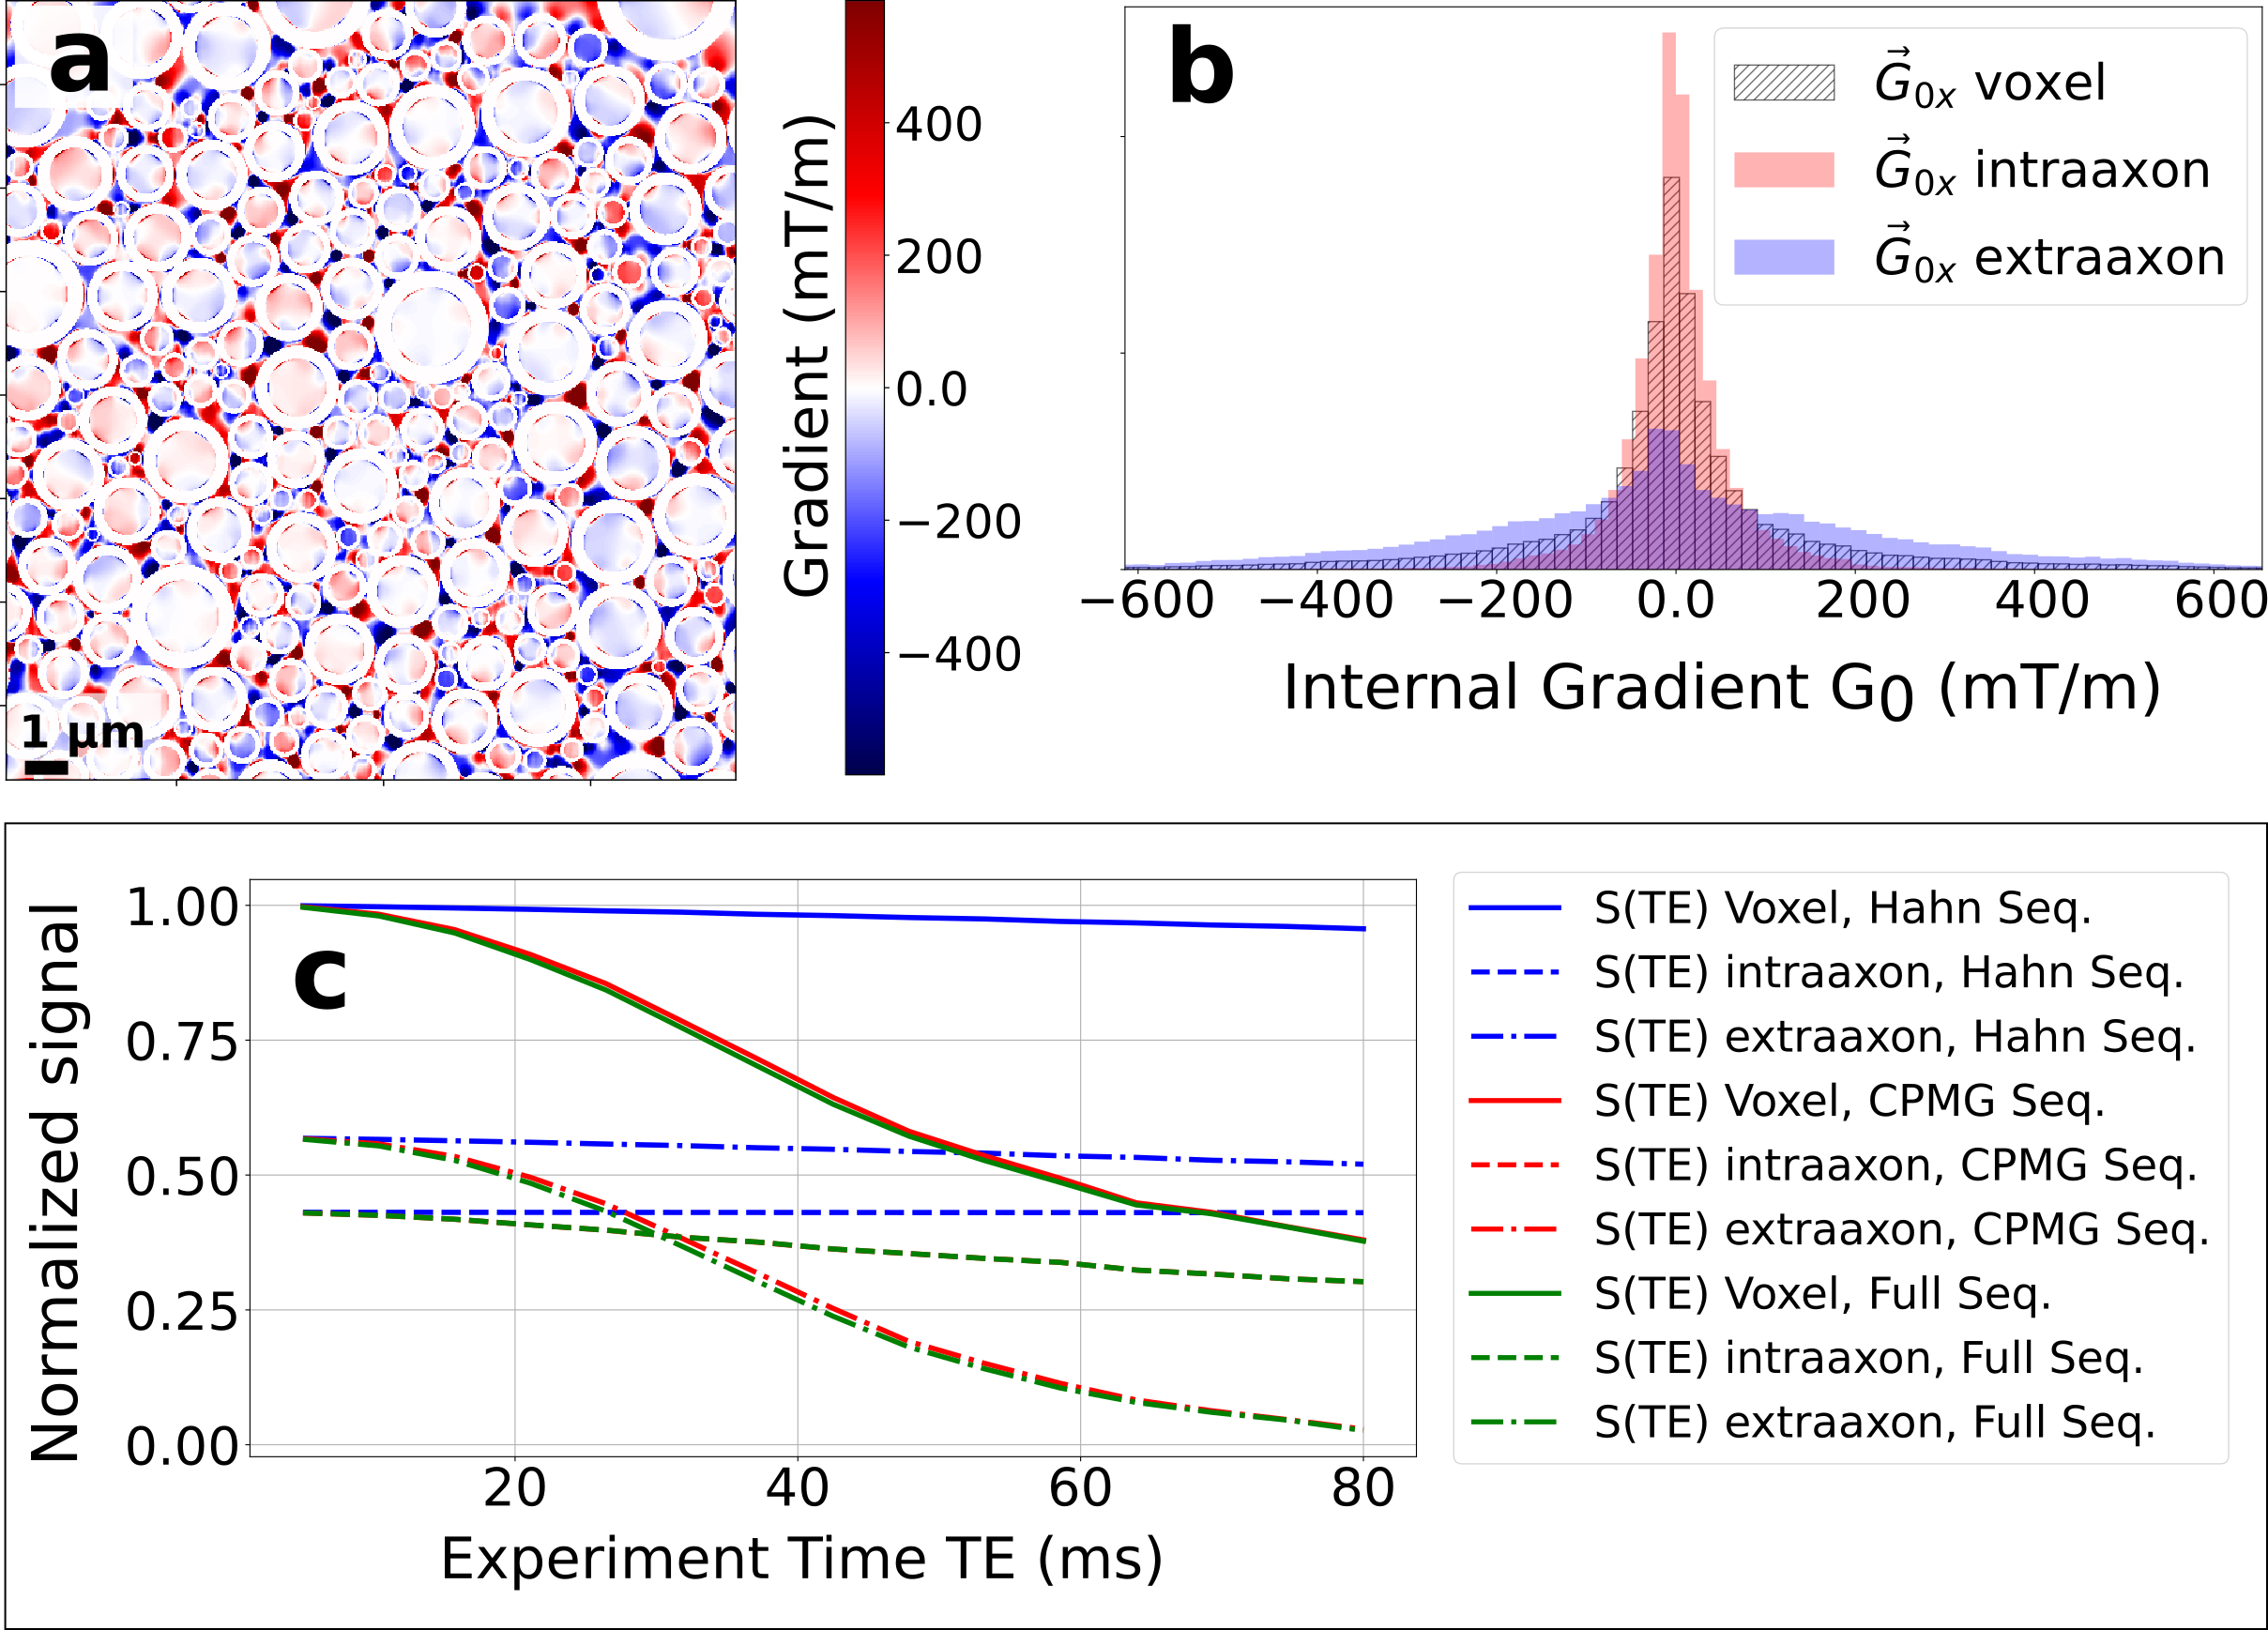
IGDT calculation: We model the local magnetic field inhomogenities induced by the presence of myelinated axons with a LogNormal diameter size distribution [2]. We consider the myelin sheath with a magnetic field susceptibility different from that of the water. The axon parameters used are indicated in Fig. 1. We employed the Finite Perturber Method (FPM) to determine the magnetic field inhomogeneity within the intra-voxel (sub-mm) level [3].Signal decay calculation induced by MGSE and IGDT effects: We consider a MGSE sequence like the one depicted in Fig 2a,b, a main field of 9.4 T and applied gradients of 500 mT/m. The mean value of the IG was set to 50 mT/m as has been previously reported in literature [4]. We determine the average spin signal decay induced by the different types of molecular diffusion (within and outside the axons) using numerical Monte Carlo (MC) simulations to model the brownian motion of the spins ensemble. The spins are initially placed randomly within the voxel domain. We employed 104 spins for each run and a timestep ∆t = 0.1μs. The grid resolution is 2048x2048 and a total of 10 realizations were made, such that a total of 105 spins were averaged for each plot. The diffusion coefficient D0 was set to 0.1 μm2/ms, within previously reported values [4]. We calculate the readout at the end of the signal decay S(TE) for every total diffusion time with and without cross-terms (CT) [1,5] interaction between the internal and applied gradients using the sequences of Fig 2a,b.
Results
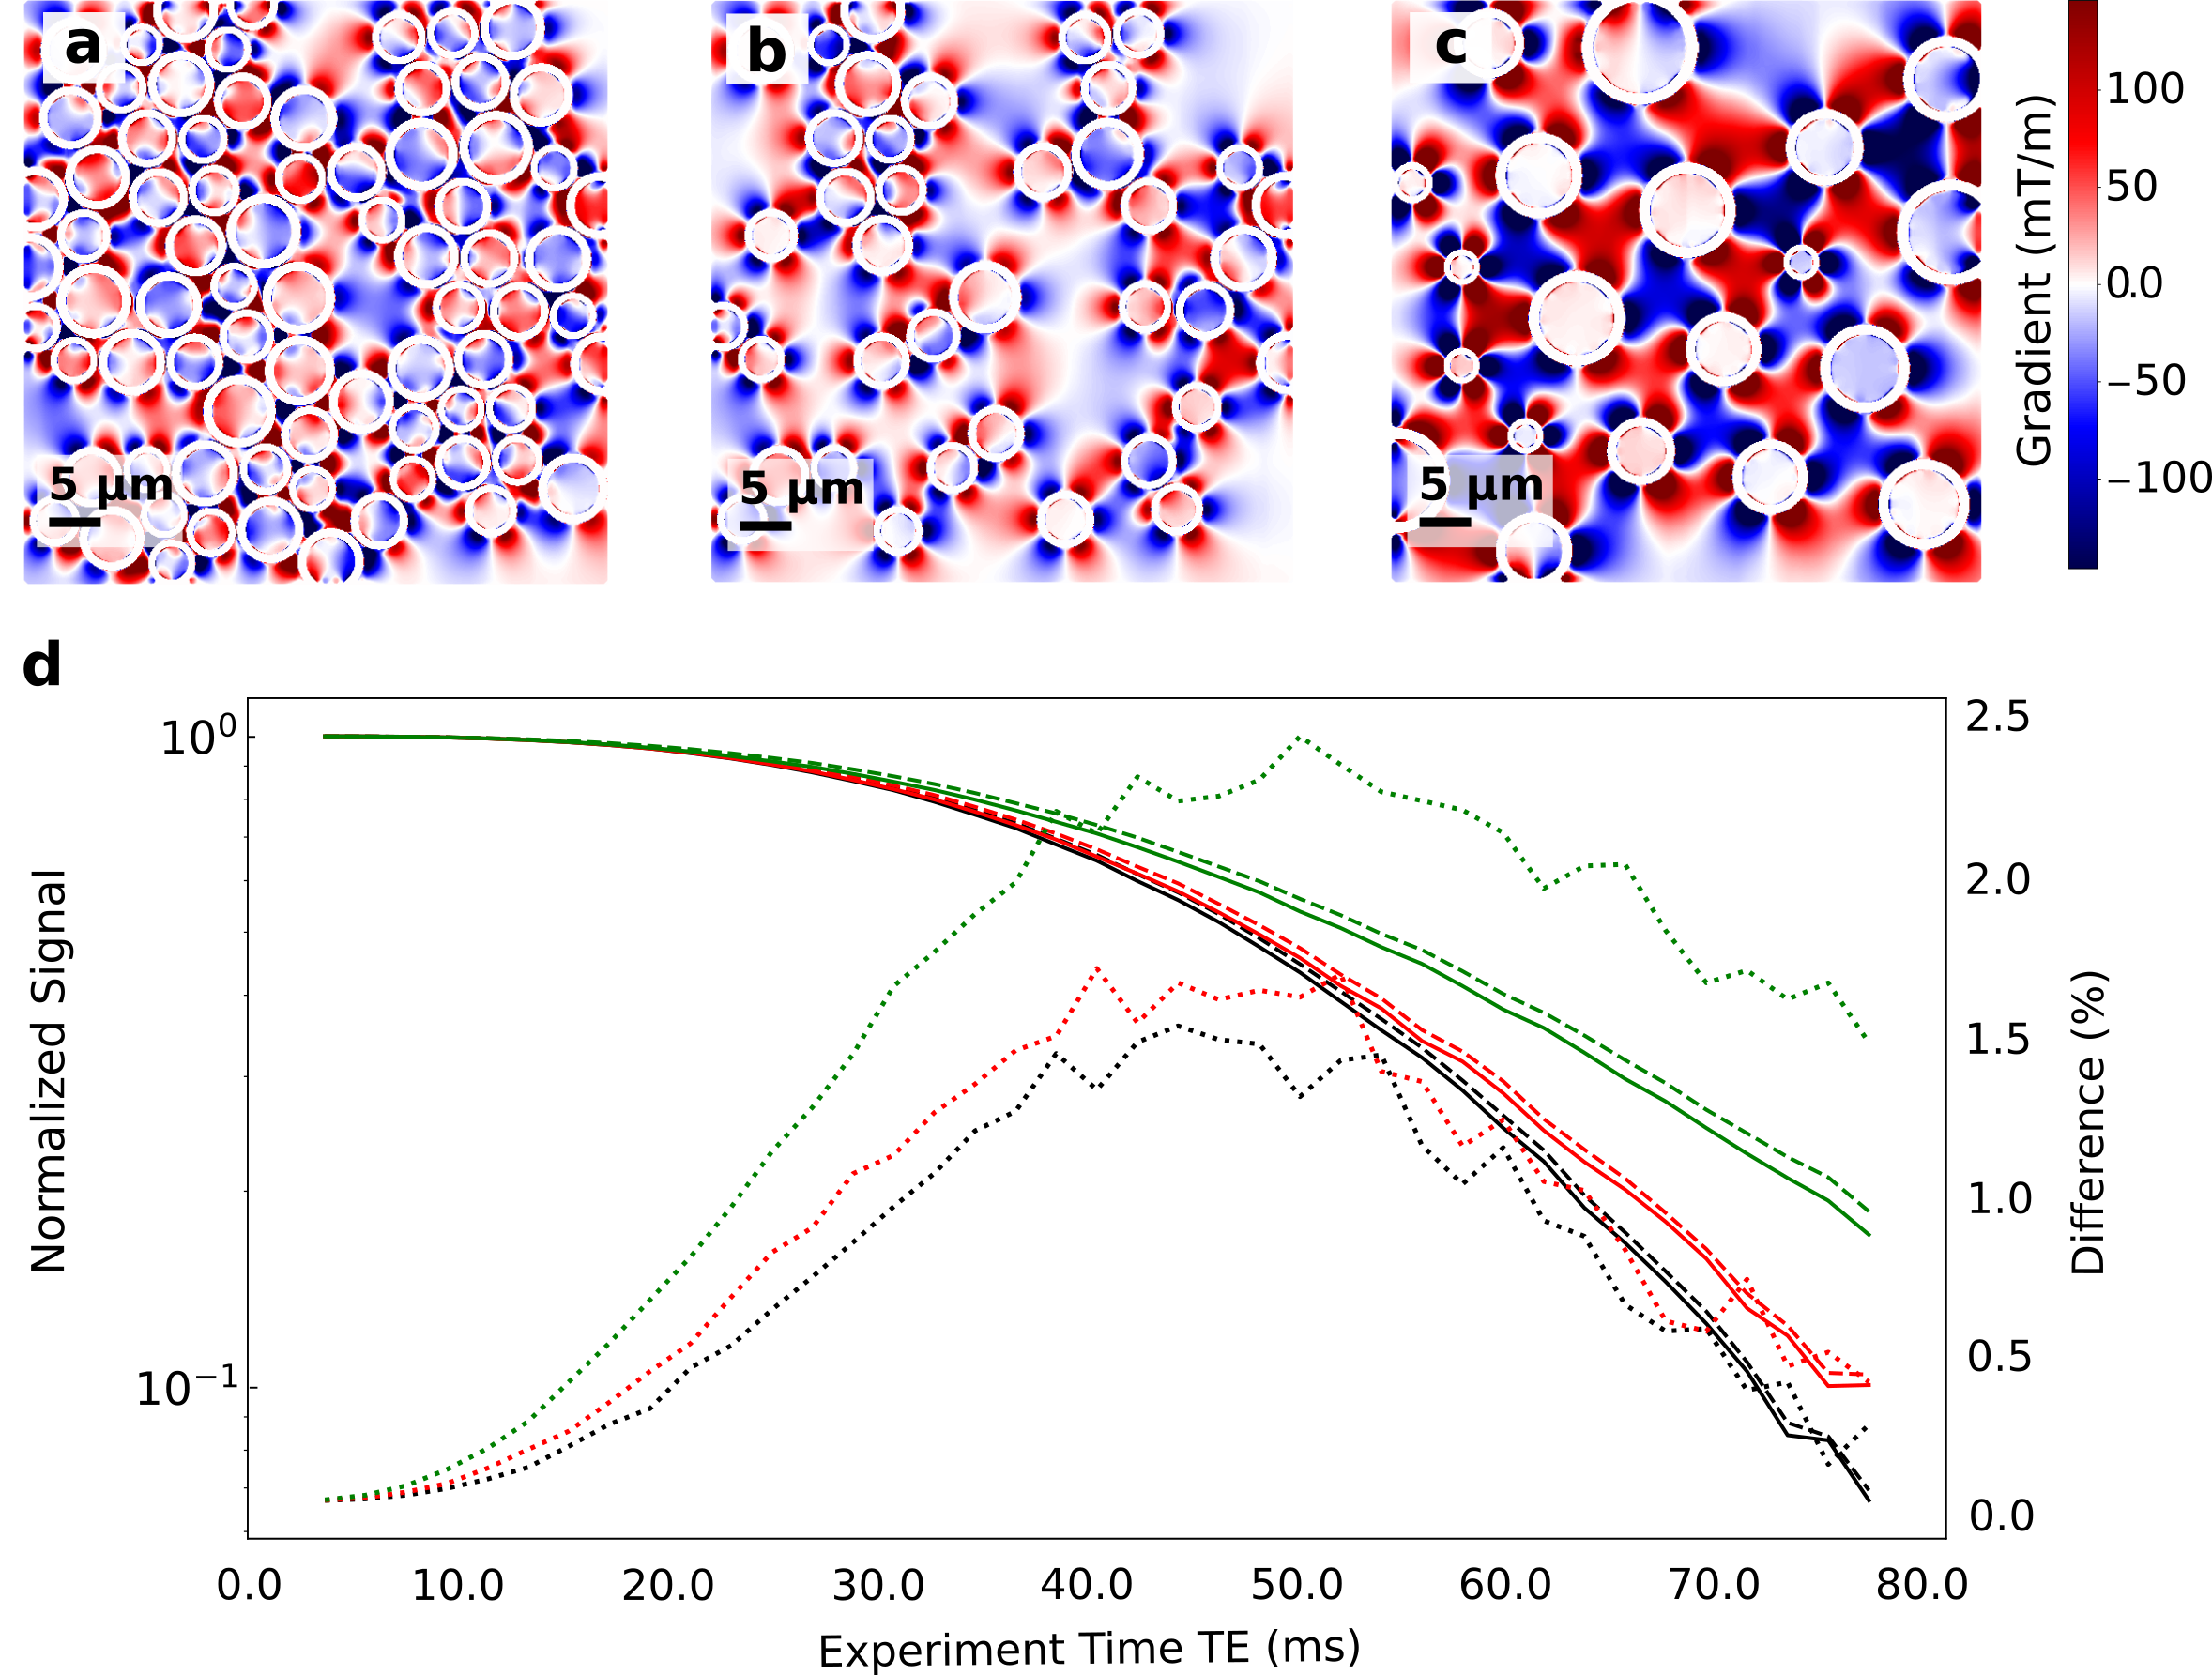
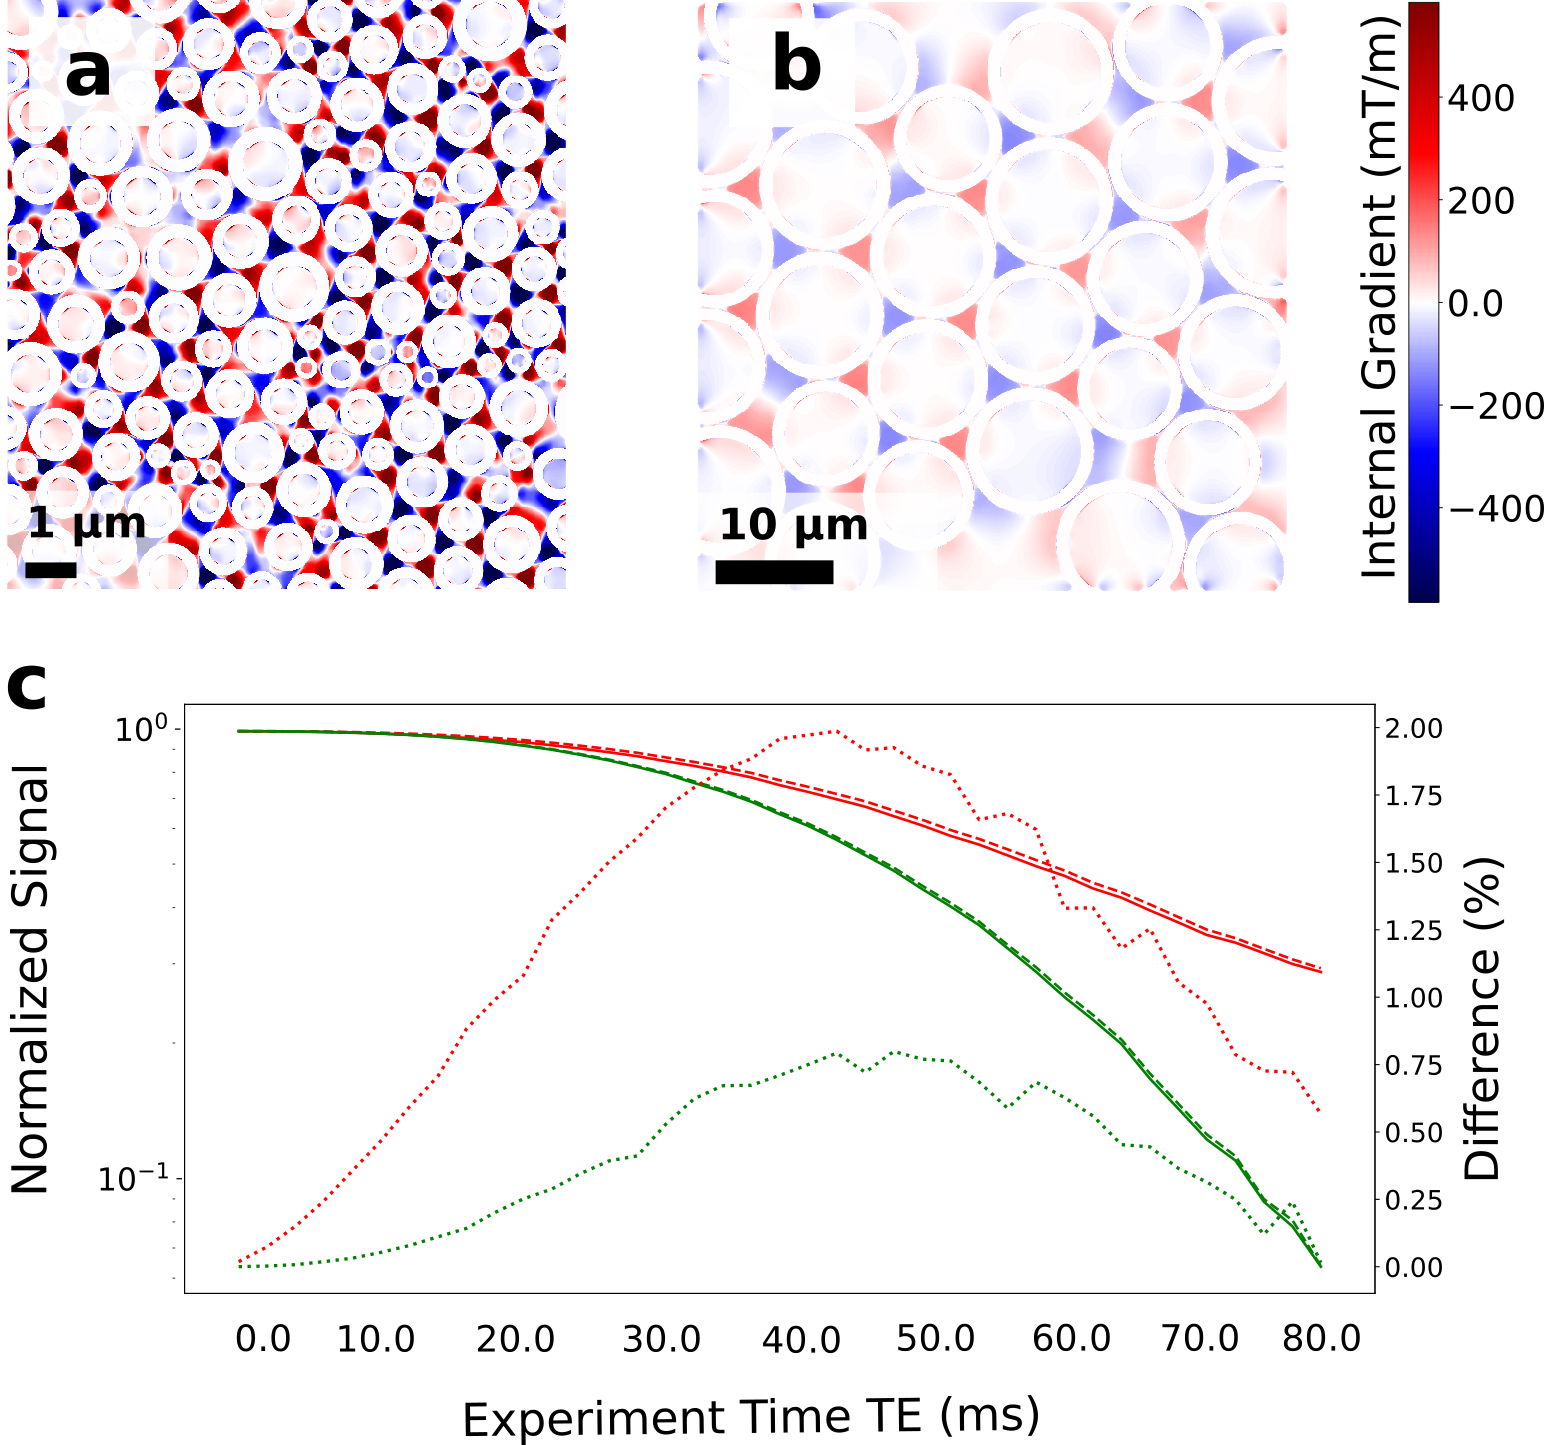
In Fig. 3 we show the effect on the signal decay driven by the MGSE sequences due to the separate contributions of the applied and internal gradient modulations. A typical axon-distribution is shown and its corresponding IG distribution within a voxel.The decay of the different diffusion processes (restricted and hindered) happening in the WM model are shown in Fig. 4. We show typical differences between the signal decay with and without the CT for different Fiber Volumetric Fractions (FVF). We also show the signal decay effects due to distinct axon arrangements based on disorder metrics. The value of the FVF dominates the signal decay, since this directly modifies the diffusion restriction size. However, the difference between signals (with and without CT) is enhanced with increasing the IG distribution observed within the voxels for higher FVF. In Fig. 5 we show the signal decay difference with and without CT for two different values of mean axon size (1 μm and 10 μm). Here we observe a similar effect: As the size of the axon distribution shrinks, the diffusion is more restricted and the IG distribution variance is larger, leading to a larger difference between the signals with and without CT.
Conclusion and Discussion
We demonstrated with in-silico 2D models that the CT effect of the IGDT can be measured in realistic physical environments mimicking WM based on simulations. This can potentially translate into the incorporation of complementary information to DWI and SWI to further resolve axon microstructure features and their changes. We found that the IGDT CT produces differences in the signal (when present or absent) of up to 2.5 % of the signal. These differences are attainable at times compatible with the typical T2 decay times of WM (50 - 80 ms). The overall signal decay is dominated by the nature of the diffusion process, however, the width of the IG distribution dominates the difference in the signal as a marker for morphology changes. We found this value to be significantly higher in voxels with more restricted diffusion and higher FVF.Acknowledgements
This work was supported by CNEA; CONICET; ANPCyT-FONCyT PICT-2017-3156, PICT-2017-3699, PICT-2018-4333, PICT-2021-GRF-TI-00134, PICT-2021-I-A-00070; PIP-CONICET (11220170100486CO); UNCUYO SIIP Tipo I 2019-C028, 2022-C002, 2022-C030; Instituto Balseiro; Collaboration programs between the MINCyT (Argentina) and, MAECI (Italy) and MOST (Israel); and Erasmus+ Higher Education program from the European Commission between the CIMEC (University of Trento) and the Instituto Balseiro (Universidad Nacional de Cuyo).References
1. Álvarez, G. A., Shemesh, N., & Frydman, L. Internal gradient distributions: A susceptibility-derived tensor delivering morphologies by magnetic resonance. Scientific reports. 2017; 7(1), 1-10.
2. Fajardo, J. E., & Álvarez, G. A. (2021). Internal gradient distribution tensors of white matter tracts models. Proc. Intl. Soc. Mag. Reson. Med. 2021;13:171629).
3. Pathak, A. P., Ward, B. D., & Schmainda, K. M. A novel technique for modeling susceptibility-based contrast mechanisms for arbitrary microvascular geometries: the finite perturber method. Neuroimage. 2008; 40(3), 1130-1143.
4. Xu, T., Foxley, S., Kleinnijenhuis, M., Chen, W. C., & Miller, K. L. (2018). The effect of realistic geometries on the susceptibility‐weighted MR signal in white matter. Magnetic resonance in medicine, 79(1), 489-500.
5. Pérez, L. A. P., & Álvarez, G. A. Cumulant expansion framework for internal gradient distributions tensors. Journal of Magnetic Resonance Open. 2023; 16-17, 100136
6. Lee, J., Shmueli, K., Kang, B. T., Yao, B., Fukunaga, M., Van Gelderen, P., ... & Duyn, J. H. The contribution of myelin to magnetic susceptibility-weighted contrasts in high-field MRI of the brain. Neuroimage. 2012; 59(4), 3967-3975.
7. Chen, W. C., Foxley, S., & Miller, K. L. Detecting microstructural properties of white matter based on compartmentalization of magnetic susceptibility. 2013; Neuroimage, 70, 1-9.
8. Mingasson, T., Duval, T., Stikov, N., & Cohen-Adad, J. Axonpacking: an open-source software to simulate arrangements of axons in white matter. 2017; Frontiers in neuroinformatics, 5.
9. Sukstanskii, A. L., & Yablonskiy, D. A. On the role of neuronal magnetic susceptibility and structure symmetry on gradient echo MR signal formation. Magnetic resonance in medicine. 2014; 71(1), 345-353.
10. Puwal, S., Roth, B. J., & Basser, P. J. Heterogeneous anisotropic magnetic susceptibility of the myelin‐water layers causes local magnetic field perturbations in axons. 2017; NMR in Biomedicine, 30(4), e3628.
11. Raffelt, D. A., Tournier, J. D., Smith, R. E., Vaughan, D. N., Jackson, G., Ridgway, G. R., & Connelly, A. Investigating white matter fibre density and morphology using fixel-based analysis. 2017; Neuroimage, 144, 58-73.
Figures
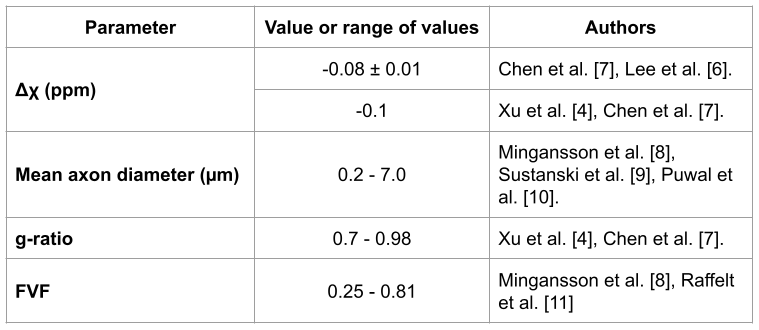
Figure 1. Summary of parameters and sources used for the microstructure parameters of the white matter axon models.