0970
Selective filters of translational molecular diffusion dynamics in white matter microstructures with preclinical and clinical MRI1Instituto Balseiro, CNEA, Universidad Nacional de Cuyo, S. C. de Bariloche, Argentina, 2Centro Atómico Bariloche, CONICET, CNEA, S. C. de Bariloche, Argentina, 3Instituto de Nanociencia y Nanotecnologia, CNEA, CONICET, S. C. de Bariloche, Argentina, 4Center for Mind/Brain Sciences - CIMeC, University of Trento, Rovereto, Italy, 5Siemens Healthcare GmbH, Erlangen, Germany
Synopsis
Keywords: Diffusion/other diffusion imaging techniques, Microstructure
Magnetic resonance imaging is one of the most widely used methods for non-invasive medical imaging. Gradient modulation sequences can selectively extract quantitative information at micrometer and sub-micrometer scales that might be relevant for clinical applications. We approach this topic using white matter phantoms by observing the contrast generated by Non-uniform Oscillating Gradient Spin Echo (NOGSE) sequences to selectively filter the signal of molecules confined in compartments of specific sizes. The NOGSE contrast is determined by subtracting different OGSE acquisitions on a clinical scanner. Our results demonstrate a microscopic tortuosity mechanism that provides microstructural information at short time scales.Introduction
Nuclear magnetic resonance imaging (MRI) is one of the most widely used methods for non-invasive medical imaging. Recent studies suggest that magnetic field gradient modulation sequences can selectively extract quantitative information at micrometer and sub-micrometer scales1,2. This highly relevant information for the diagnosis of pathologies such as cancer and neurodegenerative diseases, is currently inaccessible with standard sequences of clinical practice3-7. Complex molecular diffusion take place in biological tissues, making difficult to extract quantitative spatial information in a practical way. We address this issue generating image contrasts with Non-uniform Oscillating Gradient Spin Echo (NOGSE) sequences2,8, that selectively filter the signal originating from molecules confined in microstructures of specific sizes9. The NOGSE contrast, so far only demonstrated in preclinical MRI scanners, may be also obtained by subtracting signals from Oscillating Gradient Spin Echo (OGSE) sequences10-12 with different frequencies. To validate the feasibility of this approach, we apply it to extract microstructural information from phantoms that mimic white matter axon-tracts containing complex molecular diffusion within the extra-axonal compartments.The goals of this study were two: i) implement a NOGSE contrast in a 9.4T preclinical scanner and in a 3T clinical scanner using an OGSE research sequence, ii) develop a model to characterize extra-axonal space with phantoms and compare NOGSE phantom data from a preclinical and a clinical scanner.
Methods and theoretical foundations
White matter phantoms as a paradigm of extra-axonal spaceMRI experiments were performed at preclinical and clinical scanners with phantoms that emulates the extra-axonal spaces of white matter. We use compacted solid aramid fibers of an average diameter of approx. 10 microns, put in plastic tubes filled with distilled water13. The water molecules diffuse within and between extra-axonal compartments. Different phantoms were use on the scanners with different compaction degree.
Probing molecular diffusion in extra-axonal space by OGSE sequences
Nuclear spins of the water’s protons interact with external magnetic field gradients along their random motion trajectories. Their precession frequency fluctuates according to the spin’s instantaneous position $$$\vec{r}(t)$$$. The accumulated random phase $$${\phi}(t)$$$ reflects the molecule displacement autocorrelation-function $$⟨\omega(t')\omega(t'')⟩=\gamma^{2}G^{2}⟨{\Delta}r(t'){\Delta}r(t'')⟩=\gamma^{2}G^2⟨\Delta{r}(0)\Delta{r}(t'-t'')⟩,$$where the brackets represent the ensemble average over the random phases and $$${\Delta}r(t)=r(t)-⟨r(t)⟩$$$ is the instantaneous deviation of the spin position14,15. The displacement power spectrum $$$S(\omega)$$$ is the Fourier transform of the displacement correlation-function. Previous works proposed the spectral density$$S(\omega)=\frac{D_{0}}{\alpha\omega^{2}}+\left(1-\frac{1}{\alpha}\right)\frac{D_{0}\tau_{c}^{2}}{1+\tau_{c}^{2}\omega^{2}}\qquad\qquad(1)$$to describe the impact of tortuosity on time dependent diffusion, where $$$D_0$$$ is the free diffusion coefficient, $$$\tau_c$$$ is the characteristic time required to explore interstitial compartment sizes and $$$\alpha$$$ is the tortuosity coefficient14-16. The effective diffusion coefficient at long diffusion-times $$$t_d$$$ is derived from $$$S(\omega\rightarrow0)=\frac{D_{eff}({{\infty})}}{\omega^{2}}=\frac{D_{0}}{\alpha\omega^{2}}$$$, leading to the tortuosity diffusion coefficient. We model the diffusion in the extra-axonal space based on this assumption. We determine the NOGSE contrast $$${\Delta}M=$$$OGSE$$$_N-$$$OGSE$$$_{N/2}$$$ as a function of the adimensional diffusion length $$$L_d=(t_d\gamma^{2/3}G^{2/3}{D_0}^{1/3})^{1/2}$$$ and the adimensional restriction length $$$L_c=(\tau_c\gamma^{2/3}G^{2/3}{D_0}^{1/3})^{1/2}$$$ (Fig. 1). We found a region where the effective restriction length of interstitial compartments is manifested on the contrast.
Preclinical and clinical MR acquisition
A preclinical 9.4T (Bruker Avance III HD WB NMR) and a 3T clinical (MAGNETOM Prisma, Siemens Healthcare, Erlangen, Germany) were used. A PSGE sequence17 was used on both scanners to first characterize the diffusion process and determine the tortuosity coefficient $$$\alpha$$$. NOGSE was implemented (preclinical) and OGSE research application (clinical) with different cycles were subtracted to determine the NOGSE contrast.
Results and Discussion
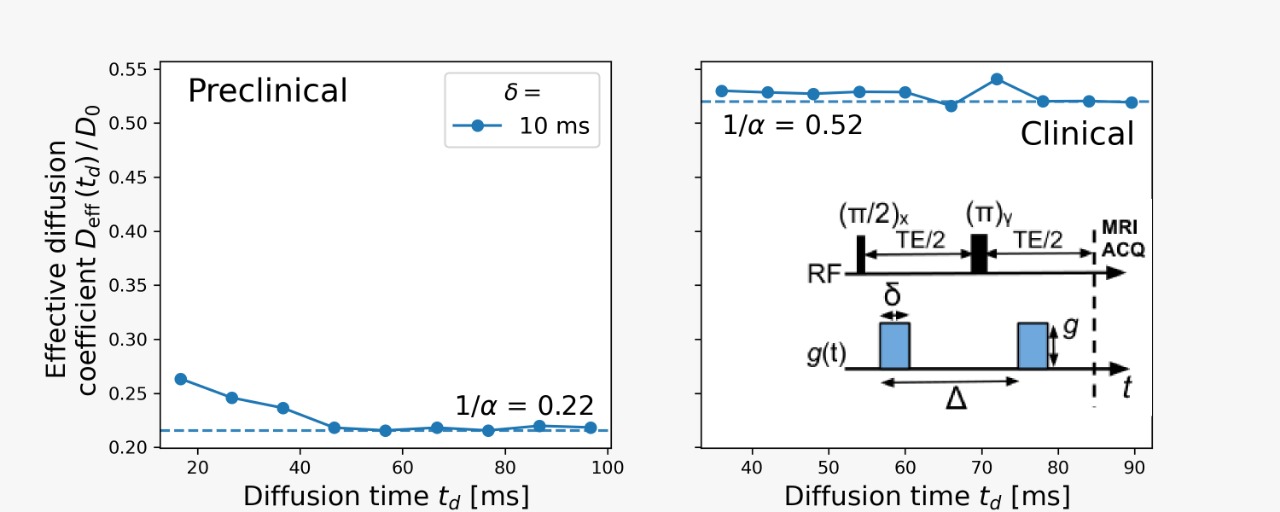
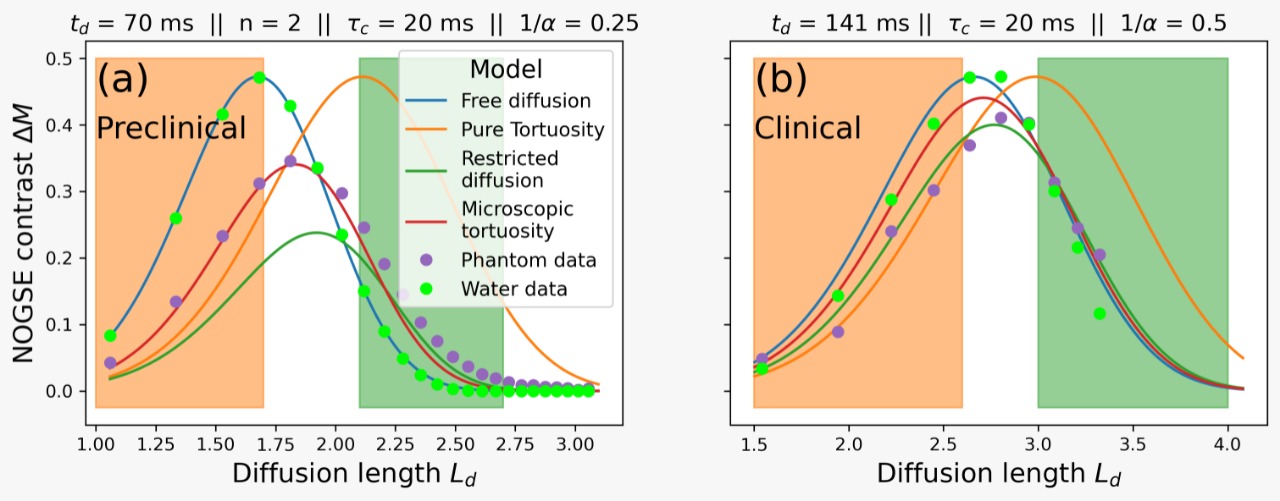
Experimental observations with preclinical and clinical scannersThe available PGSE control-parameters only allow probing the long-time tortuosity regime (Fig. 2). We determine the NOGSE $$${\Delta}M$$$ contrast on the preclinical scanner as it allows reducing the total echo-time and avoid experimental imperfections (Fig. 3a)2,9. On the clinical scanner, we subtracted OGSE sequences with different frequencies but same diffusion-time (Fig. 3b). As predicted by the diffusion model, the NOGSE contrast highlights three regions as a function of the gradient strength, (i) an infinite time tortuosity regime (orange-region), (ii) a regime evidencing the effective restriction sizes (green-region), and (iii) an intermediate regime containing information about both (white-region).
Manifestation of Microscopic Tortuosis
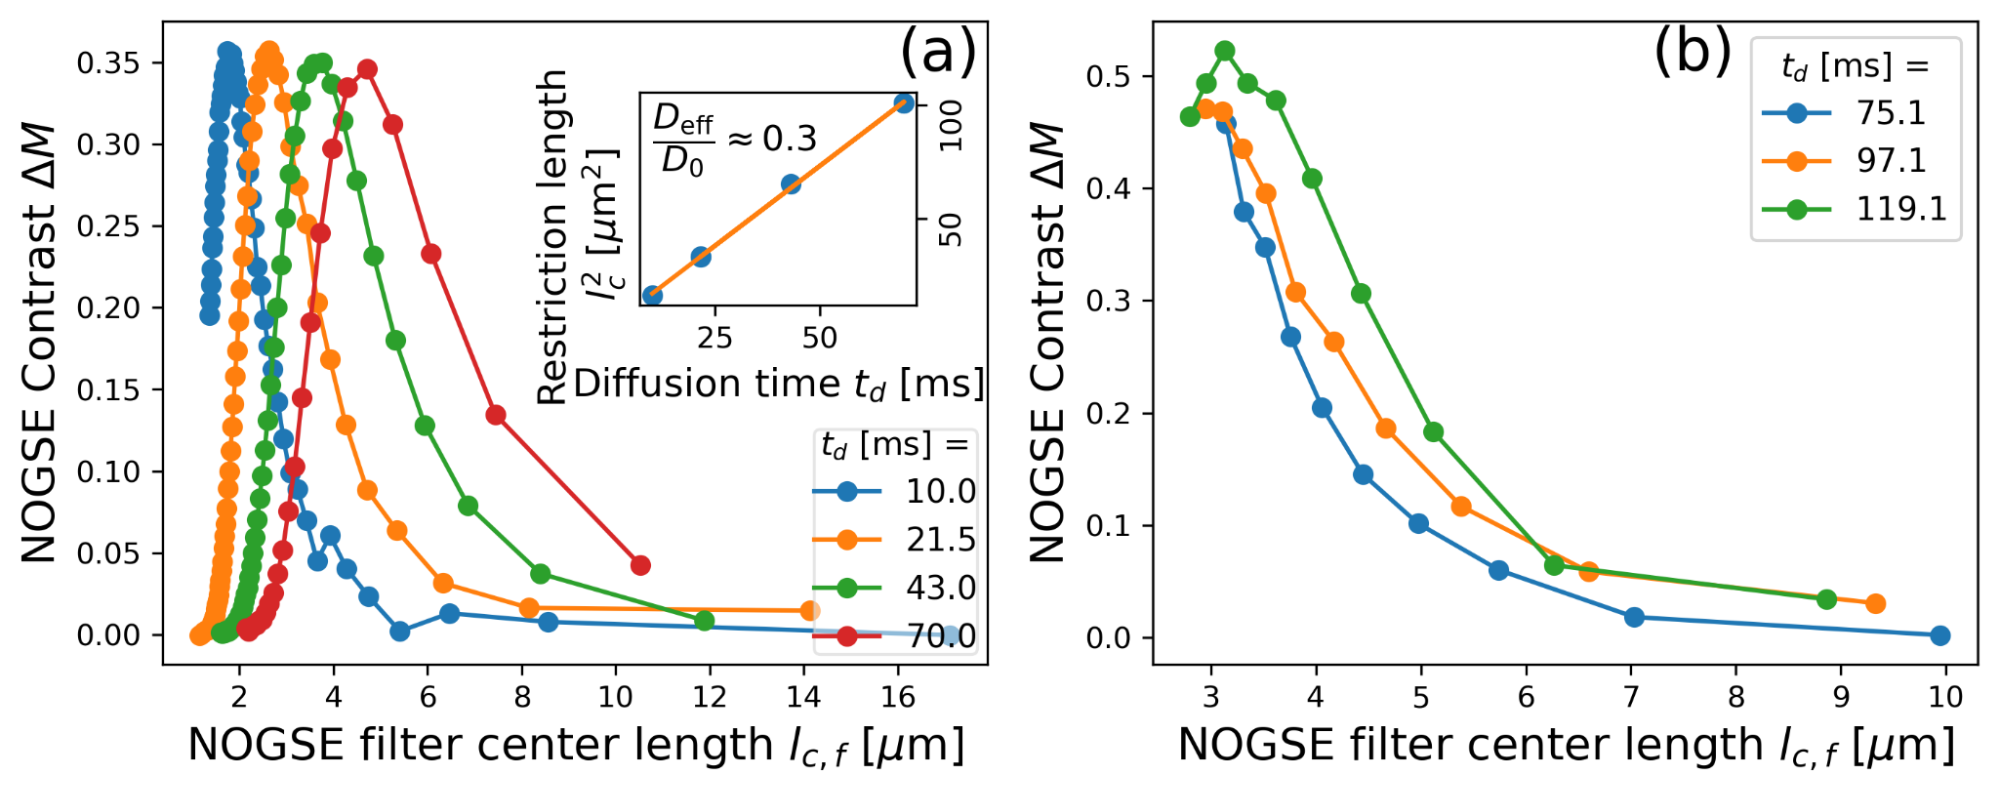
The diffusion model represents well the behavior of the NOGSE contrast as a function of the adimensional diffusion length $$$L_D$$$ (Fig. 3). We found that the effective restriction size of the interstitial compartments increases with the diffusion time (Fig. 4). This thus implies an instantaneous displacement spectral density with a time-dependent effective restriction size following a Fick’s law (Fig. 4). This behavior is not described by a tortuosity dynamics with an effective attenuated diffusion coefficient nor with a fully restricted diffusion process. Instead, it describes a microscopic tortuosis mechanism, where with some probability water molecules are restricted on a space determined by the instantaneous effective restriction size.
Conclusions
We show that NOGSE contrasts, based on subtracting signals from OGSE sequences with different frequencies, filter the spin’s signal to selectively observe molecules confined to restrictions given by a microscopic tortuosity mechanism. Through a theoretical representation of the signal, this experimental observation was demonstrated and shown that optimal encoding gradient shapes can extract quantitative information of the diffusion process related to extra-axonal compartments. These results thus demonstrate a potential for obtaining quantitative microstructural information related to microscopic tortuosity mechanisms between extra-axonal spaces in the human brain which may open up new diagnostic methods in MRI.Acknowledgements
This work was supported by CNEA; CONICET; ANPCyT-FONCyT PICT-2017-3156, PICT-2017-3699, PICT-2018-4333; PIP-CONICET (11220170100486CO); UNCUYO SIIP Tipo I 2019-C028, 2022-C002, 2022-C030; Instituto Balseiro; A collaboration program from MINCyT (Argentina) and MAECI (Italy) and Erasmus+ Higher Education program from the European Commission between the CIMEC (University of Trento) and the Instituto Balseiro (Universidad Nacional de Cuyo). Thorsten Feiweier is an employee of Siemens Healthcare GmbH, owns stocks of Siemens (Healthineers) AG and holds patents filed by Siemens.References
1. Álvarez GA, Shemesh N, Frydman L. Coherent dynamical recoupling of diffusion-driven decoherence in magnetic resonance. Phys. Rev. Lett. 2013; 111:080404.
2. Shemesh N, Álvarez GA, Frydman L. Measuring small compartment dimensions by probing diffusion dynamics via Non-uniform Oscillating-Gradient Spin-Echo (NOGSE) NMR. J. Magn. Reson. 2013; 237:49.
3. Padhani AR, et al. Diffusion-weighted magnetic resonance imaging as a cancer biomarker: Consensus and recommendations. Neoplasia 2009; 11:102.
4. Drago V., et al. Disease tracking markers for alzheimer’s Disease at the prodromal (MCI) stage. J. Alzheimers Dis. 2011; 26:159.
5. White NS, et al. Probing tissue microstructure with restriction spectrum imaging: Histological and theoretical validation. Hum. Brain Mapp. 2013; 34:327.
6. White NS, et al. Diffusion-weighted imaging in cancer: Physical foundations and applications of restriction spectrum imaging. Cancer Res. 2014; 74:4638.
7. Alexander DC, Dyrby TB, Nilsson M, Zhang H. Imaging brain microstructure with diffusion mri: Practicality and applications. NMR Biomed. 2019; 32:e3841.
8. Shemesh N, Álvarez GA, Frydman L. Size distribution imaging by Non-Uniform Oscillating-Gradient Spin Echo (NOGSE) MRI. PLoS ONE 2015; 10:e0133201.
9. Capiglioni M, Zwick A, Jiménez P, Álvarez GA. Noninvasive Quantitative Imaging of Selective Microstructure Sizes via Magnetic Resonance. Phys. Rev. Applied 2021; 15:014045.
10. Stepisnik J. Analysis of NMR self-diffusion measurements by a density-matrix calculation. Physica B & C 1981; 104:350–364.
11. Callaghan PT, Stepisnik J. Frequency-domain analysis of spin motion using modulated-gradient NMR. J. Magn. Reson. A 1995; 117:118-122.
12. Gore JC, Xu J, Colvin DC, Yankeelov TE, Parsons EC, Does MD. Characterization of tissue structure at varying length scales using temporal diffusion spectroscopy. NMR Biomed. 2010; 23:745.
13. Giménez M, Jiménez P, Pedraza L, Betancourth D, Zwick A, Álvarez GA. Microstructure size-distribution estimations with smooth and sharp non-uniform oscillating gradient spin-echo modulations. Proc. Intl. Soc. Mag. Reson. Med. 2021; 29:3418.
14. Callaghan P. Translational Dynamics Magnetic Resonance, Principles of Pulsed Gradient Spin Echo NMR, 2011.
15. Stepišnik J. Time-dependent self-diffusion by NMR spin-echo. Physica B 1993; 183: 343–350.
16. Stepišnik J, Mohorič A., Duh A. Diffusion and flow in a porous structure by the gradient spin echo spectral analysis. Physica B 2001; 307:158–168.
17. Stejskal EO, Tanner JE. Spin diffusion measurements – spin echoes in presence of a time-dependent field gradient. J. Chem. Phys. 1965; 42:288–292.
Figures
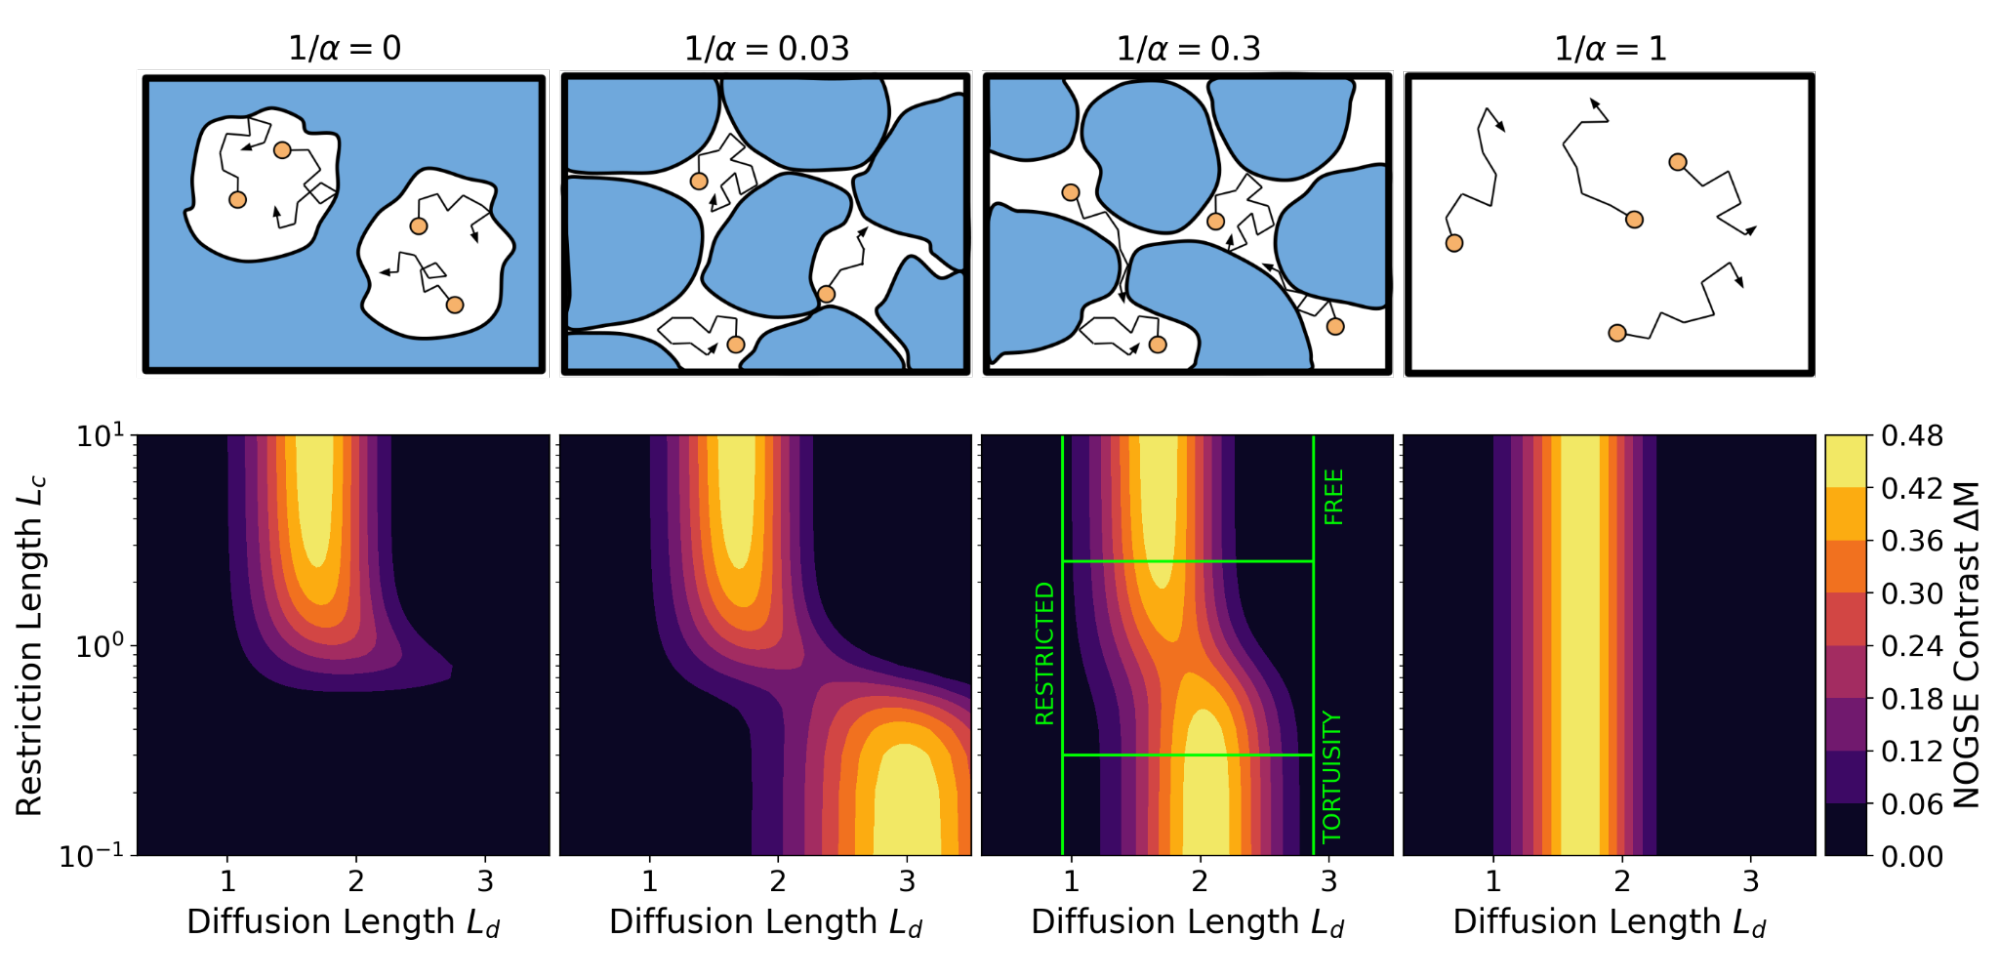
Figure 1: Molecular diffusion in extra-axonal space manifested in the NOGSE contrast. (top panels) Scheme of molecular diffusion with different tortuosity coefficients. (bottom panels) NOGSE contrast as a function of the adimensional restriction length $$$L_c=(\tau_c\gamma^{2/3}G^{2/3}{D_0}^{1/3})^{1/2}$$$ and the adimensional diffusion length $$$L_d=(t_d\gamma^{2/3}G^{2/3}{D_0}^{1/3})^{1/2}$$$ for the tortuosity coefficients of the top panels. There is a parametric region where restriction sizes are manifested.