4389
Estimating multicomponent 2D relaxation spectra with a ViSTa-MR fingerprinting acquisition1Ming Hsieh Department of Electrical and Computer Engineering, University of Southern California, Los Angeles, CA, United States, 2Stanford University, Stanford, CA, United States, 3University of Southern California, Los Angeles, CA, United States
Synopsis
Multidimensional relaxation correlation spectroscopic imaging methods have demonstrated powerful capabilities to resolve subvoxel microstructure. In this work, we perform T1-T2 relaxation correlation spectroscopic imaging using a sequence that combines MR fingerprinting with a ViSTa preparation module to enhance sensitivity to short-T1 components. We demonstrate theoretically and empirically that this approach has advantages over MR fingerprinting without ViSTa. Empirical results demonstrate the ability to identify at least 6 anatomically plausible tissue components, including a short-T1 component that was not previously resolved when using MR fingerprinting without ViSTa. A novel generalized ADMM algorithm is also proposed that substantially improves computational efficiency.
Introduction
In recent years, several multicontrast acquisition and multicomponent modeling techniques have emerged that can estimate the joint distribution of T1 and T2 relaxation parameters within each voxel1-5. These 2D relaxation distributions (or “2D relaxation correlation spectra”) can be used to identify subvoxel microstructural tissue compartments that would normally be hidden by partial volume effects. It has been proven theoretically that the use of high-dimensional relaxation encoding can lead to multicomponent estimation problems that are substantially better-posed than for lower-dimensional acquisition methods4.MR fingerprinting (MRF)6 is one of the multi-contrast acquisition strategies that can be used to estimate 2D relaxation correlation spectra1-3,5,7. Although MRF can be powerful, it has also been observed that traditional MRF sometimes lacks sufficient sensitivity to tissue compartments with short-T1 values (like the myelin water component in brain tissue)7. In this work, we demonstrate the ability to perform MRF-based multicomponent 2D relaxation modeling with improved sensitivity to short-T1 components.
From an acquisition perspective, our approach combines a traditional fingerprinting acquisition with a ViSTa preparation module to better isolate short-T1 components, building off of a recent sequence concept that was previously used for single-component tissue modeling9. From a reconstruction/estimation perspective, we estimate multidimensional T1-T2 relaxation correlation spectroscopic images (with 2 spectral relaxation dimensions and 2 spatial dimensions) using a previously proposed spatially regularized estimation technique that offers substantial estimation-theoretic advantages over approaches that do not exploit spatial regularity4,7. We also introduce a novel generalized ADMM algorithm that substantially improves the computational efficiency of this approach.
Methods
A 2D ViSTa-MRF dataset (with 538 timepoints, and 32 spiral interleaves to achieve fully sampled k-space) was acquired on a 3T Siemens Prisma scanner with 1mm in-plane resolution and 10mm slice thickness. We used estimation-theoretic Cramer-Rao bounds to compare the amount of information captured by the proposed ViSTa-MRF sequence compared to a conventional MRF sequence.Our estimation formulation assumes that we wish to estimate a spectroscopic image corresponding to an $$$N_1 \times N_2$$$ spatial image matrix and an $$$M_1 \times M_2$$$ T1-T2 correlation spectrum (with $$$M_1$$$ corresponding to the number of T1 values and $$$M_2$$$ corresponding to the number of T2 values). Let $$$\boldsymbol{\alpha}_n \in \mathbb{R}^{M_1M_2},\ n=1,2,...,N_1N_2$$$ represent the vectorized 2D spectrum at the voxel $$$n$$$, and let the concatenated vector $$$\boldsymbol{\alpha} = [\boldsymbol{\alpha}_1;\boldsymbol{\alpha}_2;\cdots;\boldsymbol{\alpha}_{N_1N_2}] \in \mathbb{R}^{M_1 M_2 N_1 N_2}$$$ denote the vectorization of the full 4D spectroscopic image that we wish to estimate. Also let $$$\mathbf{d}_n \in \mathbb{R}^{N_t}$$$ denote the MRF time series at voxel $$$n$$$, where $$$N_t$$$ is the number of time points, and let $$$\boldsymbol{\Phi} \in \mathbb{R}^{N_t \times M_1 M_2}$$$ be the MRF dictionary such that we nominally have $$$\mathbf{d}_n = \boldsymbol{\Phi\alpha}_n$$$.
Following previous work4,7, we perform estimation by solving a nonnegativity-constrained spatially-regularized least-squares optimization problem:
$$\arg\min_{\boldsymbol{\alpha} \geq \mathbf{0}} \sum_{n=1}^{N_1N_2}\frac{1}{2} \|\mathbf{d}_n - \boldsymbol{\Phi\alpha}_n\|_2^2 + \frac{\lambda}{2} \|\mathbf{D}\boldsymbol{\alpha}\|_2^2$$
In this expression, $$$\lambda$$$ is a regularization parameter and $$$\mathbf{D}$$$ is a spatial finite difference operator. The first term in the objective function imposes data consistency and the second term imposes spatial regularization. The use of spatial regularization substantially reduces the ill-posedness of the estimation problem4.
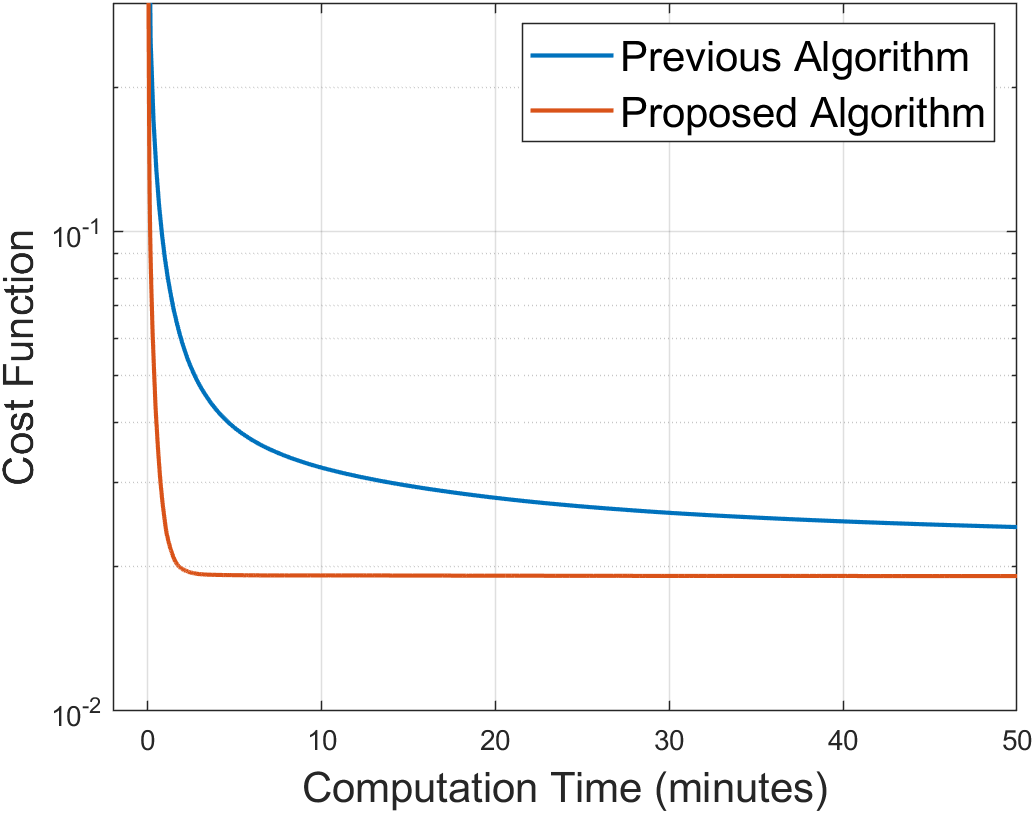
To solve this optimization problem, we propose a novel adaptation of the Generalized ADMM algorithm10 together with the Sherman-Morrison-Woodbury formula11 to greatly simplify each of the optimization subproblems. A description of our proposed algorithm (with a comparison against the algorithm used in previous work4,7) is shown in Figure 1.
Results
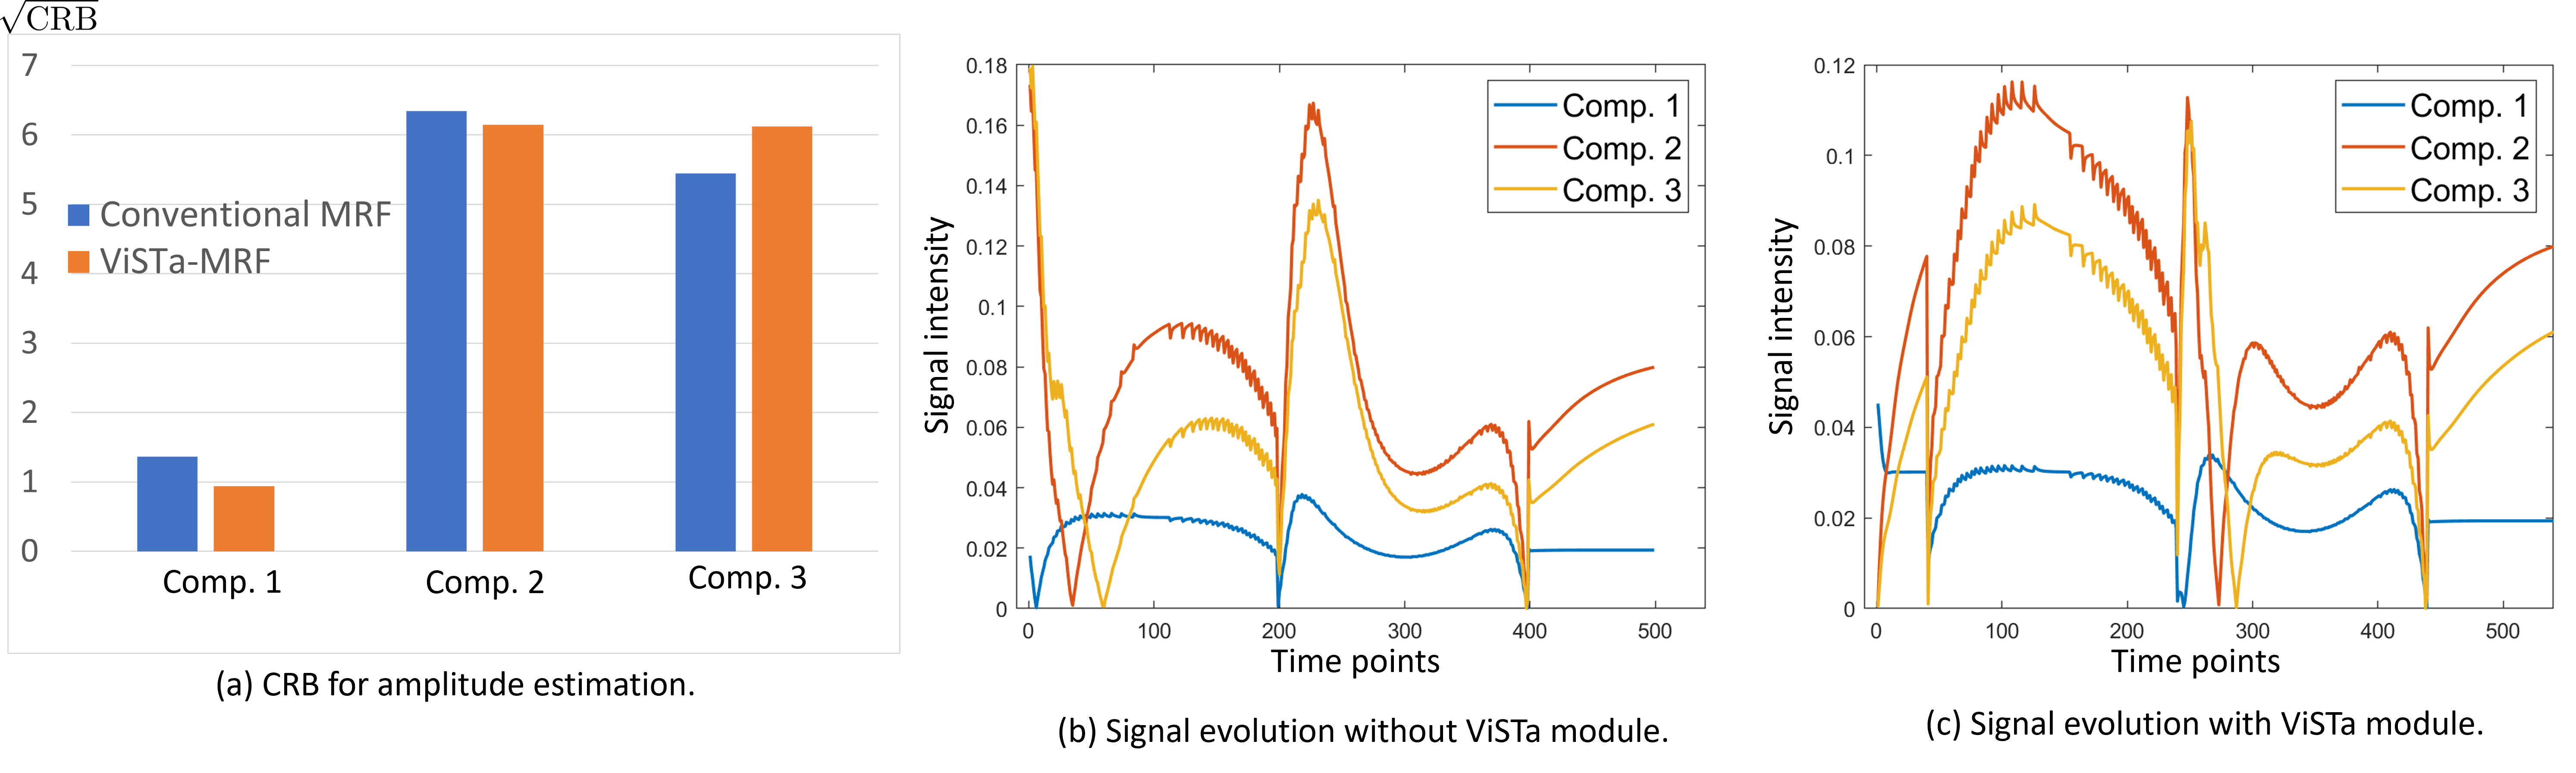
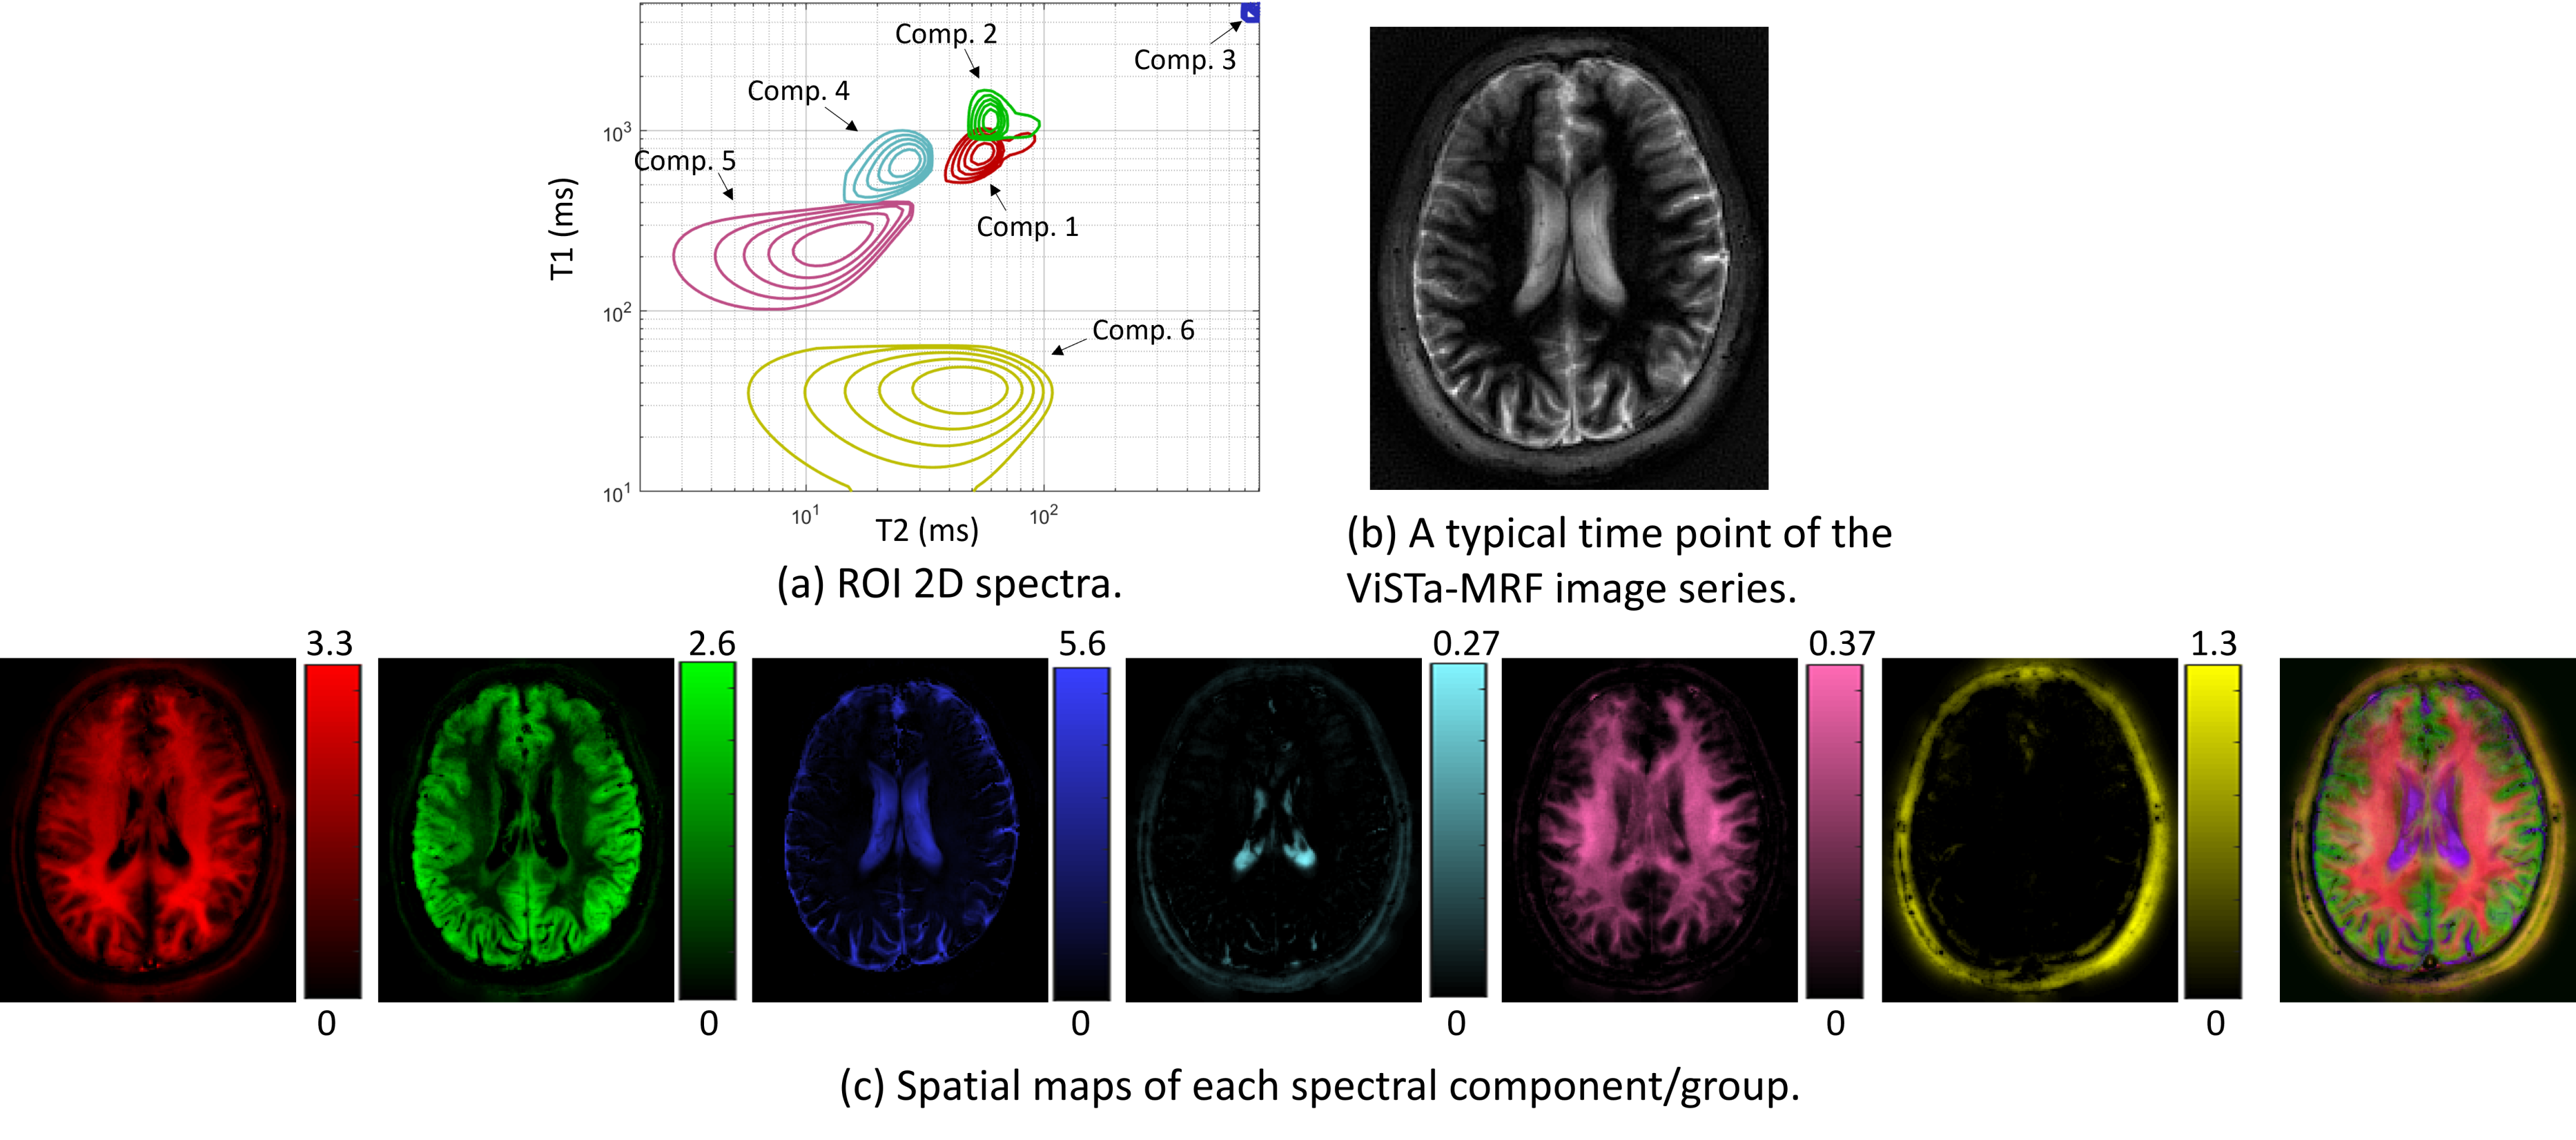
Figure 2(a) shows a comparison of Cramer-Rao bounds for the proposed ViSTa-MRF and conventional MRF sequences when estimating a 3-compartment model (comp. 1: T1/T2=120/20ms; comp. 2: T1/T2=750/60ms; comp. 3: T1/T2=1300/75ms). As can be seen, the proposed ViSTa-MRF sequence has a smaller Cramer-Rao bound for the short-T1 component (comp. 1), suggesting that it encodes information about that component better than the conventional MRF sequence. Figure 2(b,c) shows the signal evolution curves for the three components. It can be observed the for the ViSTa-MRF sequence, the first timepoint of this curve provides excellent separation of the short-T1 component (comp. 1) from the other two components.Figure 3 shows spectroscopic imaging results, demonstrating that we successfully resolve at least 6 anatomically plausible tissue compartments, including a short-T1 component (comp. 5) that appears to be consistent with myelin water (which was not visible in previous MRF-based 2D relaxation spectroscopic imaging7).
Figure 4 shows that the estimated short-T1 component (comp. 5) is consistent with the first point measured after the ViSTa module (which is expected to contain only short-T1 components), although with better SNR and with better separation from short-T1 extra-cranial tissue.
Figure 5 shows that the proposed algorithm converges substantially faster than the previous algorithm.
Conclusions
This work makes the novel observation that the combination of ViSTa and MRF has good estimation-theoretic properties that can enable better identification of short-T1 components in high-dimensional T1-T2 correlation spectroscopic imaging. Empirical results demonstrate the ability to identify at least 6 anatomically plausible tissue components, including a short-T1 component that was not resolved when using MRF without ViSTa. We also proposed a novel algorithm for estimating the high-dimensional spectroscopic image that offers substantial computational advantages over the previous algorithm.Acknowledgements
This work was supported in part by NIH grants R01-MH116173 and R01-NS0074980, as well as a USC Viterbi/Graduate School Fellowship.References
- D. McGivney, A. Deshmane, Y. Jiang, D. Ma, C. Badve, A. Sloan, V. Gulani, M. Griswold. Bayesian estimation of multicomponent relaxation parameters in magnetic resonance fingerprinting. Magn Reson Med 80:159-170, 2018.
- S. Tang, C. Fernandez-Granda, S. Lannuzel, B. Bernstein, R. Lattanzi, M. Cloos, F. Knoll, J. Asslander. Multicompartment magnetic resonance fingerprinting. Inverse Probl 34:094005, 2018.
- A. Deshmane, D. F. McGivney, D. Ma, Y. Jiang, C. Badve, V. Gulani, N. Seiberlich, M. A. Griswold. Partial volume mapping using magnetic resonance fingerprinting. NMR Biomed 32:e4082, 2019.
- D. Kim, J. Wisnowski, C. Nguyen, J. Haldar. Multidimensional correlation spectroscopic imaging of exponential decays: From theoretical principles to in vivo human applications. NMR Biomed 33:e4244, 2020.
- Nagtegaal M, Koken P, Amthor T, Doneva M. Fast multi-component analysis using a joint sparsity constraint for MR fingerprinting. Magn Reson Med 83:521-534, 2020.
- D. Ma, V. Gulani, N. Seiberlich, K. Liu, J. Sunshine, J. Duerk, M. Griswold. Magnetic resonance fingerprinting. Nature 495:187-192, 2013.
- D. Kim, B. Zhao, L. Wald, J. Haldar. Multidimensional T1 relaxation – T2 relaxation correlation spectroscopic imaging with a magnetic resonance fingerprinting acquisition. ISMRM 2019, p. 4991.
- S. Oh, M. Bilello, M. Schindler, C. Markowitz, J. Detre, J. Lee. Direct visualization of short transverse relaxation time component (ViSTa). NeuroImage 83:485-492, 2013.
- C. Liao, X. Cao, T. Gong, Z. Wu, Z. Zhou, H. He, J. Zhong, and K. Setsompop. High-resolution myelin-water fraction (MWF) and T1/T2/proton-density mapping using 3D ViSTa-MR fingerprinting with subspace reconstruction. ISMRM 2021, p. 1545.
- W. Deng, W. Yin. On the global and linear convergence of the generalized alternating direction method of multipliers. J Sci Comput 66:889-916, 2016.
- C. Meyer. Matrix Analysis and Applied Linear Algebra. SIAM, 2000.
Figures