2712
Effects of temperature in the estimation of inhomogeneous magnetic transfer (ihMT) in post-mortem human brain1Institut für Systemische Neurowissenschaften, Universitätklinikum Hamburg-Eppendorf, Hamburg, Germany, 2Medical Radiation Physics, IKVL, Lund University, Lund, Sweden, 3Department of Neurophysics, Max Planck Institute for Human Cognitive and Brain Sciences, Leipzig, Germany, 4Felix Bloch Institute for Solid State Physics, Faculty of Physics and Earth Sciences, Leipzig University, Leipzig, Germany
Synopsis
Inhomogeneous magnetic transfer (ihMT) is more sensitive to myelin macromolecules than standard MT proxies. Measuring ihMT in the multi-parameter mapping protocol allows calculating ihMT from MT saturation (MTsat) maps and thus inherently correct for the undesired dependencies on flip angle and the longitudinal relaxation rate. Further validation of this new ihMT metric requires measurement of MPM-based ihMT of human post-mortem material. Here, we showed that ihMT of a whole human post-mortem brain is feasible but can lead to temperature increase in the specimen, which is particularly pronounced in white matter.
Introduction
Measuring inhomogeneous magnetic transfer (ihMT) in the multi-parameter mapping (MPM1) protocol (hereafter called ihMT-MPM protocol) at 3T, allows us to calculate ihMT from MT saturation (MTsat) maps and thus inherently correct for the influence of flip angle, B1+ and the longitudinal relaxation rate (R1)2. The advantage of ihMTsat over MTsat maps is thought to be its direct sensitivity to the phospholipids in myelin3,4. Validation, however, requires further post-mortem experiments using human brain tissue. Such measurements are not restricted to acquisition time and SAR. However, absorption of the radio-frequency (RF) power by the conductive fixation solution can increase the temperature given the highly RF intensive measurements, which can be likely a confounding factor for post-mortem validation experiments. In this work, we aimed to describe qualitatively the influence of temperature on the ihMT contrast in a formalin-fixed specimen of the human brain. To that end, we acquired a series of three repeated ihMT-MPM experiments on a whole human brain and used the mean diffusivity (MD) as a marker of temperature from acquired diffusion-weighted images in-between acquisitions.Methods
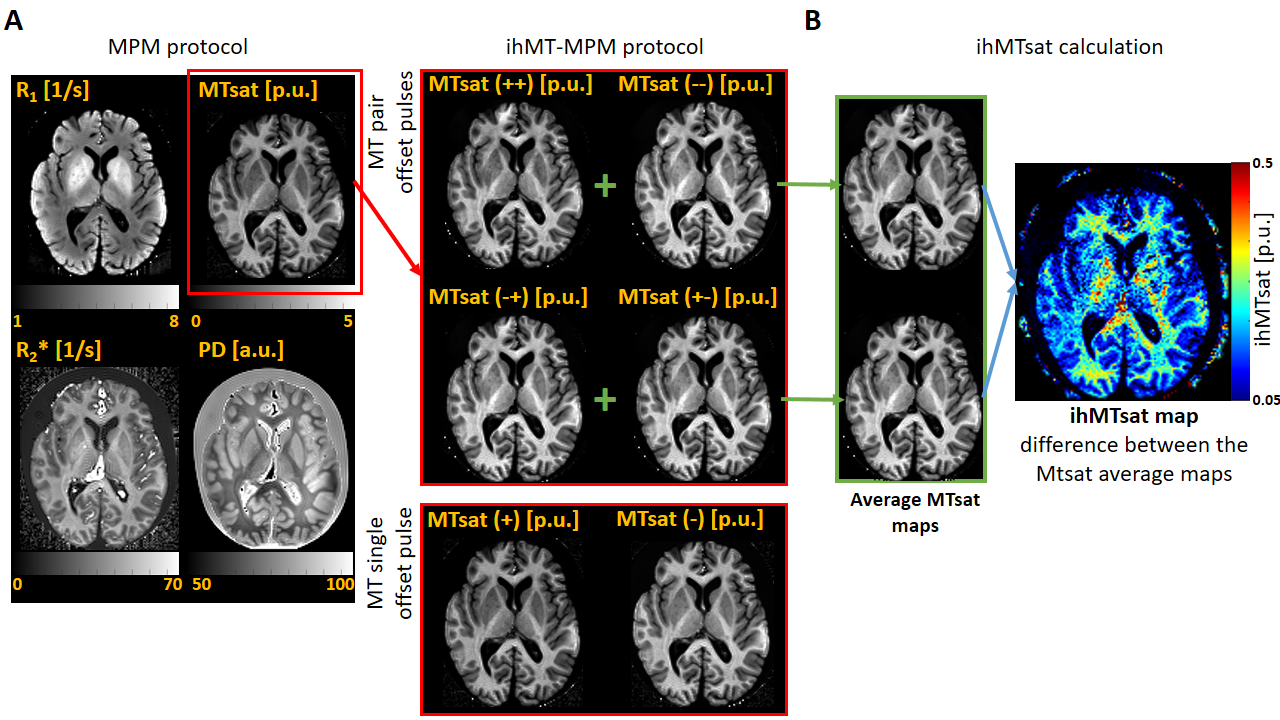
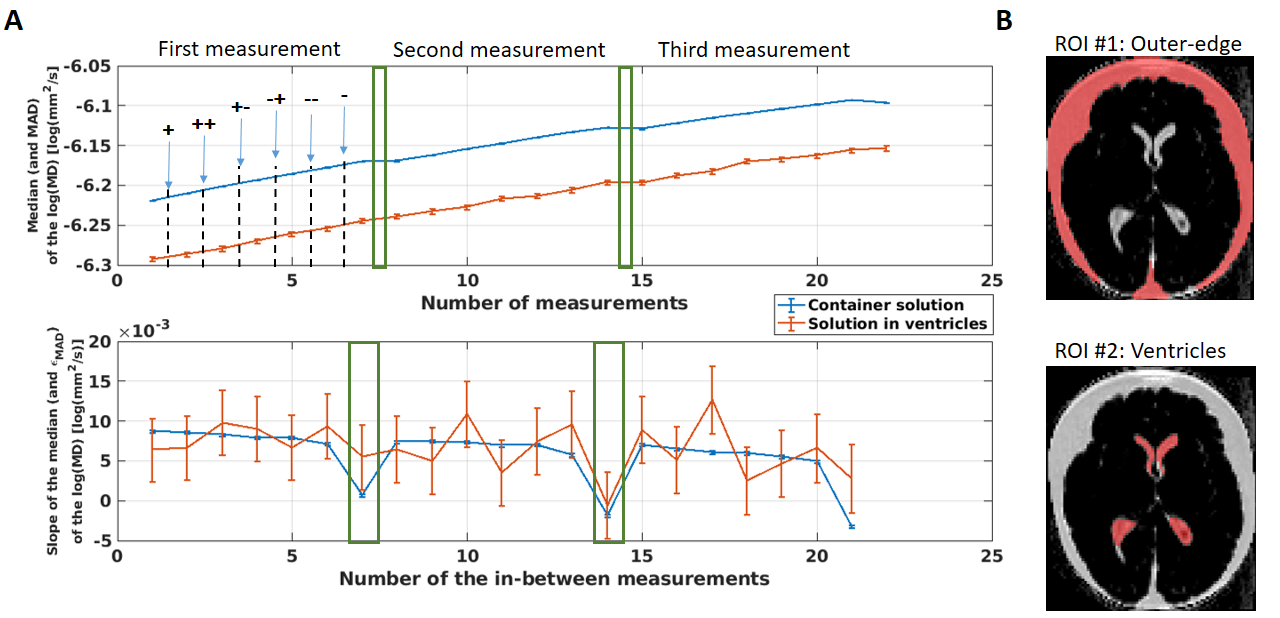
Ex vivo specimen: One post-mortem human brain, without any neurological disease reported (63 years old, post-mortem interval: 18h), was dissected at autopsy with prior informed consent (WF-74/16) and fixed with 4% paraformaldehyde (PFA) in a buffered aqueous solution.Acquisition: Whole brain imaging was performed on a 3T PRISMA fit MRI (Siemens Healthcare, Erlangen, Germany) with a Siemens 32-channel receiver head-coil. These images were acquired using the MPM1 protocol, which consists of a B1+ calibration5 and a 3D multi-echo spoiled fast-low-angle-shot (FLASH)6 sequence with three different signal weightings (T1, MT, and proton density, PD) that yield the PD, R1, the effective transverse relaxation rate (R2*) and MTsat. An ihMT-MPM protocol2 requires the acquisition of four MTw images instead, using four pairs (or 8) of Gaussian subpulses with equal or different frequency offset signs (++, +-, -+ and --) (Figure 1A). In this work, we also acquired two scans with single MT saturation pulse at opposite frequency offsets (+ and -). This ihMT-MPM protocol (T1w, PDw and 6 MTw images) was repeated three times using 8 MT saturation pulses of 1 ms or a single one of 8.7 ms duration, a flip angle of 464°, and a frequency offset of 3 kHz, at the same TR of 25 ms. The other imaging parameters are reported in Table 1. Temperature was estimated via the logarithm of the MD7. The MD maps were acquired in between MTw images and in between repetitions (the latter with a cool down period of 7.5 min), using a set of diffusion-weighted spin echo images (duration ~ 1 min at 35% SAR) were acquired (b-values: 0 and 1000 s/mm2, 6 diffusion-weighted directions).
Analysis: R1, PD and MTsat images were estimated using the hMRI toolbox (https://hMRI.info)8 for each individually acquired MTw image. The average of MTsat with single offsets (++ and --) shows ihMT whereas the average of MTsat with alternating signs is required aditionally for ihMT estimation. Their difference is the ihMTsat map2 (Figure 1B). The MD maps were obtained by analysing the diffusion data with FSL9. To assess a possible spatial temperature dependency, two ROIs containing the specimen’s solution were selected: at the outer edges of the specimen and in between the ventricles (Figure 2). Then, the median and MAD of the log(MD) values were obtained for both ROIs along the entire experiment. To study the temperature-dependent ihMTsat variation, a white matter (WM) and grey matter (GM) masks were created and used. To correlate this difference with temperature, similar masks were used for the MD maps.
Results and Discussion
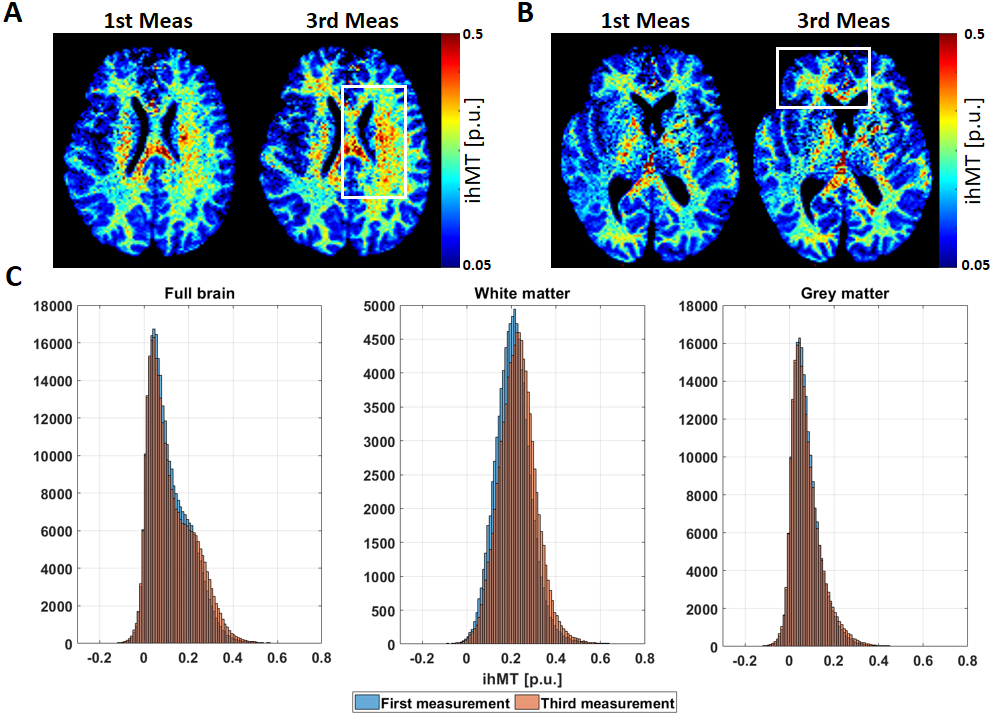
The log(MD) increases linearly after the acquisition of each MTw image. This increment is observed equally in the outer-specimen solution and in the ventricles (Figure 2A, top plot). As expected, the rate of the log(MD) (Figure 2A, bottom plot) in ROI #1 is approximately constant, since the SAR was kept equal across acquisitions. However, the rate varied strongly in ROI #2, indicating a non-linear heat exchange in the centre of the specimen. The 7.5 minutes pause was not sufficient in cooling down the specimen (log(MD) slope ≈ 0).Importantly, the estimated ihMT maps increased with increasing temperature (white boxes in Figure 3A and 3B). The highest variation of temperature was observed in WM, with an increment of 10% in the mean ihMT, from 0.215 to 0.235 p.u., and shifted distribution to higher ihMT values (Figure 3C, second histogram).
The rate of change in ihMT was almost two orders of magnitude larger in WM (R2: 0.984 with a slope of 0.1324 p.u./log(mm2/s), Figure 4A) than in GM (R2: 0.95 with a slope of 0.0037 p.u. log(mm2/s), Figure 4B). This is expected because of the presence of myelin water in WM. Exchange with the dominant water component will increase via an increase in membrane permeability.
Conclusion
We acquired ihMTsat maps of postmortem human whole-brain specimens. The absence of perfusion leads to measurable temperature increase during the RF intensive ihMTsat measurements, which particularly affects the ihMTsat parameters in white matter. Thus, robust postmortem ihMTsat measurements require either short acquisition time or extra precaution to control the temperature of the specimen.Acknowledgements
This work was supported by the German Research Foundation (DFG Priority Program 2041 "Computational Connectomics”, [MO 2397/5-1,2], by the Emmy Noether Stipend: MO 2397/4-1) and by the BMBF (01EW1711A and B) in the framework of ERA-NET NEURON. The research leading to these results has received funding from the European Research Council under the European Union's Seventh Framework Programme (FP7/2007-2013) / ERC grant agreement n° 616905.References
1. Weiskopf, N., Suckling, J., Williams, G., et al. Quantitative multi-parameter mapping of R1, PD(*), MT, and R2(*) at 3T: a multi-center validation. Front Neurosci 2013, 7, 95.
2. Helms, G., Valcuciakova, L., Pine, K.J., Moeller, H.E., Weiskopf, N.. Measuring inhomogeneous MT (ihMT) in human brain by multi-parameter mapping (MPM), in: Proc. Intl. Soc. Mag. Reson. Med. 29, 2021.
3. Duhamel, G., Prevost, V.H., Cayre, M., et al. Validating the sensitivity of inhomogeneous magnetization transfer (ihMT) MRI to myelin with fluorescence microscopy. NeuroImage 2019, 199, 289–303.
4. Rowley, C.D., Leppert, I.R., Campbell, J.S.W., et al. g-Ratio in the common marmoset: a comparison across different myelin-sensitive MRI metrics with b-tensor encoded diffusion, in: Proc. Intl. Soc. Mag. Reson. Med. 29, 2021.
5. Lutti A, Stadler J, Josephs O, et al. Robust and fast whole brain mapping of the RF transmit field B1 at 7T. PloS One 2012;7:e32379
6. Helms, G., Dathe, H., Kallenberg, K., Dechent, P.. High-resolution maps of magnetization transfer with inherent correction for RF inhomogeneity and T1 relaxation obtained from 3D FLASH MRI. Magn. Reson. Med. 2008, 60, 1396–1407
7. Holz, M., Heil, S.R., Sacco, A. Temperature-dependent self-diffusion coefficients of water and six selected molecular liquids for calibration in accurate 1H NMR PFG measurements. Phys Chem Chem Phys 2000, 2, 4740–4742.
8. Tabelow K, Balteau E, Ashburner J, et al. hMRI - A toolbox for quantitative MRI in neuroscience and clinical research. NeuroImage 2019;194:191–210
9. Jenkinson, M., Beckmann, C.F., Behrens, T.E.J., Woolrich, M.W., Smith, S.M. FSL. NeuroImage 2012, 62, 782–790.
Figures