2125
Proof of concept of volumetric MR-temperature monitoring during microwave ablation of liver tumor in a patient1Certis Therapeutics, Pessac, France, 2INSERM, Centre de Recherche Cardio-Thoracique de Bordeaux, U1045, Bordeaux, France, 3IHU Liryc, Electrophysiology and Heart Modeling Institute, Hopital Xavier Arnozan, Pessac, France, 4UMR5536 CRMSB, Bordeaux, France, 5Department of Radiology, University Hospital, LMU Munich, Munich, Germany
Synopsis
Microwave tumor ablation in the liver is commonly performed in computed tomography scanners with limited imaging capability for real-time monitoring of treatment progression. Performing this procedure under MRI enables to monitor temperature and thermal dose during the ablation. It allows better understanding of the lesion creation and gives better insight of the treatment outcome. In this study, we evaluate a complete MR-guided workflow that include volumetric temperature and dose monitoring during ablation using an ultrafast EPI sequence with respiratory triggering. Results show that spatial extent of the lesion can be monitored and displayed in real-time.
Background
Microwave ablation of liver tumors is commonly performed in computed tomography scanners. The workflow consists of a pre-ablation image to position the ablation probe and a post-ablation image for the assessment of the treatment outcome. Energy delivery is planned using power/time abacus and no quantitative temperature imaging is performed during the procedure. Microwave ablation of liver tumors under MRI monitoring was already demonstrated, but with limited volumetric coverage and spatial resolution [1-2]. Under MRI-guidance, this procedure benefits from a unique imaging modality that provides the 3D image of the tumor, the ability to position the ablation probe interactively while scanning and finally the possibility to monitor the energy delivery using temperature [3], thermal dose [4] mapping and the spatial extent of the lesion. Having such information in real-time would allow the clinician to have a better control of the therapeutic procedure. In this study, we are presenting a proof of feasibility of volumetric temperature and dose monitoring during microwave ablation of a liver tumor in a patient.Material and Methods
Patient: The study was approved by the local institutional review board authorities. During the procedure, the patient was under general anesthesia and was continuously cared by medical staff.Ablation device: An AveCure microwave system (MedWaves, San Diego, USA) was used to perform the ablation. A 14-gauge large antenna was utilized. Ablation duration was set to 10 minutes.
MRI acquisition protocol: The ablation procedure was performed on a 1.5T MRI scanner (Magnetom Aera, Siemens Healthineers, Erlangen, Germany) and included the following imaging protocol.
- 3D breath-hold T1-weighted and 2D T2-weighted sequences were performed to locate the tumor and have baseline images prior ablation.
- Probe insertion was performed using the needle tracking prototype sequence from Siemens (WIP1075, Siemens Healthineers, Erlangen, Germany). It consists of positioning an entry and a target end point for the trajectory of the needle. While inserting, three orthogonal slices are acquired successively and displayed inside the MRI room for the clinician handling the probe.
- Prior to ablation, the two 3D T1 and T2 weighted acquisitions were repeated to confirm the final position of the needle.
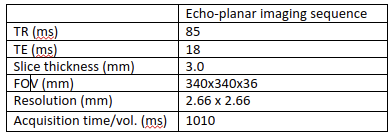
- Temperature and thermal dose monitoring was then performed under respiratory gating using a cushion positioned on the patient's abdomen. A stack of 13 contiguous slices (no slice gap) was acquired during the exhalation phase using a single shot gradient-echo echo planar imaging (EPI) sequence. Table 1 summarizes the acquisition parameters.
MR-guided intervention software platform: All images produced by the MRI scanner were transferred in real-time to a remote computer that compute temperature (PRFS technique) and thermal dose (CEM43 of 240 minutes as a threshold) maps for online visualization using dedicated software (Certis Solution, Certis Therapeutics, Pessac, France). The thermometry reconstruction pipeline included a low-pass filter and a temperature baseline correction algorithm. Temperature or thermal dose images were overlaid to 3D T1-weighted anatomical images. This online display was replicated inside the MRI room using a dedicated screen to provide identical information to the physician.
Results
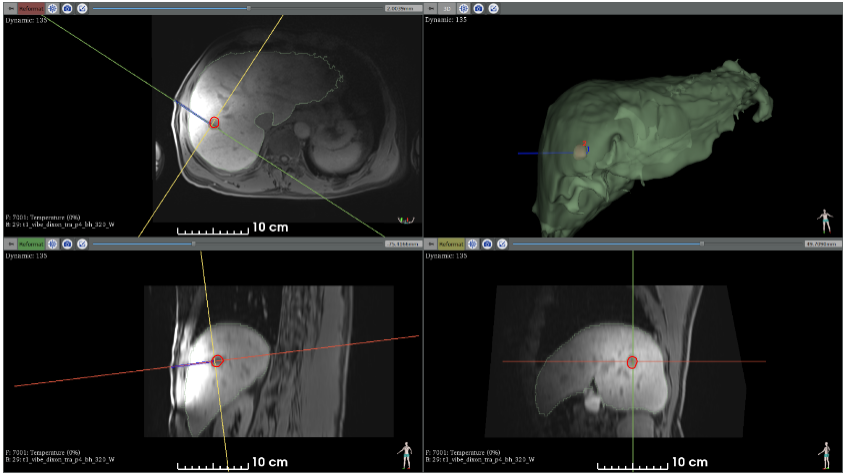
The entire ablation procedure was successfully monitored under MRI (planning, probe insertion, real-time thermometry/dosimetry).Figure 1 shows the T1-weighted image after probe insertion (see blue cylinder). Liver and tumor segmentations are shown.
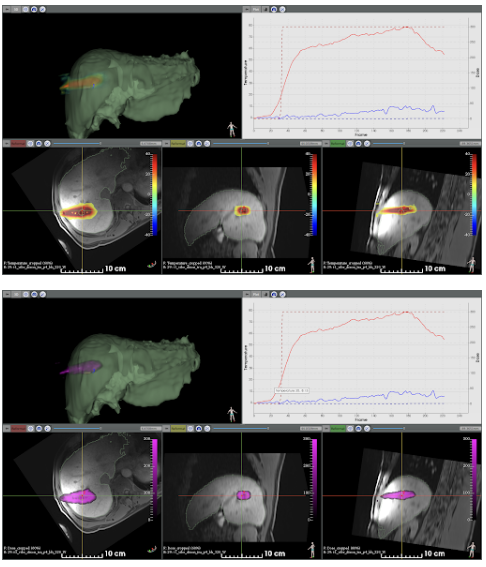
Figure 2 shows available information during the procedure, including the T1-weighted pre-ablation 3D dataset, the segmented 3D mesh of the liver (in green), the temperature (top view) and thermal dose (bottom view) images (color-coded) overlaid on reformatted slices from the T1-weighted images. The software interface allowed for visualization of temperature/thermal dose evolution in selected pixels. Please note that no artifacts were observed on temperature during microwave emission.
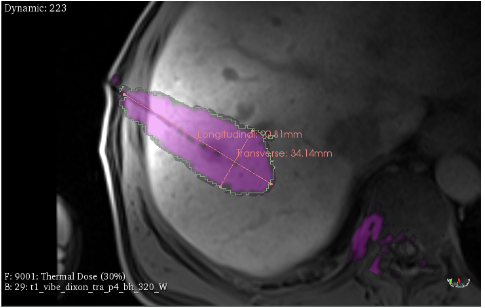
The estimated lesion characteristics based on the thermal dose calculation was 37cm3 with the maximum longitudinal and transverse size of 91mm and 34mm, respectively (Figure 3).
Discussions
In this study, we have demonstrated the feasibility of monitoring both the temperature and the thermal dose during an MR-guided liver ablation under respiratory gating. The fast acquisition sequence enabled to monitor temperature and thermal dose in a large volume (36 mm coverage in the slice direction), with an update time of one respiratory cycle. Using this fast acquisition, inter slice motion is limited as all slices are acquired in ~1s during the expiration phase.A disadvantage of using the EPI sequence is the presence of geometric distortion artifacts in the phase-encoding direction, resulting in pixel shifts in the images. These artifacts should be corrected to enable a better accuracy of the heating location to allow precise correspondence with 3D anatomic image acquired prior to ablation.
Conclusions
This study shows the feasibility of a fully MRI-guided microwave ablation procedure, including 1) pre-operative 3D imaging, 2) interactive imaging for needle insertion to the targeted location and 3) real-time volumetric thermometry/thermal dosimetry during the procedure. Future work will include improved strategies to minimize effects of geometric distortion and liver motion.Acknowledgements
No acknowledgement found.References
[1] Lu, A., Woodrum, D. A., Felmlee, J. P., Favazza, C. P. & Gorny, K. R. Improved MR-thermometry during hepatic microwave ablation by correcting for intermittent electromagnetic interference artifacts. Physica Medica: European Journal of Medical Physics 71, 100–107 (2020).2.
[2] Gorny, K. R. et al. Practical implementation of robust MR-thermometry during clinical MR-guided microwave ablations in the liver at 1.5 T. Physica Medica 67, 91–99 (2019).
[3] Weidensteiner, C. et al. Stability of real-time MR temperature mapping in healthy and diseased human liver. Journal of magnetic resonance imaging: JMRI 19, 438–446 (2004). [4] Sapareto, S. A. & Dewey, W. C. Thermal dose determination in cancer therapy. International Journal of Radiation Oncology*Biology*Physics 10, 787–800 (1984).
[4] Sapareto, S. A. & Dewey, W. C. Thermal dose determination in cancer therapy. International Journal of Radiation Oncology*Biology*Physics 10, 787–800 (1984).
Figures