2106
Q-FiberMapper - A framework for tractography and tractometry of clinical data1QMENTA Inc., Barcelona, Spain
Synopsis
Despite recent advances in tractography, automatically reconstructing brain bundles in clinical settings remains a challenge. Here we present Q-FiberMapper (QFM), a framework that automatically preprocesses clinical data and reconstructs 33 major brain bundles with minimal user intervention. Furthermore, it derives insightful biomarkers and summarizes the findings in a human readable report. We validate QFM using a large cohort of 600 subjects, and show that it correctly reconstructs the shape and lateralization of major white-matter bundles. By simplifying and speeding the process of clinical reconstruction, QFM could help clinicians in the diagnosis and monitoring of brain pathologies.
Introduction
Diffusion tractography enables dissecting the white matter in vivo and non-invasively. When done manually, reconstructing the brain’s major pathways is a highly time consuming and error-prone process. All of these challenges lead to decreased reproducibility and therefore usability. To overcome this problem, recently developed automatic region-based reconstruction methods1-4 use predefined landmarks and rules to guide the tractography. Reconstructing tracts through such methods achieve accuracies comparable to that of manual dissections while achieving high reproducibility across subjects1,5-6 thus enabling the systematic study of large populations. However, bridging such methods into the clinical settings is still an open problem because of two main challenges. First, clinical data lacks standardization and requires tailored preprocessing. Second, implementing such methods requires a high technical knowledge, mostly beyond that of medical staff. To tackle these problems we introduce the Q-FiberMapper (QFM). QFM automatically standardizes and preprocess MRI data, dissects 33 tracts, and derives insightful biomarkers with minimal user configuration. Furthermore, the tool summarizes the findings in a simple-to-read PDF. By speeding and simplifying the work of clinicians, our method brings a major positive impact on the diagnosis and monitoring of brain diseases.Methods
QFM streamlines the process of data processing, analysis and biomarker extraction (Figure 1). The minimum input expected by QFM is a T1 acquisition and a diffusion image. However, further information such as gradient field maps or brain masks can be provided.QFM starts by standardizing the inputs to the NIFTI file format and preprocessing the T1 and diffusion images. The T1 image is conformed to 1mm isometric resolution. The diffusion image is denoised, and corrected for motion, Gibbs artifacts, and eddy-currents using state-of-the-art algorithms implemented on MRTRIX7. Finally, the T1 is coregistered to the diffusion space8.
The preprocessed images are used to reconstruct a total of 33 white matter bundles, 13 bilaterally and 7 divisions of the Corpus Callosum (see Figure 2). Each tract is defined by a set of regions of interest (ROIs) in the MNI space. Such ROIs explain which regions the tract must transit, avoid and end in. To reconstruct these tracts we fit a constrained-spherical deconvolution model to the diffusion data and segment the T1 image into white-matter and gray-matter. Then, the white-matter mask is used as a seed mask for computing whole-brain probabilistic tractography. Finally, the tract-specific ROI’s are warped from MNI to the T1 space, and used to dissect the whole-brain tractography.
After reconstructing the tracts, QFM derives two metrics for each one of them: the tract lateralization based on the number of streamlines9, and the bundle profile using Fractional Anisotropy4. Such metrics have been found useful in the study of brain function4,10.
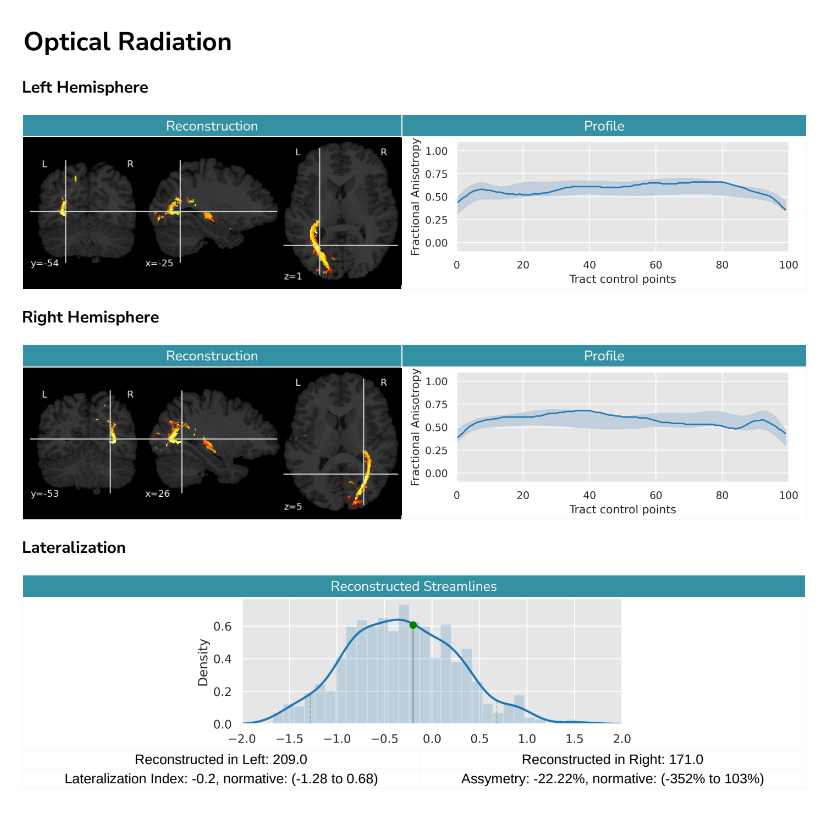
Finally, QFM compiles all the information into a human readable report (see Figure 3). The report summarizes in a user-friendly way the shape of the reconstructed tracts, as well as their bundle profile and lateralization. Furthermore, QFM can optionally include the result in the context of a reference group. In such a case, the patient's result will be shown and compared with the distribution of lateralization for a predefined reference population. In the same way, their bundle profiles will be shown and compared against the reference population's mean profile and its standard deviation.
Results
To validate QFM we performed several tests. In order to ensure the correct preprocessing of the data, we feed the tool with images from 10 different subjects in DICOM format. In all cases, we visually confirmed that the data was correctly preprocessed and aligned.To verify our reconstruction algorithm, we processed 600 healthy subjects from the Human Connectome Project dataset11 and studied the resulting tracts. On average, processing a subject took 40 minutes on a 4 cores machine. To assess their shape, we computed the average visitation map of each tract across subjects9. Figure 2 shows a 3D reconstruction of the probabilistic maps derived after thresholding at the level of 10%. This is, the figure highlights the voxel in which at least 10% of the population had at least one streamline crossing it. The reconstructed volumes closely follow the expected core-body of each tract, showing that our method consistently reconstructs the tracts correctly. Then, we further validated our technique by looking at the lateralization of language-related tracts. We found our results to be consistent with previous studies: the Arcuate Fascicle and Inferior Longitudinal Fascicle are left lateralized12–14; while the Superior Longitudinal Fascicle II and III, and the Uncinate Fascicle are right lateralized1,12,14.
Discussion and Conclusion
The results show that the bundles reconstructed by our technique have a shape and lateralization in line with the current neuroanatomy literature. This, added to the automatic preprocessing and reporting ability of our tool makes it ideal for the clinical setting. Furthermore, its ability to compare against a reference dataset opens the possibility of studying in-depth the impact of pathologies in the white matter’s structure, such as Alzheimer’s Disease, Multiple Sclerosis, Parkinson’s Disease, Traumatic Brain Injury, Dementia, and others. As future work, we are planning to enhance the QFM to be able to extract other complementary quantitative biomarkers that are more sensitive to different pathologies.Acknowledgements
No acknowledgement found.References
1. Warrington, S. et al. XTRACT - Standardised protocols for automated tractography in the human and macaque brain. Neuroimage 217, 116923 (2020).
2. Zhang, W., Olivi, A., Hertig, S. J., van Zijl, P. & Mori, S. Automated fiber tracking of human brain white matter using diffusion tensor imaging. NeuroImage vol. 42 771–777 (2008).
3. Yendiki, A. et al. Automated probabilistic reconstruction of white-matter pathways in health and disease using an atlas of the underlying anatomy. Front. Neuroinform. 5, 23 (2011).
4. Yeatman, J. D., Dougherty, R. F., Myall, N. J., Wandell, B. A. & Feldman, H. M. Tract profiles of white matter properties: automating fiber-tract quantification. PLoS One 7, e49790 (2012).
5. Catani, M. & Thiebaut de Schotten, M. A diffusion tensor imaging tractography atlas for virtual in vivo dissections. Cortex 44, 1105–1132 (2008).
6. Wakana, S. et al. Reproducibility of quantitative tractography methods applied to cerebral white matter. Neuroimage 36, 630–644 (2007).
7. Tournier, J.-D. et al. MRtrix3: A fast, flexible and open software framework for medical image processing and visualisation. Neuroimage 202, 116137 (2019).
8. Avants, B. B., Epstein, C. L., Grossman, M. & Gee, J. C. Symmetric diffeomorphic image registration with cross-correlation: evaluating automated labeling of elderly and neurodegenerative brain. Med. Image Anal. 12, (2008).
9. Thiebaut de Schotten, M. et al. Atlasing location, asymmetry and inter-subject variability of white matter tracts in the human brain with MR diffusion tractography. Neuroimage 54, 49–59 (2011).
10. Thiebaut de Schotten, M. et al. Atlasing location, asymmetry and inter-subject variability of white matter tracts in the human brain with MR diffusion tractography. Neuroimage 54, 49–59 (2011).
11. Van Essen, D. C. et al. The Human Connectome Project: a data acquisition perspective. Neuroimage 62, 2222–2231 (2012).12. Thiebaut de Schotten, M. et al. A lateralized brain network for visuospatial attention. Nat. Neurosci. 14, 1245–1246 (2011).
13. Warrington, S. et al. XTRACT - Standardised protocols for automated tractography in the human and macaque brain. Neuroimage 217, 116923 (2020).
14. Howells, H. et al. Frontoparietal Tracts Linked to Lateralized Hand Preference and Manual Specialization. Cerebral Cortex vol. 28 2482–2494 (2018).
Figures

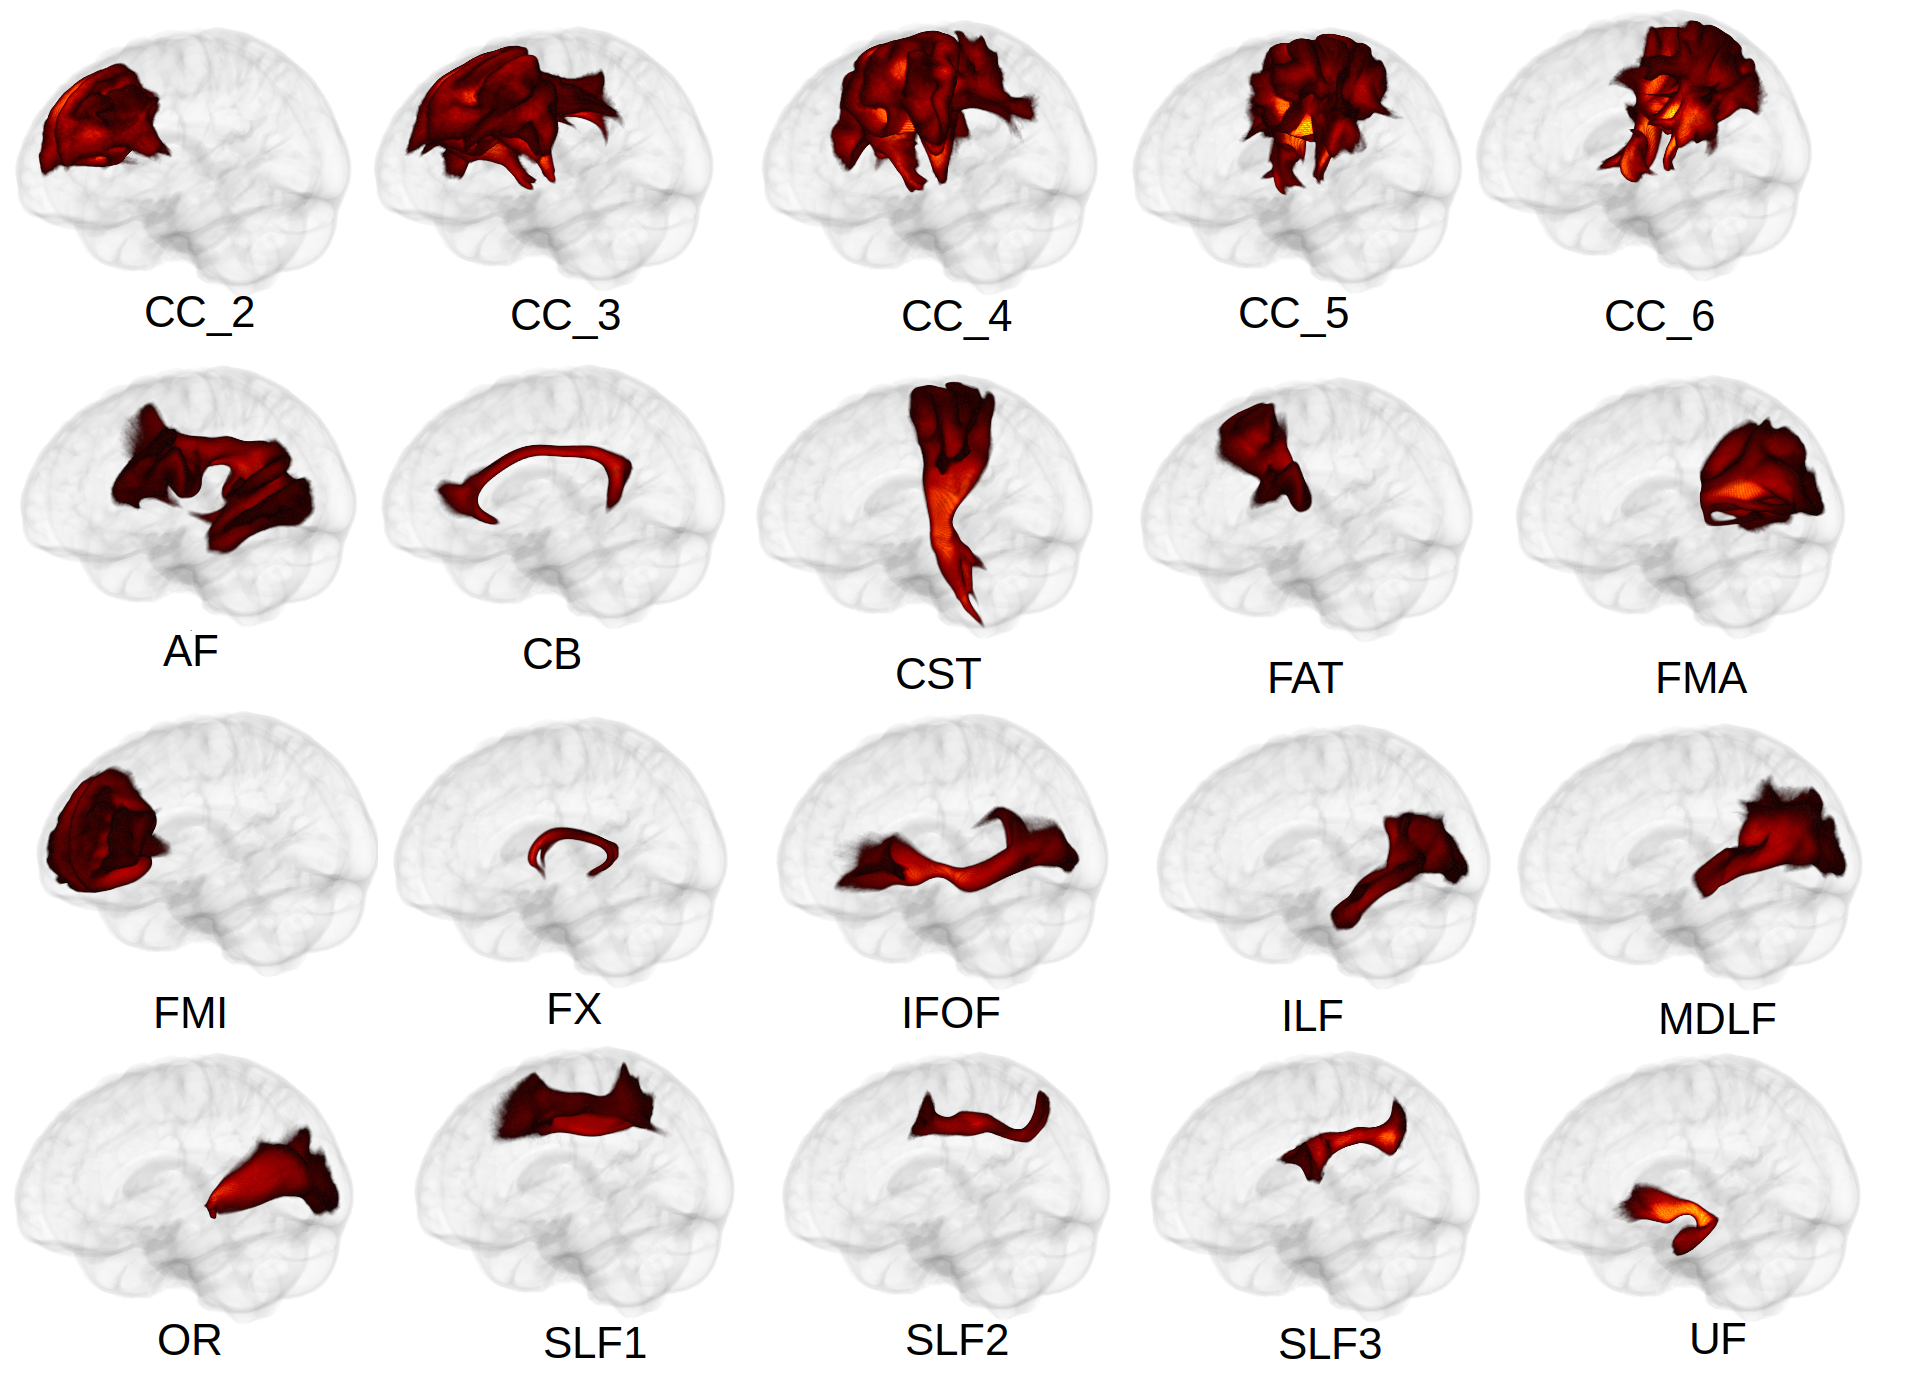
Figure 2. Average reconstructed tracts. The recovered volumes are consistent with what's expected from the literature. CC - Corpus Callosum; AF - Arcuate Fascicle, CB - Cingulum Bundle, CST - Cortico-Spinal tract, FAT - Fronto Aslant Tract, FMA - Forceps Major, FMI - Forceps Minor, FX- Fornix, IFOF - Inferior Fronto-Occipital Fascicle, ILF - Inferior Longitudinal Fascicle, MDLF - Middle Longitudinal Fascicle, OR - Optic Radiation, SLF - Superior Longitudinal Fascicle, UF - Uncinate Fascicle