0877
Does One Size Fit All? Reconstructing Crossing Fibers in Diffusion MRI using Spherical Deconvolution with Local Response Functions1Department of Neuropsychology, Max Planck Institute for Human Cognitive and Brain Sciences, Leipzig, Germany, 2Department of Neurophysics, Max Planck Institute for Human Cognitive and Brain Sciences, Leipzig, Germany, 3Alfred Wegener Institute Helmholtz Centre for Polar and Marine Research, Bremerhaven, Germany, 4Kolmården Wildlife Park, Norrköping, Sweden, 5CNRS Institute of Cognitive Sciences, Lyon, France, 6Max Planck Institute for Evolutionary Anthropology, Leipzig, Germany, 7Felix Bloch Institute for Solid State Physics, Faculty of Physics and Earth Sciences, Leipzig University, Leipzig, Germany
Synopsis
We present Local Spherical Deconvolution (LSD), a diffusion MRI deconvolution method to reconstruct crossing fiber directions in the brain. In contrast to previous approaches which assumed a single deconvolution kernel for the entire brain, LSD utilizes information theory to identify an optimal kernel in each image voxel. Using a high-resolution post-mortem chimpanzee brain, we show that fibers are reconstructed with LSD with increased precision and a reduced number of false peaks compared to conventional methods. A test-retest analysis supports the stability and accuracy of LSD.
Introduction
Diffusion MRI (dMRI) tractography is an established method for non-invasive reconstructions of brain connectivity (1). Tractography relies on accurate estimations of multiple fiber directions in each voxel (2). A long-established method for the reconstruction of crossing fibers is constrained spherical deconvolution (CSD) (3). CSD uses brain regions with a single fiber population to generate one deconvolution kernel to estimate the fiber Orientation Distribution Functions (fODF) in the entire brain. The choice of an adequate kernel is substantial, since poor kernels may corrupt the estimated number of fibers and directions (4). However, initial results on tract-specific microstructural properties challenge the assumptions of CSD and call for more adapted kernels in different brain regions (5). We here introduce Local Spherical Deconvolution (LSD), a method to reconstruct fiber directions with a voxel-wise selection of the optimal deconvolution kernel. LSD determines the kernel which locally best represents the dMRI data. We showcase the performance and stability of LSD using a high-resolution post-mortem chimpanzee dataset.Methods
Sample PreparationData were acquired post-mortem from the brain of a chimpanzee from Kolmården Zoo (f,47y, deceased from cervical leiomyoma, Ethics approved by Max Planck Society). The brain was extracted and immersion-fixed with 4% paraformaldehyde in phosphate-buffered saline (PBS) within 4h. After fixation, the paraformaldehyde was washed out in PBS. For scanning, the brain was placed in a spherical-shaped acrylic container filled with Fomblin (perfluorpolyether).
Data Acquisition
Whole-brain dMRI data were acquired on a Bruker Biospec 94/30 MRI system (9.4T). Data were acquired using segmented 3D-EPI (6): TR=1000ms, TE=58.9ms, 500µm isotropic resolution, Matrix-size=240×192×144, EPI-Segmentation=32, EPI-BW=400kHz, adiabatic refocusing (7), double EPI-sampling (8). DMRI data were acquired using b=5000s/mm2 in 58 directions, spread across a sphere, with three interspersed b=0 images. An additional b=0 volume was acquired with reversed phase-encoding (9). A noise map with matching parameters was recorded (10). For a test-retest evaluation, the data acquisition was independently repeated two weeks after the measurement.
Data Processing
Diffusion MRI preprocessing entailed the following steps: Signal debiasing utilizing noise-map (11), MP-PCA denoising (12); 3D Gibbs-Ringing correction (13,14); field-drift correction (15); eddy-current and distortions correction (9). To enable a voxel-wise test-retest analysis, without interpolation-induced loss of resolution, the retest data were warped on the test data in a one-step-correction approach (16).
Local Spherical Deconvolution
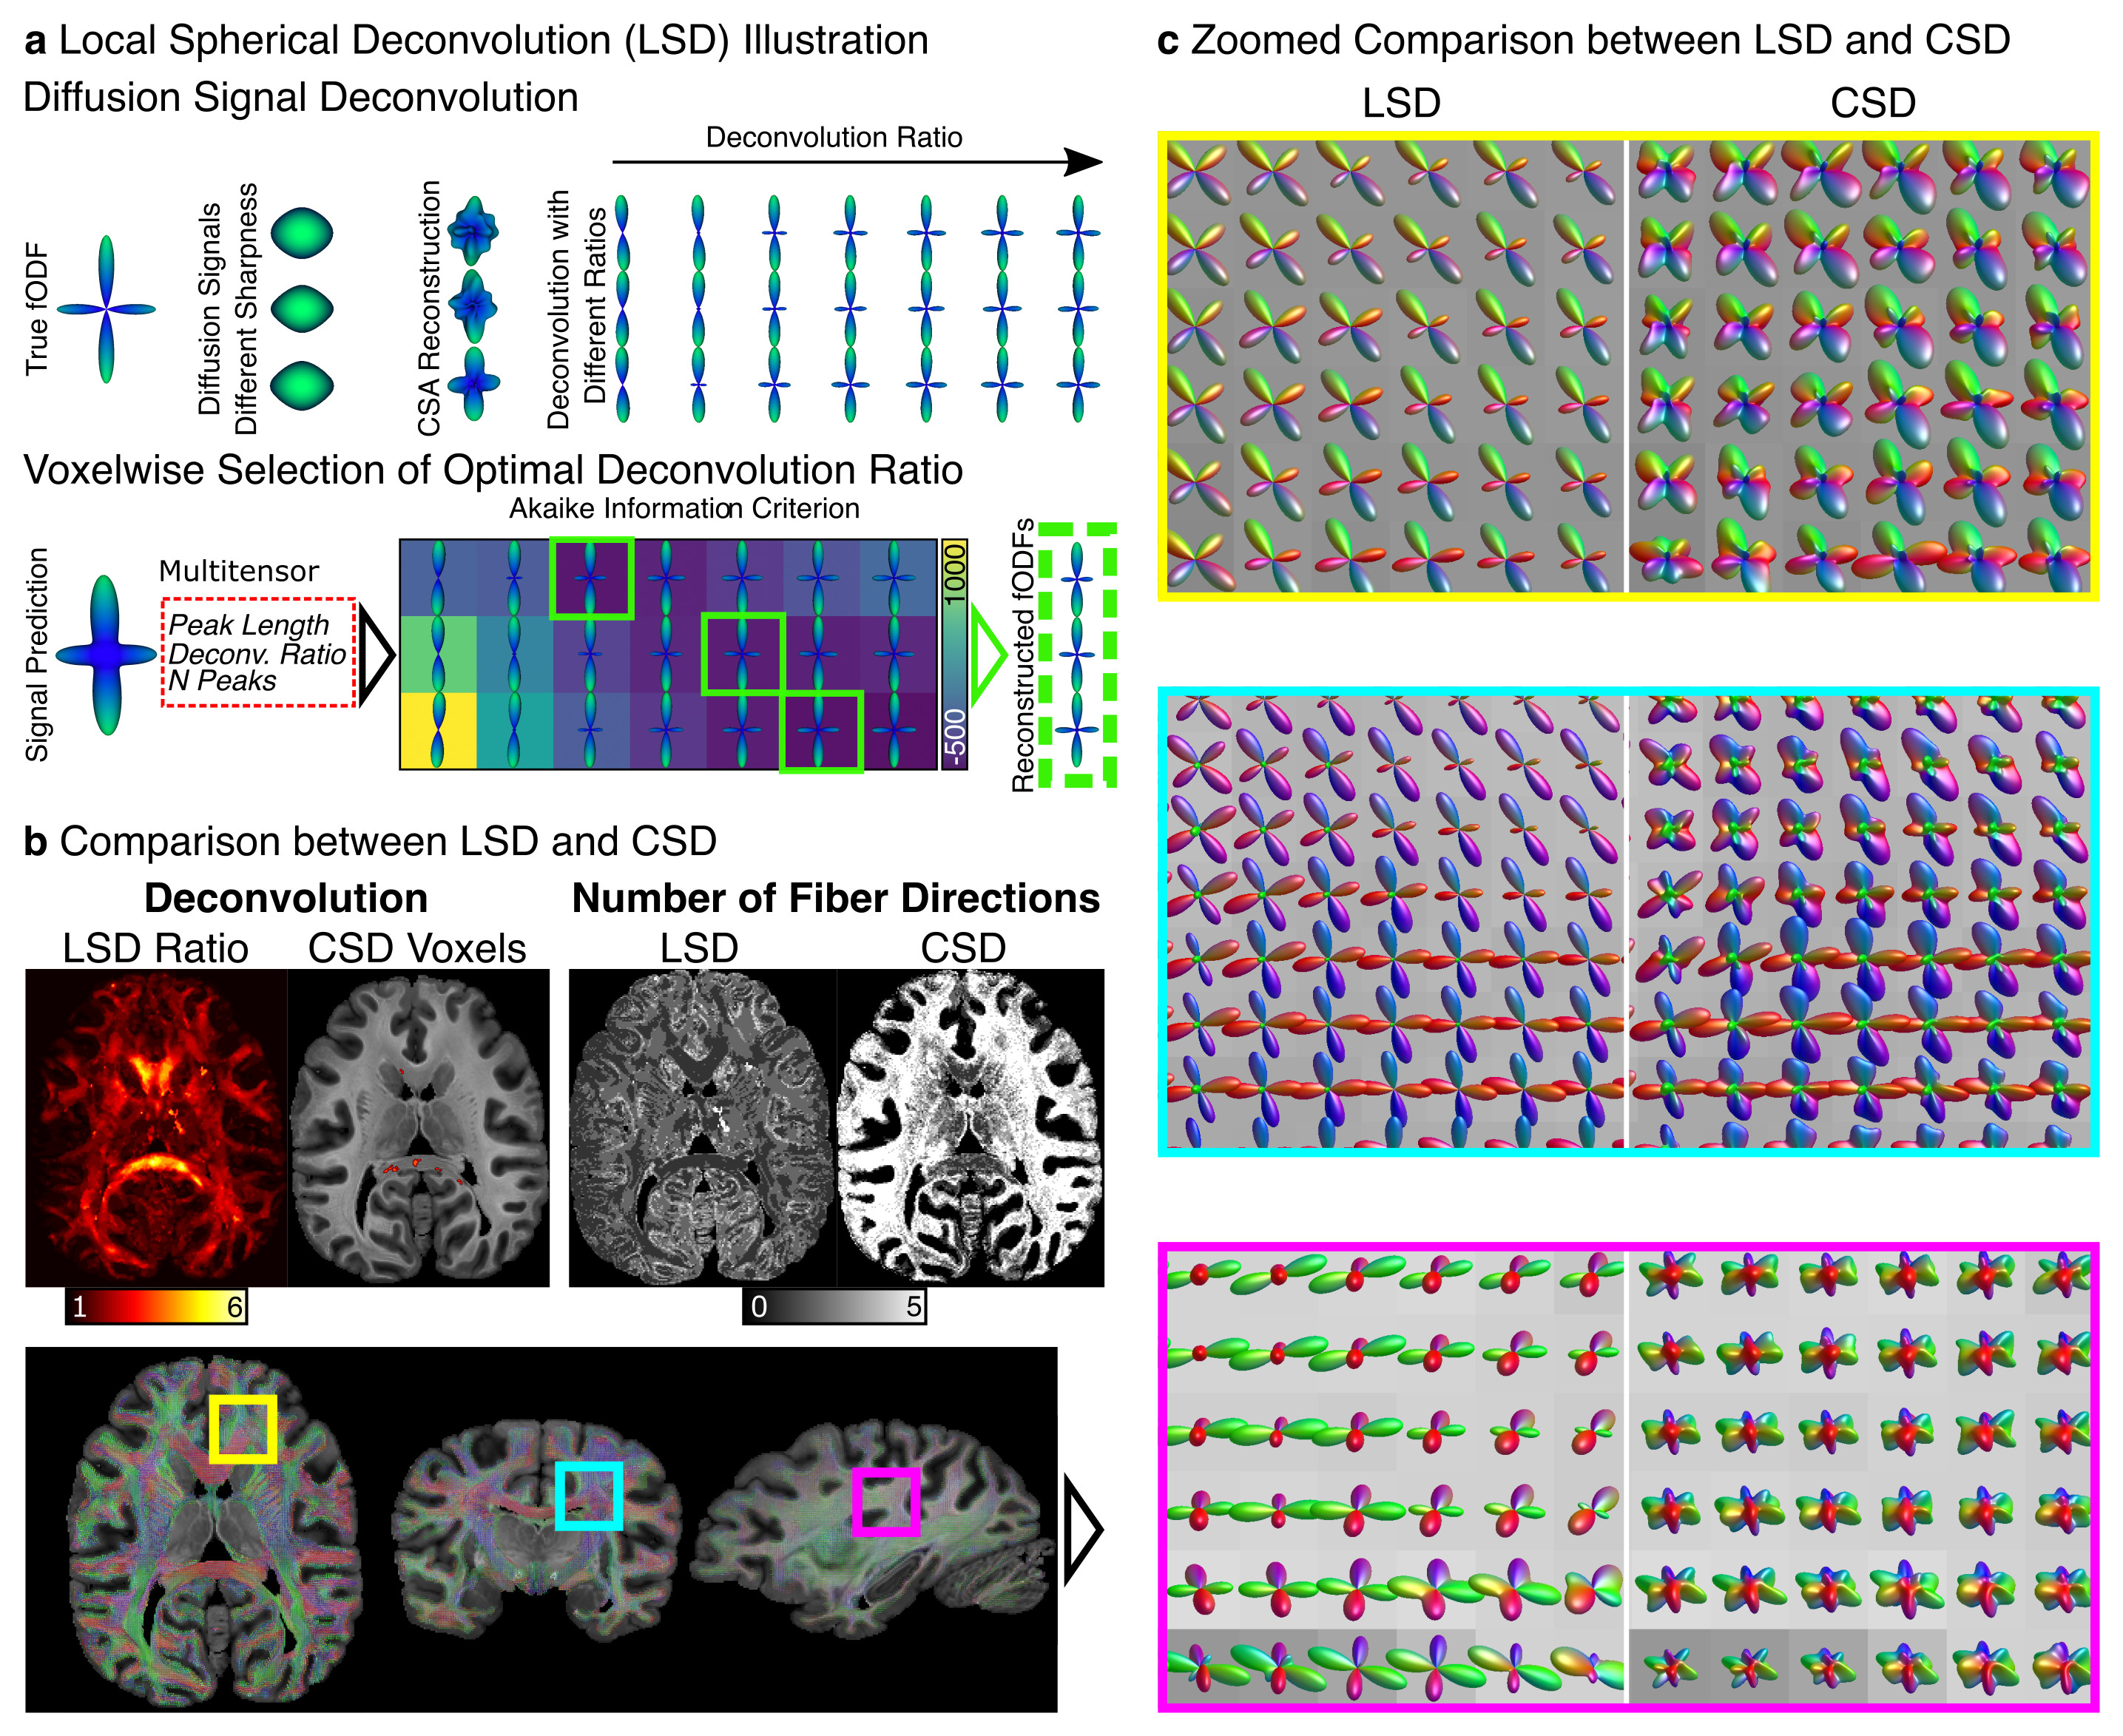
See Fig.1a: (i) dMRI data were converted to Diffusion Orientation Distribution Functions (dODF) using Constant Solid Angle (CSA) reconstruction (17). (ii) CSA-dODFs were converted into fODF candidates using the sharpening-deconvolution transform (18) using 17 predefined sharpening ratios, from 1.1 to 6.0. (iii) Peak orientation and volume fractions were extracted from fODF candidates to build a Multitensor (MT) model to predict the observed signal (19). MT parameters were derived from peak intensities, extracted directions, applied sharpening ratio, and mean dMRI signal (20). (iv) The Akaike Information Criterion (21) (AIC) was used voxel-wise to select the appropriate deconvolution ratio that minimizes the AIC with the number of peaks as model complexity.
Test-Retest Evaluation
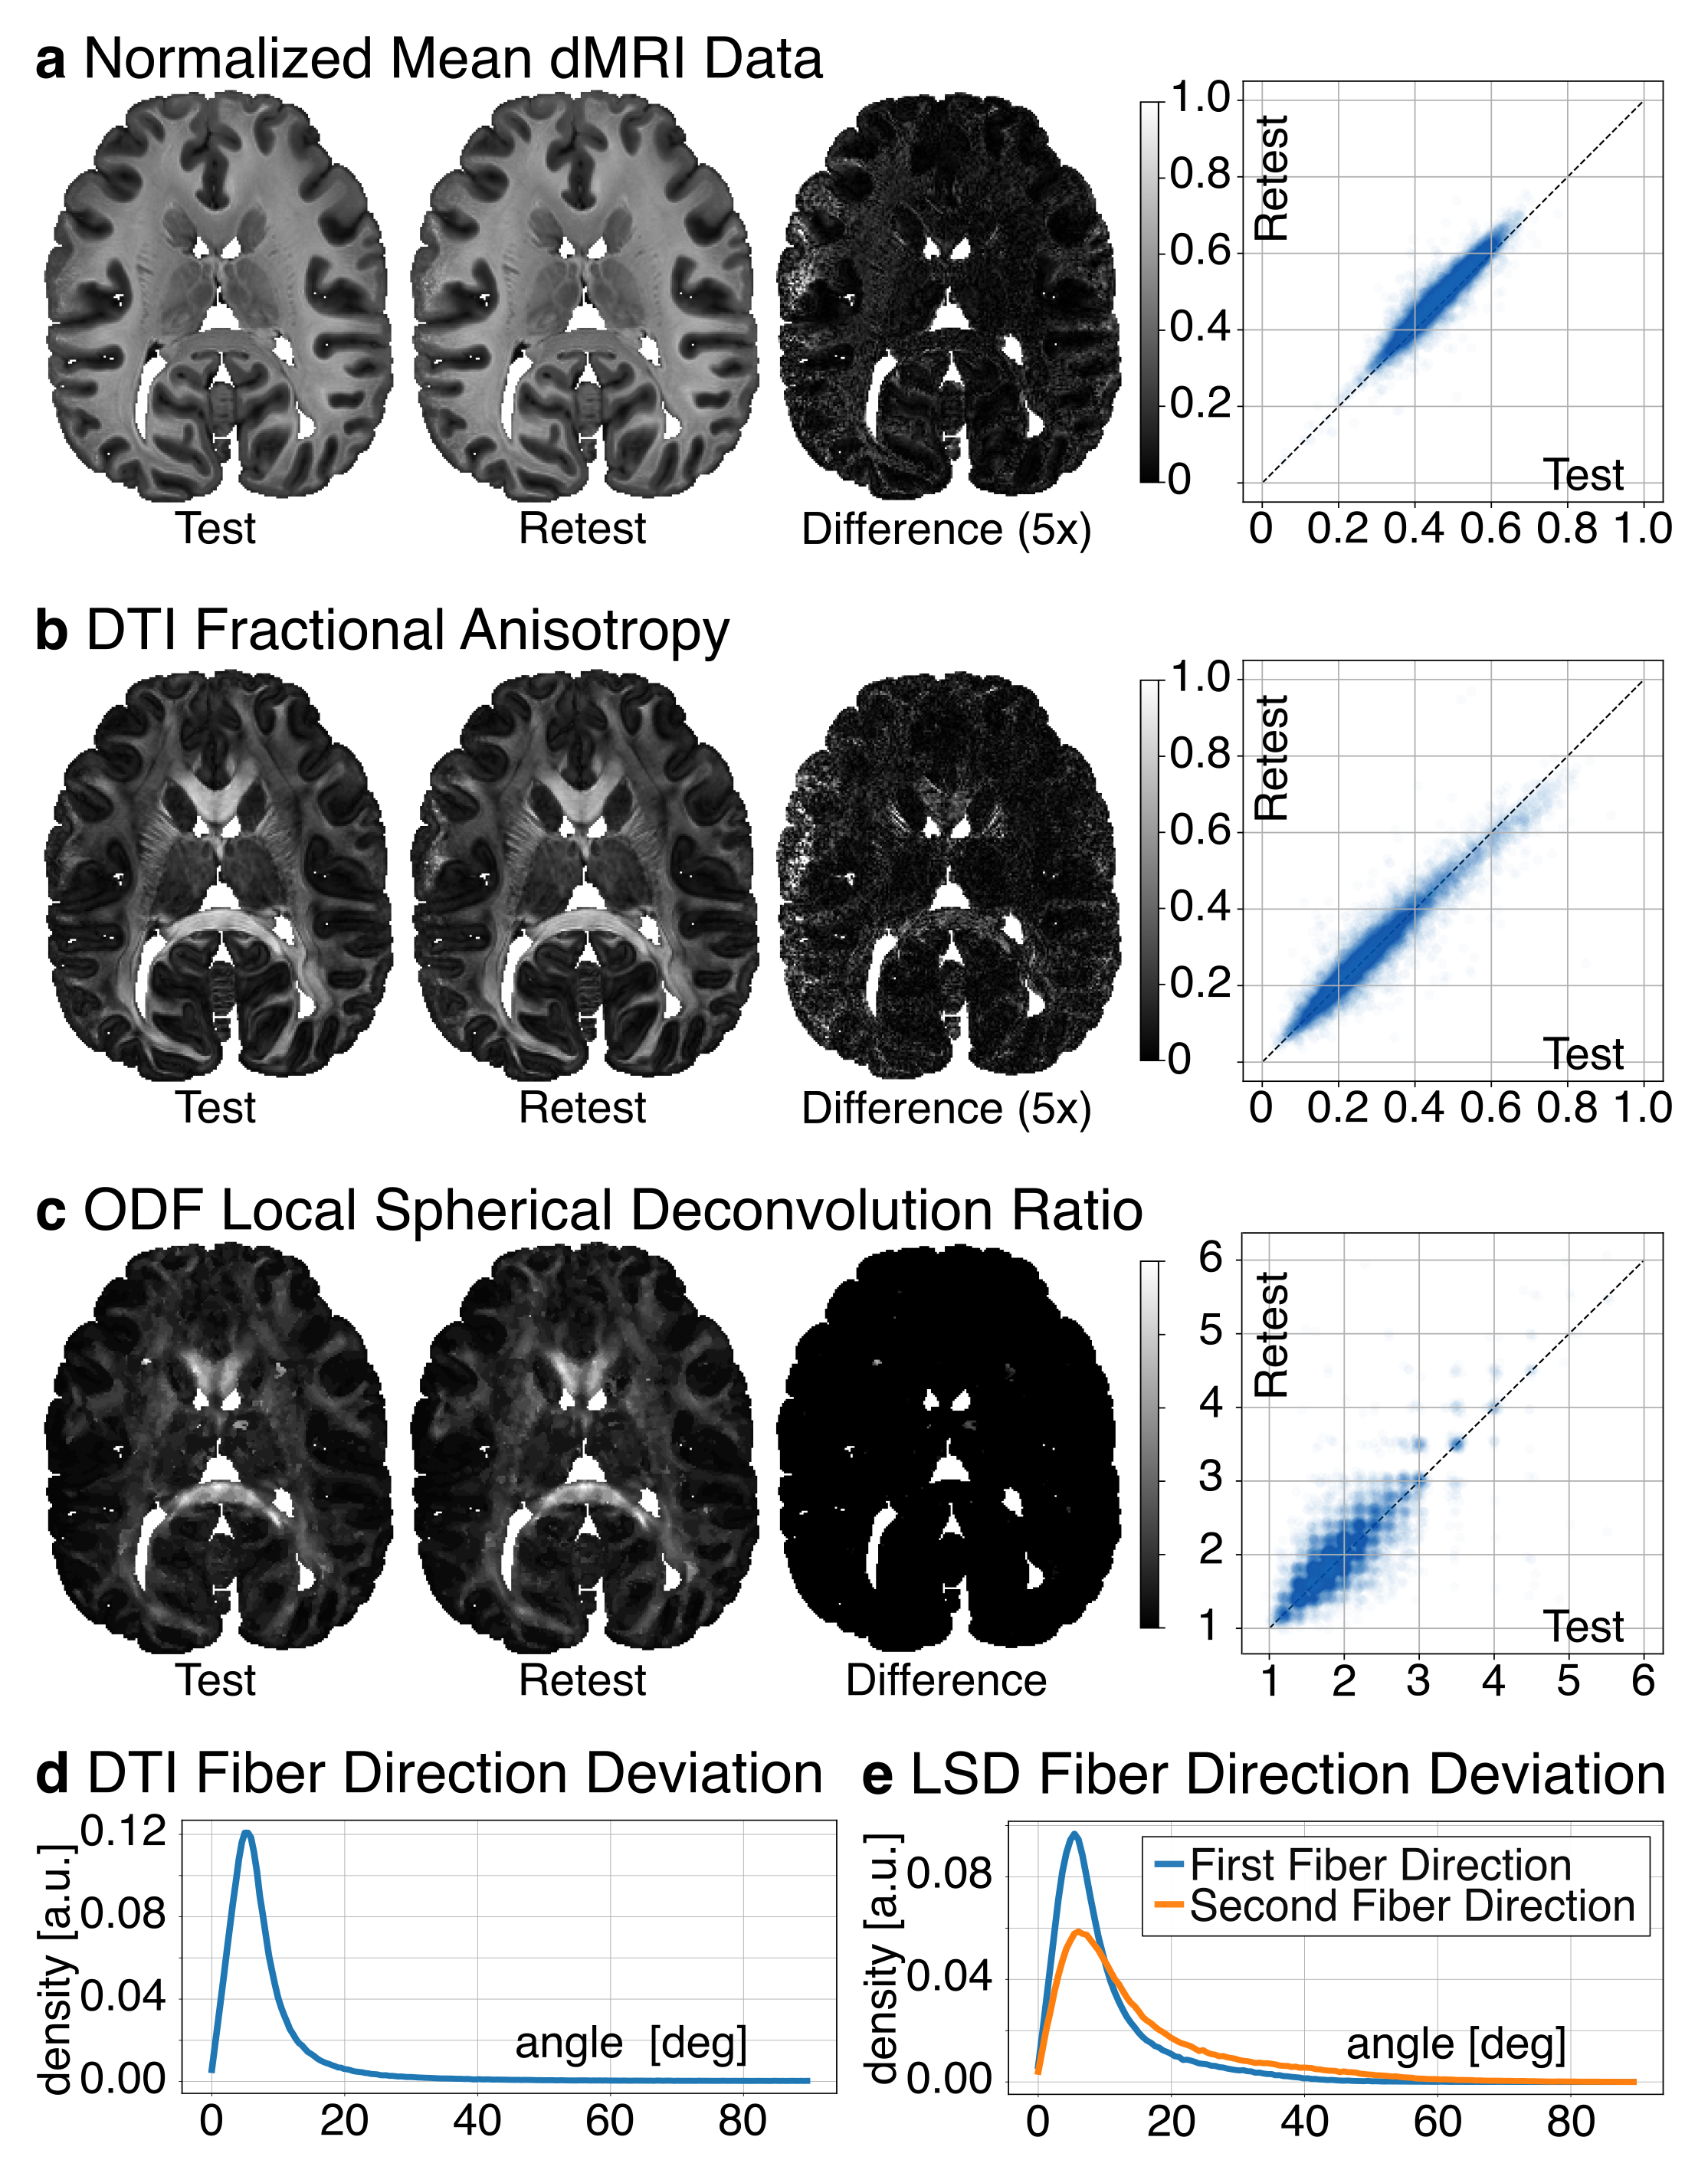
The test-retest evaluation focused on the stability of the signal, diffusion anisotropy, LSD reconstruction, and fiber directions. To evaluate signal and diffusion contrast, a Pearson correlation of the normalized dMRI signal and DTI Fractional Anisotropy (FA) was calculated between test and retest data. To evaluate LSD stability, a Spearman correlation of deconvolution ratio was calculated between test and retest data. For a voxel-wise estimation of fiber direction stability, the angle between the fiber directions from test and retest data was computed for DTI and LSD reconstructions.
Results
Fig 1b compares the LSD deconvolution ratio with the voxels utilized for determining the CSD ratio. As expected, CSD utilized highly anisotropic voxels inside the corpus callosum. The identified LSD ratios were different throughout the brain. Fig 1b also shows the number of fiber orientations (NuFO) from LSD and CSD (relative threshold 0.25). LSD NuFOs are severely smaller throughout the entire brain than for CSD, which reconstructed up to five fiber orientations. Fig 1c compares LSD and CSD reconstructions in various crossing fiber regions of the brain. The LSD reconstructions appeared sharper, more orderly, and resemble the anatomy known from humans. The test-retest evaluation found strong correlations between repetitions (rSignal=0.95, rFA=0.96, 𝜌Ratio=1.0; Fig 2a-c). For DTI, the peak angles between test and retest fiber directions were 5.4° (Fig 2d). For LSD, the peak angles between test and retest fiber directions were 5.4° for primary and 6.0° secondary fiber direction respectively (Fig 2e).Discussion
We present LSD, a method for reconstructing multiple fiber directions in dMRI. Unlike CSD, LSD does not require training regions to determine whole-brain fiber response functions. Instead, LSD utilizes AIC - an established quantitative method for optimal model selection - to identify suitable deconvolution parameters by predicting the measured dMRI data. Test-retest evaluation demonstrated the stability of LSD reconstruction. Reconstructed fiber directions are as consistent as for a DTI model. Further, we demonstrated substantial improvement of fiber reconstruction quality compared to CSD, using high-resolution post-mortem dMRI. These results are intriguing, as CSD routinely yields solid performance under in-vivo conditions. The observed discrepancy might be related to the high resolution or the tissue fixation. Future research will clarify to what extent LSD reconstructions can contribute to improved identifications of fiber directions in in-vivo dMRI.Acknowledgements
This work was funded by the presidential funds of the Max Planck Society to the Inter-Institutional Research Initiative ‘Evolution of Brain Connectivity’.References
1. Behrens TEJ, Berg HJ, Jbabdi S, Rushworth MFS, Woolrich MW. Probabilistic diffusion tractography with multiple fibre orientations: What can we gain? Neuroimage 2007;34:144–155.
2. Wedeen VJ, Rosene DL, Wang R, et al. The Geometric Structure of the Brain Fiber Pathways. Science 2012;335:1628–1634.
3. Tournier J-D, Calamante F, Connelly A. Robust determination of the fibre orientation distribution in diffusion MRI: Non-negativity constrained super-resolved spherical deconvolution. Neuroimage 2007;35:1459–1472.
4. Guo F, Tax CMW, De Luca A, Viergever MA, Heemskerk A, Leemans A. Fiber orientation distribution from diffusion MRI: Effects of inaccurate response function calibration. J. Neuroimaging 2021 doi: 10.1111/jon.12901.
5. Christiaens D, Veraart J, Cordero-Grande L, et al. On the need for bundle-specific microstructure kernels in diffusion MRI. Neuroimage 2020;208:116460.
6. Eichner C, Paquette M , Gallardo G , Bock C , Jaffe JE , Jäger C , Kirilina E , Lipp I , Mildner T , Schlumm T , Wermter FC , Möller HE , Weiskopf N , Crockford C , Wittig R , Friederici AD , Anwander A. High-Resolution Post-Mortem Diffusion MRI Acquisitions for Connectivity Analyses in Chimpanzees. In: Proceedings of the 2021 ISMRM & SMRT Annual Meeting and Exhibition. ; p. 1712.
7. Balchandani P, Qiu D. Semi-adiabatic Shinnar-Le Roux pulses and their application to diffusion tensor imaging of humans at 7T. Magn. Reson. Imaging 2014;32:804–812.
8. Yang QX, Posse S, Le Bihan D, Smith MB. Double-sampled echo-planar imaging at 3 tesla. J. Magn. Reson. B 1996;113:145–150.
9. Andersson JLR, Sotiropoulos SN. An integrated approach to correction for off-resonance effects and subject movement in diffusion MR imaging. Neuroimage 2016;125:1063–1078.
10. St-Jean S, De Luca A, Tax CMW, Viergever MA, Leemans A. Automated characterization of noise distributions in diffusion MRI data. Med. Image Anal. 2020;65:101758.
11. Gudbjartsson H, Patz S. The Rician distribution of noisy MRI data. Magn. Reson. Med. 1995;34:910–914.
12. Veraart J, Novikov DS, Christiaens D, Ades-Aron B, Sijbers J, Fieremans E. Denoising of diffusion MRI using random matrix theory. Neuroimage 2016;142:394–406.
13. Kellner E, Dhital B, Kiselev VG, Reisert M. Gibbs-ringing artifact removal based on local subvoxel-shifts. Magn. Reson. Med. 2016;76:1574–1581.
14. Bautista T, O’Muircheartaigh J, Hajnal J, Tournier JD. Removal of Gibbs ringing artefacts for 3D acquisitions using subvoxel shifts. In: Proceedings of the 2021 ISMRM & SMRT Annual Meeting and Exhibition. ; p. 3535.
15. Vos SB, Tax CMW, Luijten PR, Ourselin S, Leemans A, Froeling M. The importance of correcting for signal drift in diffusion MRI. Magn. Reson. Med. 2017;77:285–299.
16. Eichner C, Fan Q, Huang S, Jones D, Kirilina E, Paquette M, Rudrapatna U, Tax C, Tian Q, Weiskopf A, Anwander A. A Joint Recommendation for Optimized Preprocessing of Connectom Diffusion MRI Data. In: Proceedings of the 27th Annual Meeting of the International Society for Magnetic Resonance in Medicine in Montreal 2019. ; 2019. p. 1047.
17. Aganj I, Lenglet C, Sapiro G, Yacoub E, Ugurbil K, Harel N. Reconstruction of the Orientation Distribution Function in Single and Multiple Shell Q-Ball Imaging within Constant Solid Angle. Magn. Reson. Med. 2010;64:554.
18. Descoteaux M, Deriche R, Knösche TR, Anwander A. Deterministic and probabilistic tractography based on complex fibre orientation distributions. IEEE Trans. Med. Imaging 2009;28:269–286.
19. Tuch DS, Reese TG, Wiegell MR, Makris N, Belliveau JW, Wedeen VJ. High angular resolution diffusion imaging reveals intravoxel white matter fiber heterogeneity. Magn. Reson. Med. 2002;48:577–582.
20. Callaghan PT, Jolley KW, Lelievre J. Diffusion of water in the endosperm tissue of wheat grains as studied by pulsed field gradient nuclear magnetic resonance. Biophys. J. 1979;28:133–141.
21. Akaike H. Information Theory and an Extension of the Maximum Likelihood Principle. In: Parzen E, Tanabe K, Kitagawa G, editors. Selected Papers of Hirotugu Akaike. New York, NY: Springer New York; 1998. pp. 199–213.
Figures