0431
Connectivity matrix from a fODF weighted graph: An alternative to probabilistic tractography1Max Planck Institute for Human Cognitive and Brain Sciences, Leipzig, Germany
Synopsis
We introduce a computationally efficient fODF-weighted graph structure where shortest-paths through white matter compute the probability of connection while naturally limiting the angle of propagation between steps. Connectivity matrices obtained from this structure maintain many properties of probabilistic streamline count connectomes while avoiding the sampling bias of tractography.
Introduction
Probabilistic tractography1 typically generates streamlines by taking steps and reselecting orientations based on the angle-of-arrival and the composition of the local fiber-ODF (fODF). These streamlines sample the paths through white matter between regions of interest (ROIs), e.g. cortex parcellation. However, this sampling process is highly inefficient, leaving most paths unvisited and lowering overall connectivity. An alternative approach entails creating a directed-graph where each voxel is a node connected to its neighbors with weights computed from the fODF and to compute shortest-paths between ROIs2,3,4,5. In this work, we improve this idea by building a static graph structure that limits the propagation depending on the orientation of arrival in each voxel. We apply this approach to build a full brain connectome without bias from streamline sampling.Methods
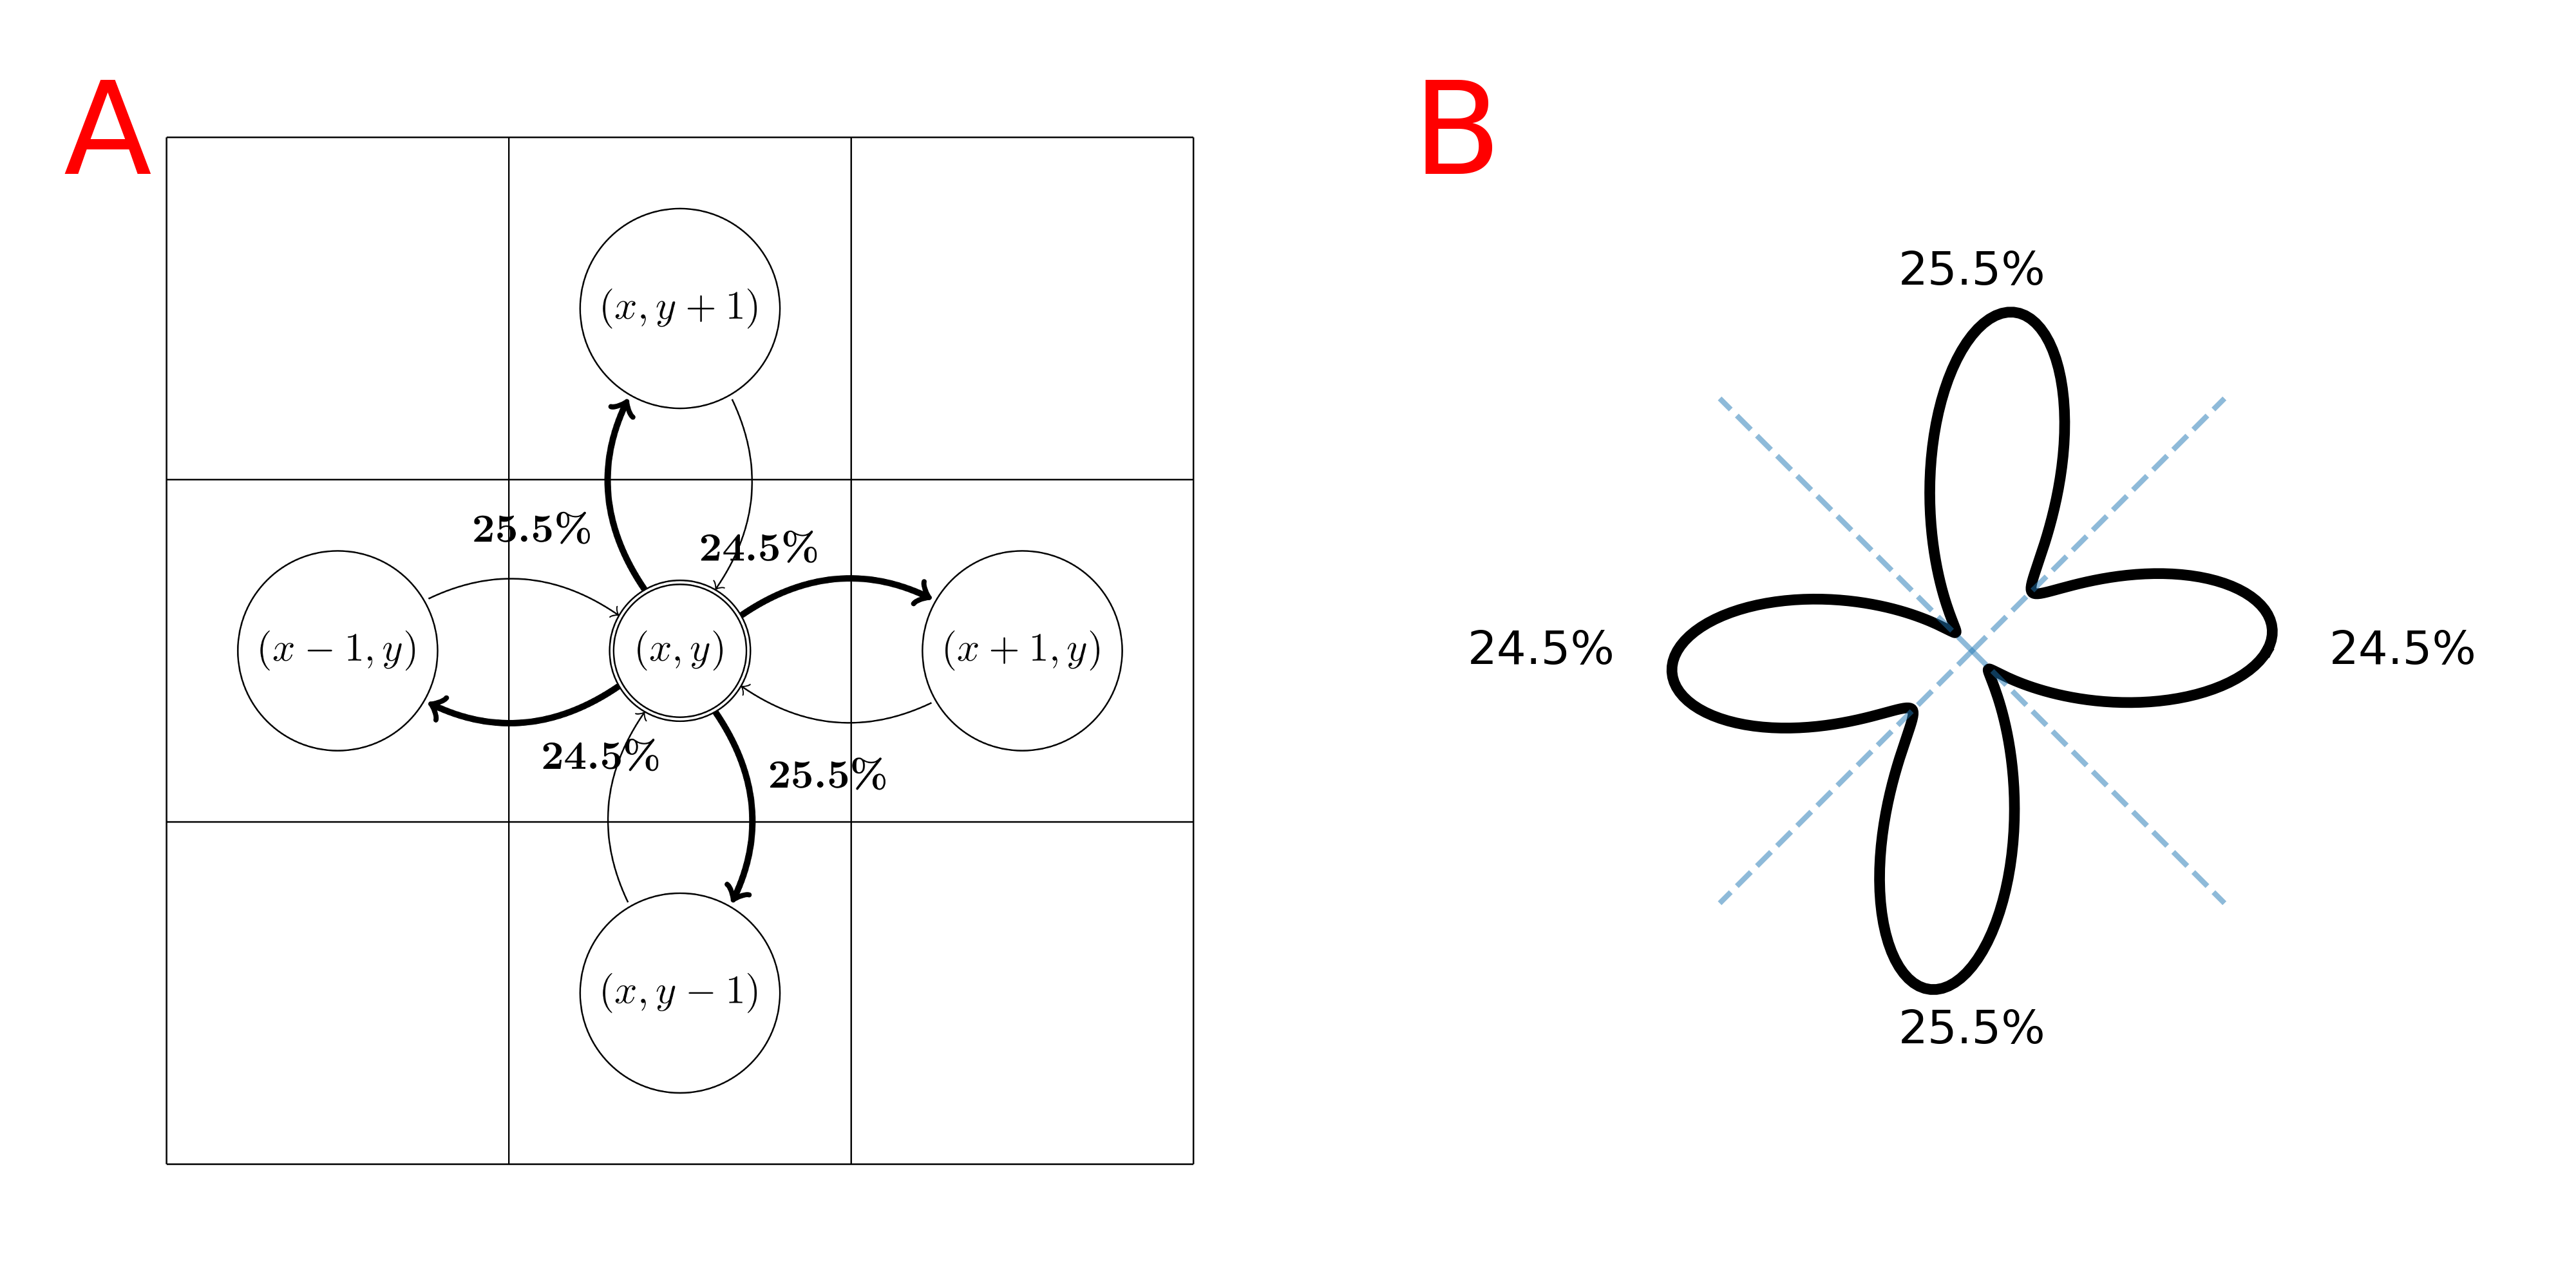
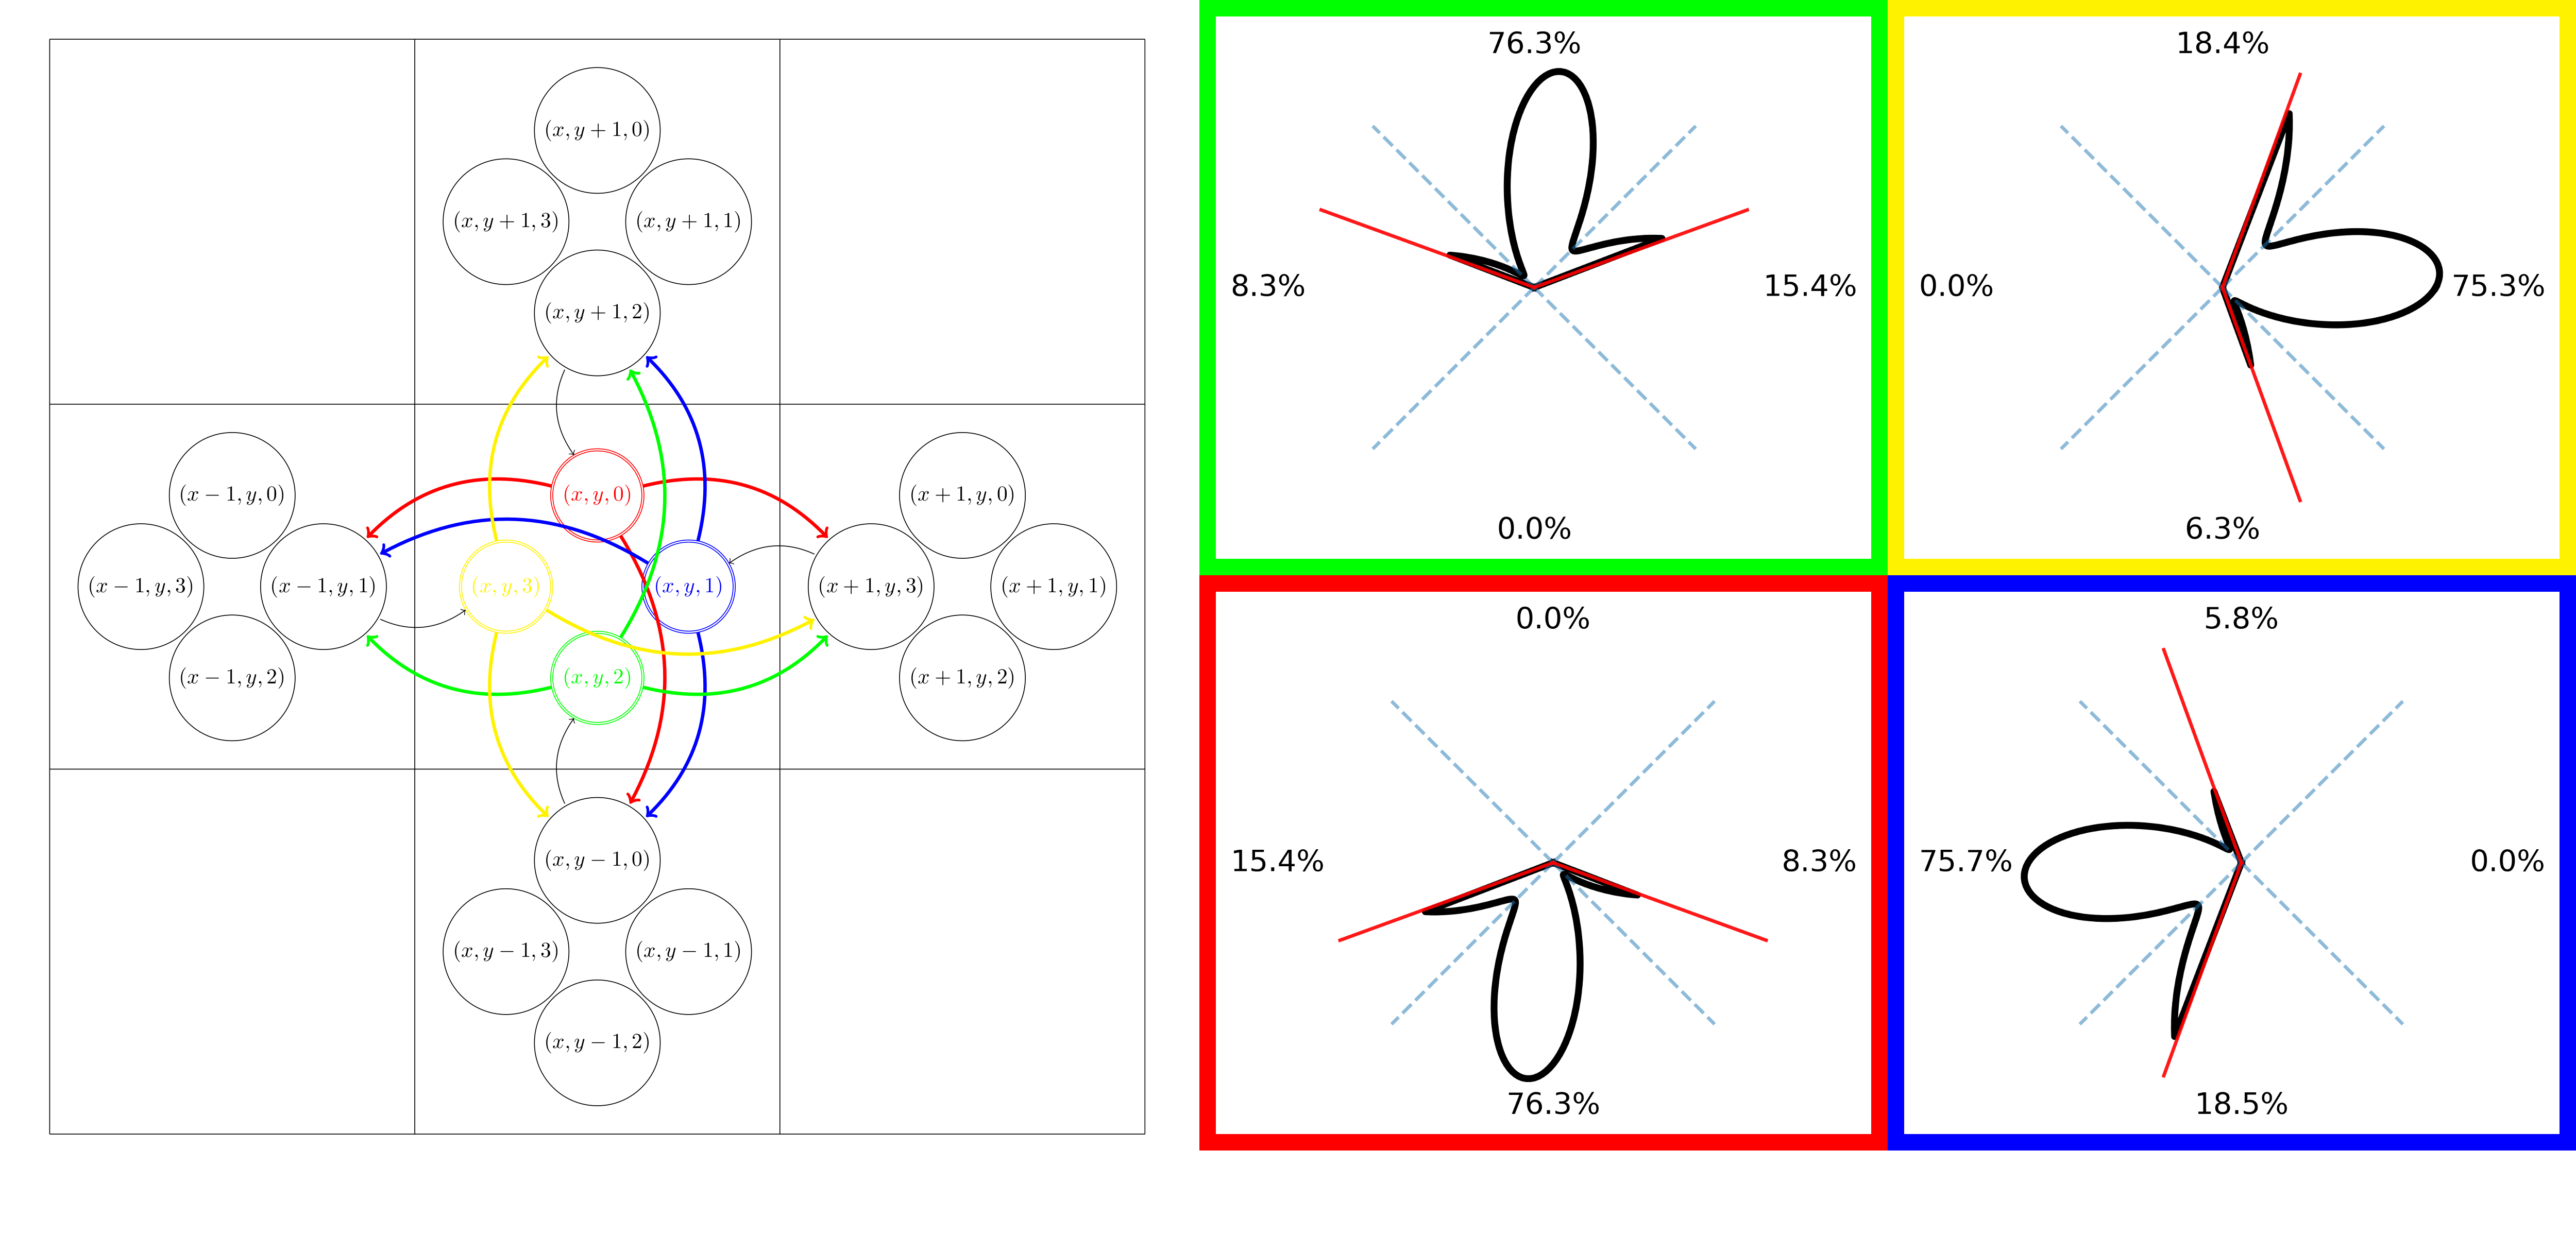
A standard fODF-weighted graph is computed from the probability of connection between each voxel and its 26 neighbors by projecting the fODF onto a set of directions uniformly spanning a sphere. We project vectors from the center of each neighbor on the sphere and assign each direction to the nearest. We apply a threshold on the fODF proportional to its maximum and normalize the remaining weights for each neighbor based on the previous association(fig.1). We build a directed-graph by creating a node for each voxel within the "tracking" mask (e.g. WM mask) and creating an edge to each neighbor with nonzero probability. The edge weight is chosen as $$$-\log{(\mathbb{P})}$$$ such that a path minimizing the sum of the weights maximizes the products of the probability. We add the ROIs as new nodes and connect them to all spatially relevant voxels. We use Dijkstra's algorithm6 to compute the shortest-path between pairs of ROI and build a connectivity matrix. The resulting probabilities represent the probability of a given path starting from a source ROI versus all other possible paths and we can compute the probability for any pair of nodes as long as there is no discontinuity in the graph. A problem with this approach, which limits the comparability with probabilistic tractography, is the lack of consistency in the choice of the orientation with respect to the angle-of-arrival4,5. In tractography, it is common to define a cone around the orientation at each step and only consider the directions inside. To obtain an ideologically similar result while maintaining a static graph structure where Dijkstra's can be used, we introduce a new graph structure with multiple nodes for each voxel; one for each neighbor. As before, we compute the probability of connection between neighbors. However, for each voxel, we clip the probability of all directions outside of a cone centered around $$$\vec{v}_i$$$ with half-angle $$$\theta$$$ where $$$\{\vec{v}_i\}_{i\in[0,25]}$$$ are the vectors projected from each neighbors' center, therefore each voxel has 26 different probability distributions toward its neighbors (fig.2). We create a directed-graph with 26 nodes for each voxel, representing all possible angles-of-arrival from the neighborhood, node $$$(x,y,z,i)$$$ corresponds to voxel $$$(x,y,z)$$$ with vector of arrival $$$\vec{v}_i$$$. All 26 nodes of each voxel have edges to the same 26 neighbors but with different probability distributions(fig.2). Computing the shortest path is performed identically in this oriented-graph but we have guarantees on the maximum "curvature" of the paths and the capacity to mitigate the impact of crossings on the final probabilities. Finally, alongside the path probabilities, we also compute the geometric mean of the steps' probability to obtain a metric insensitive to path length.Results
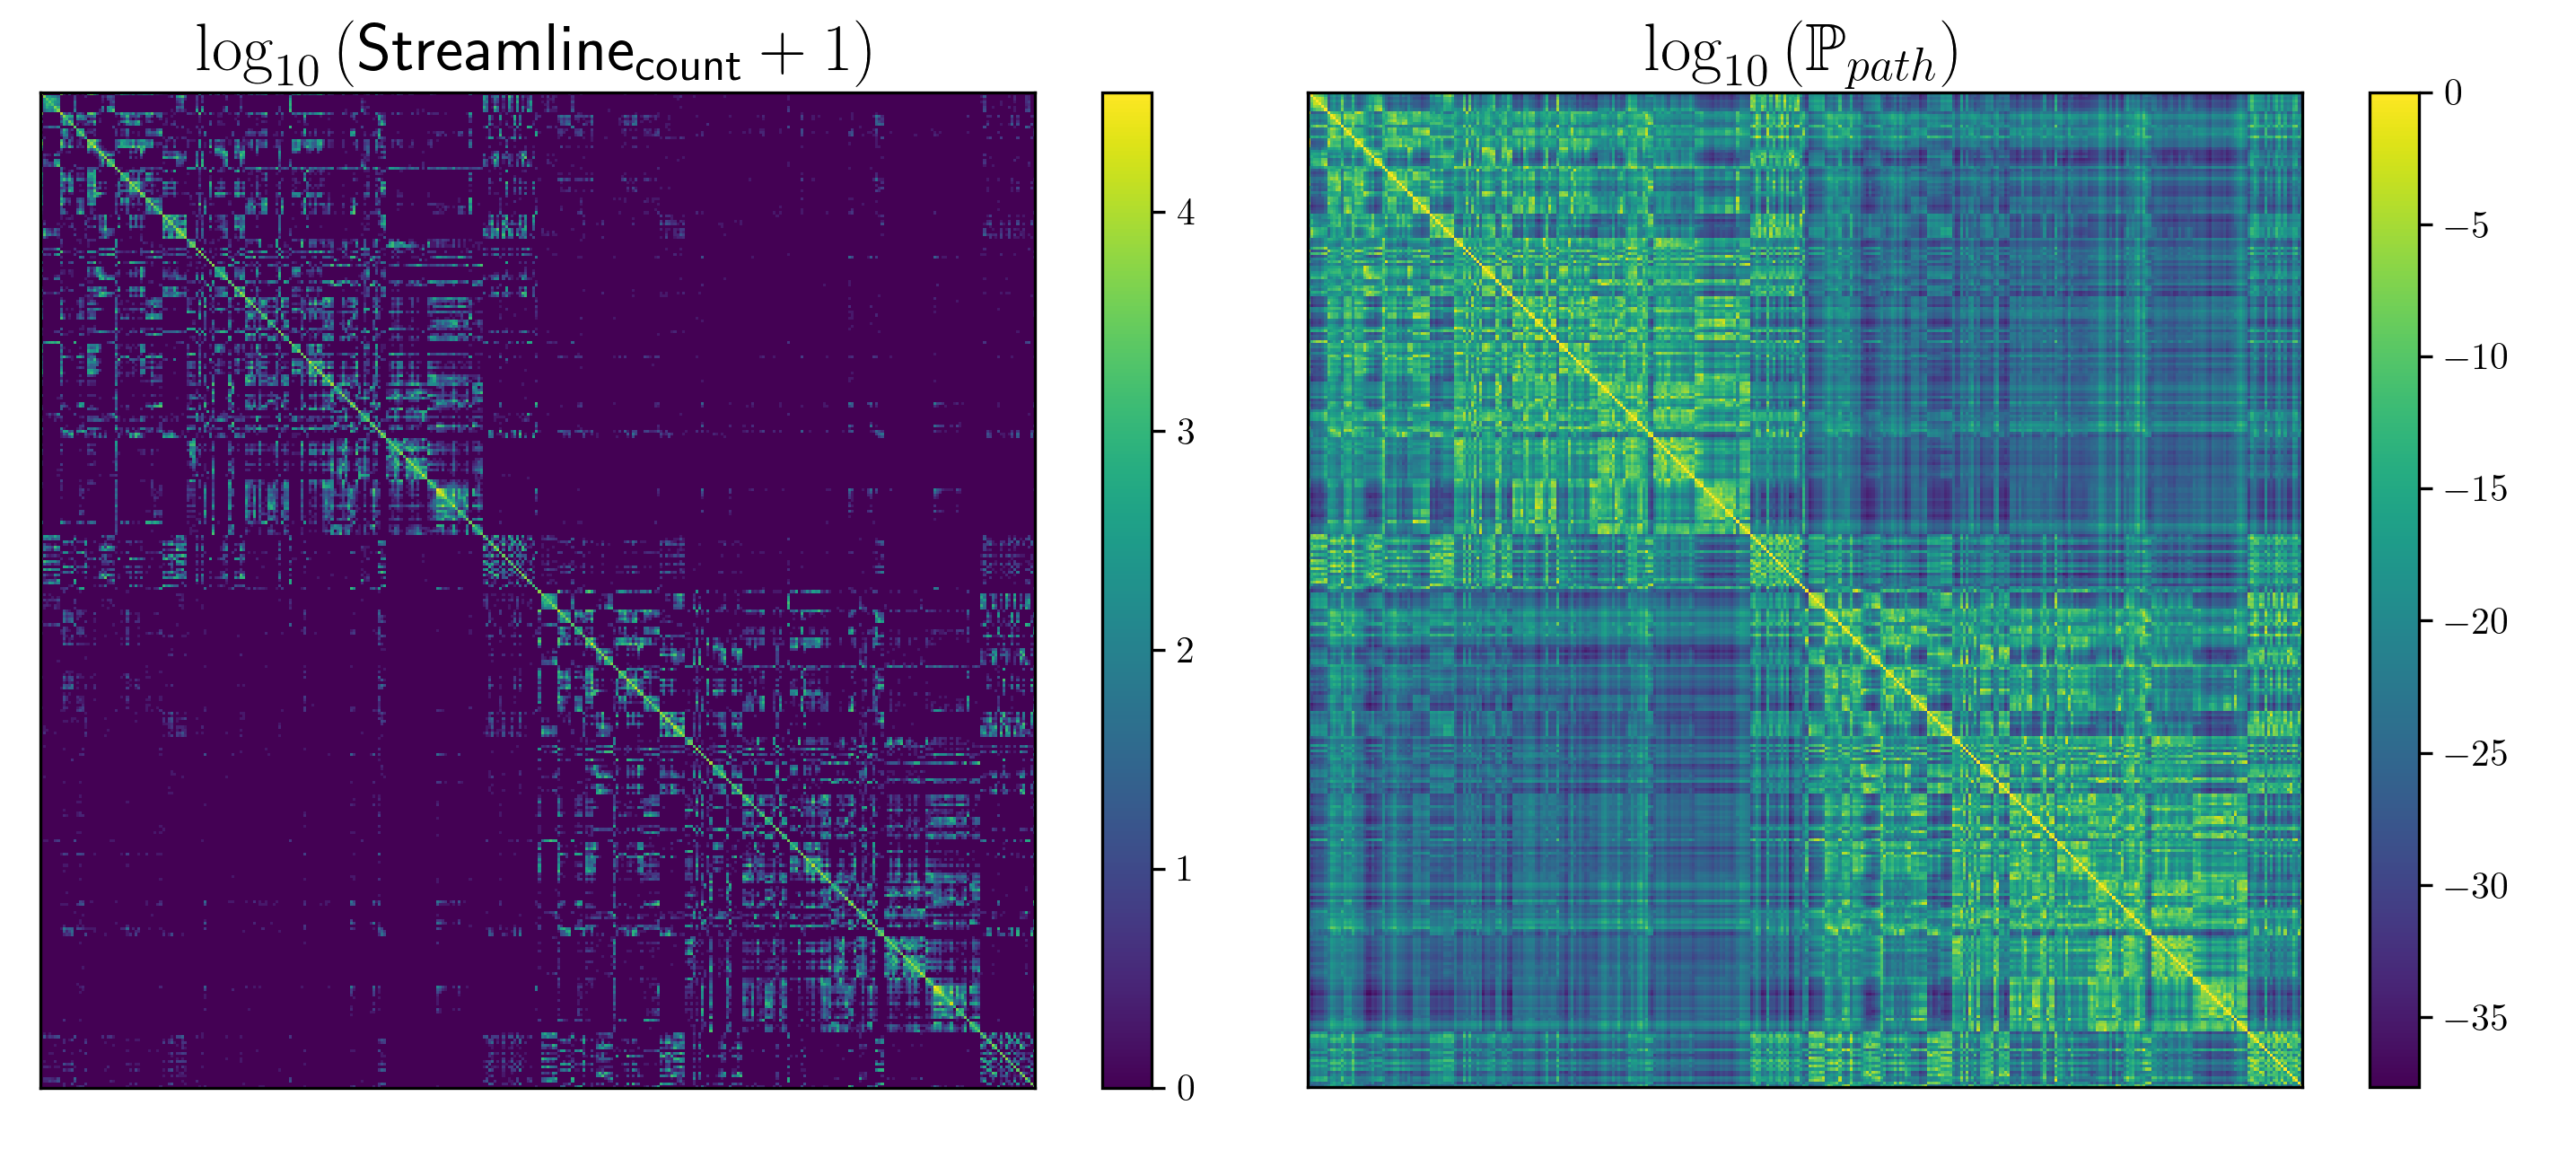
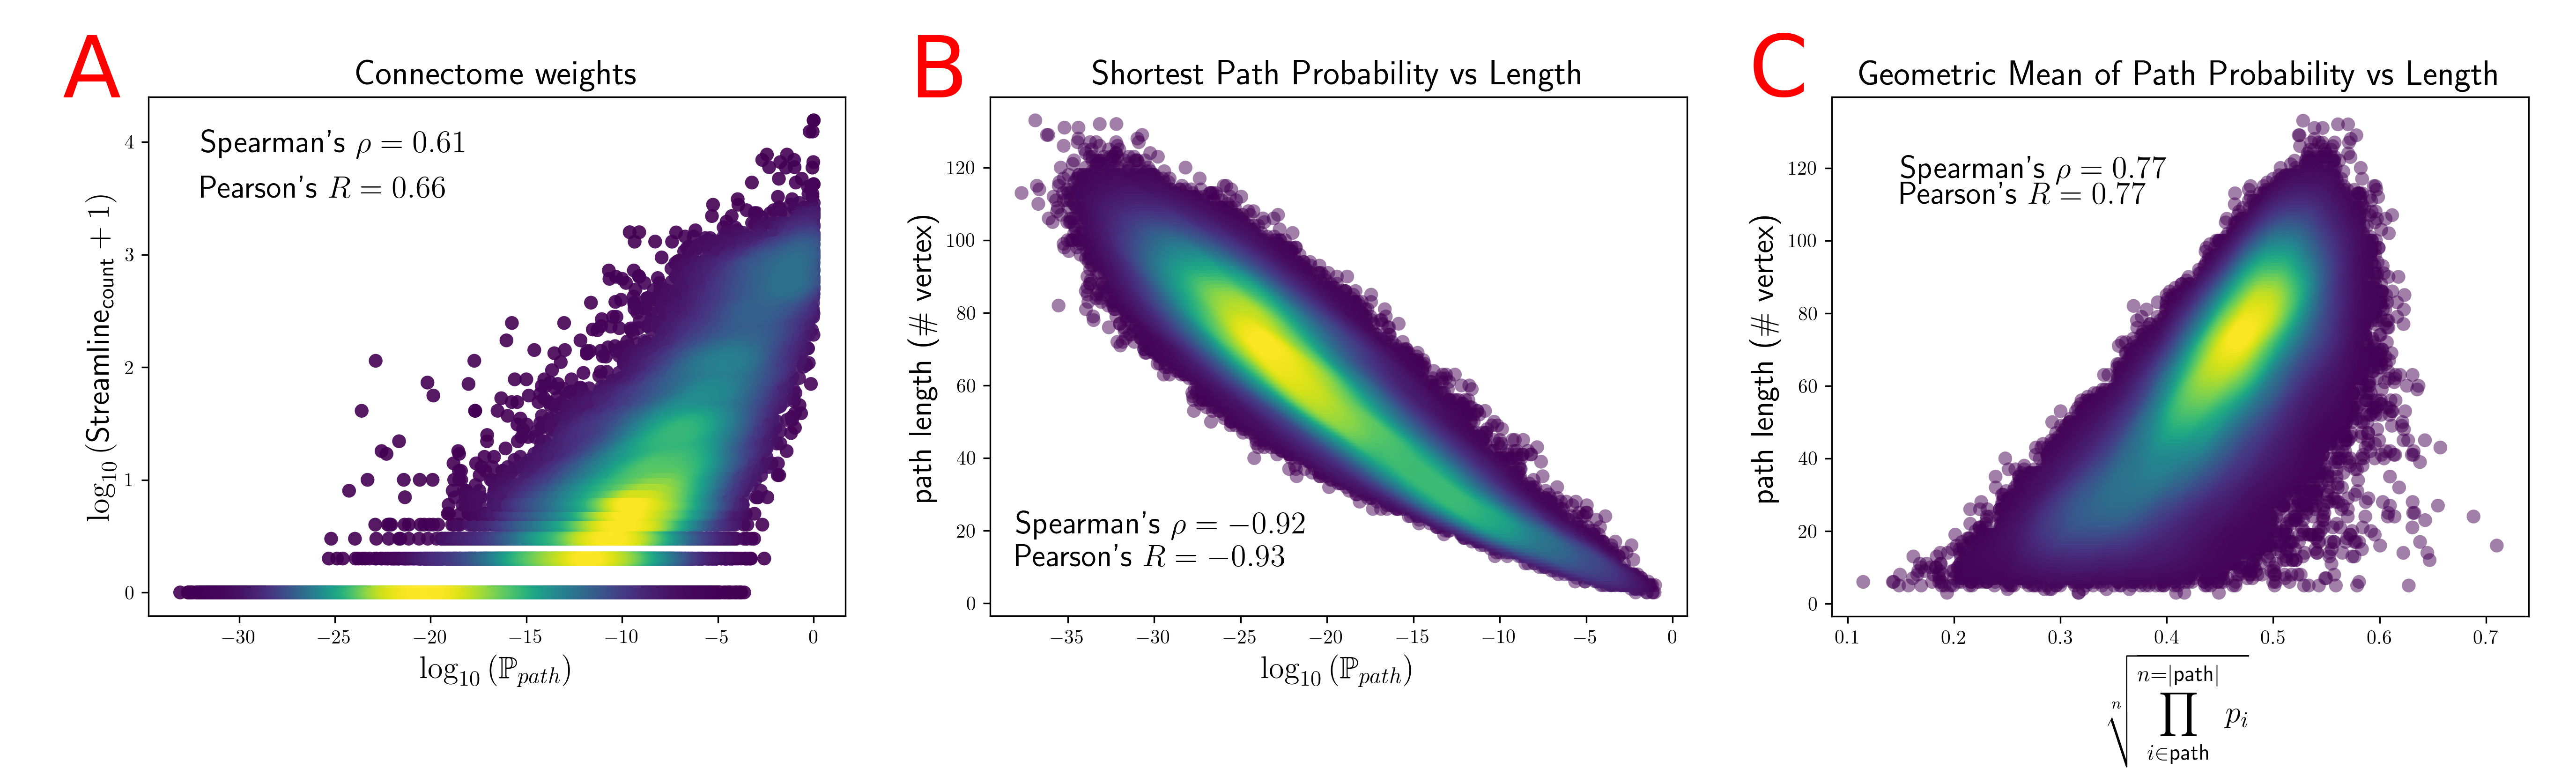
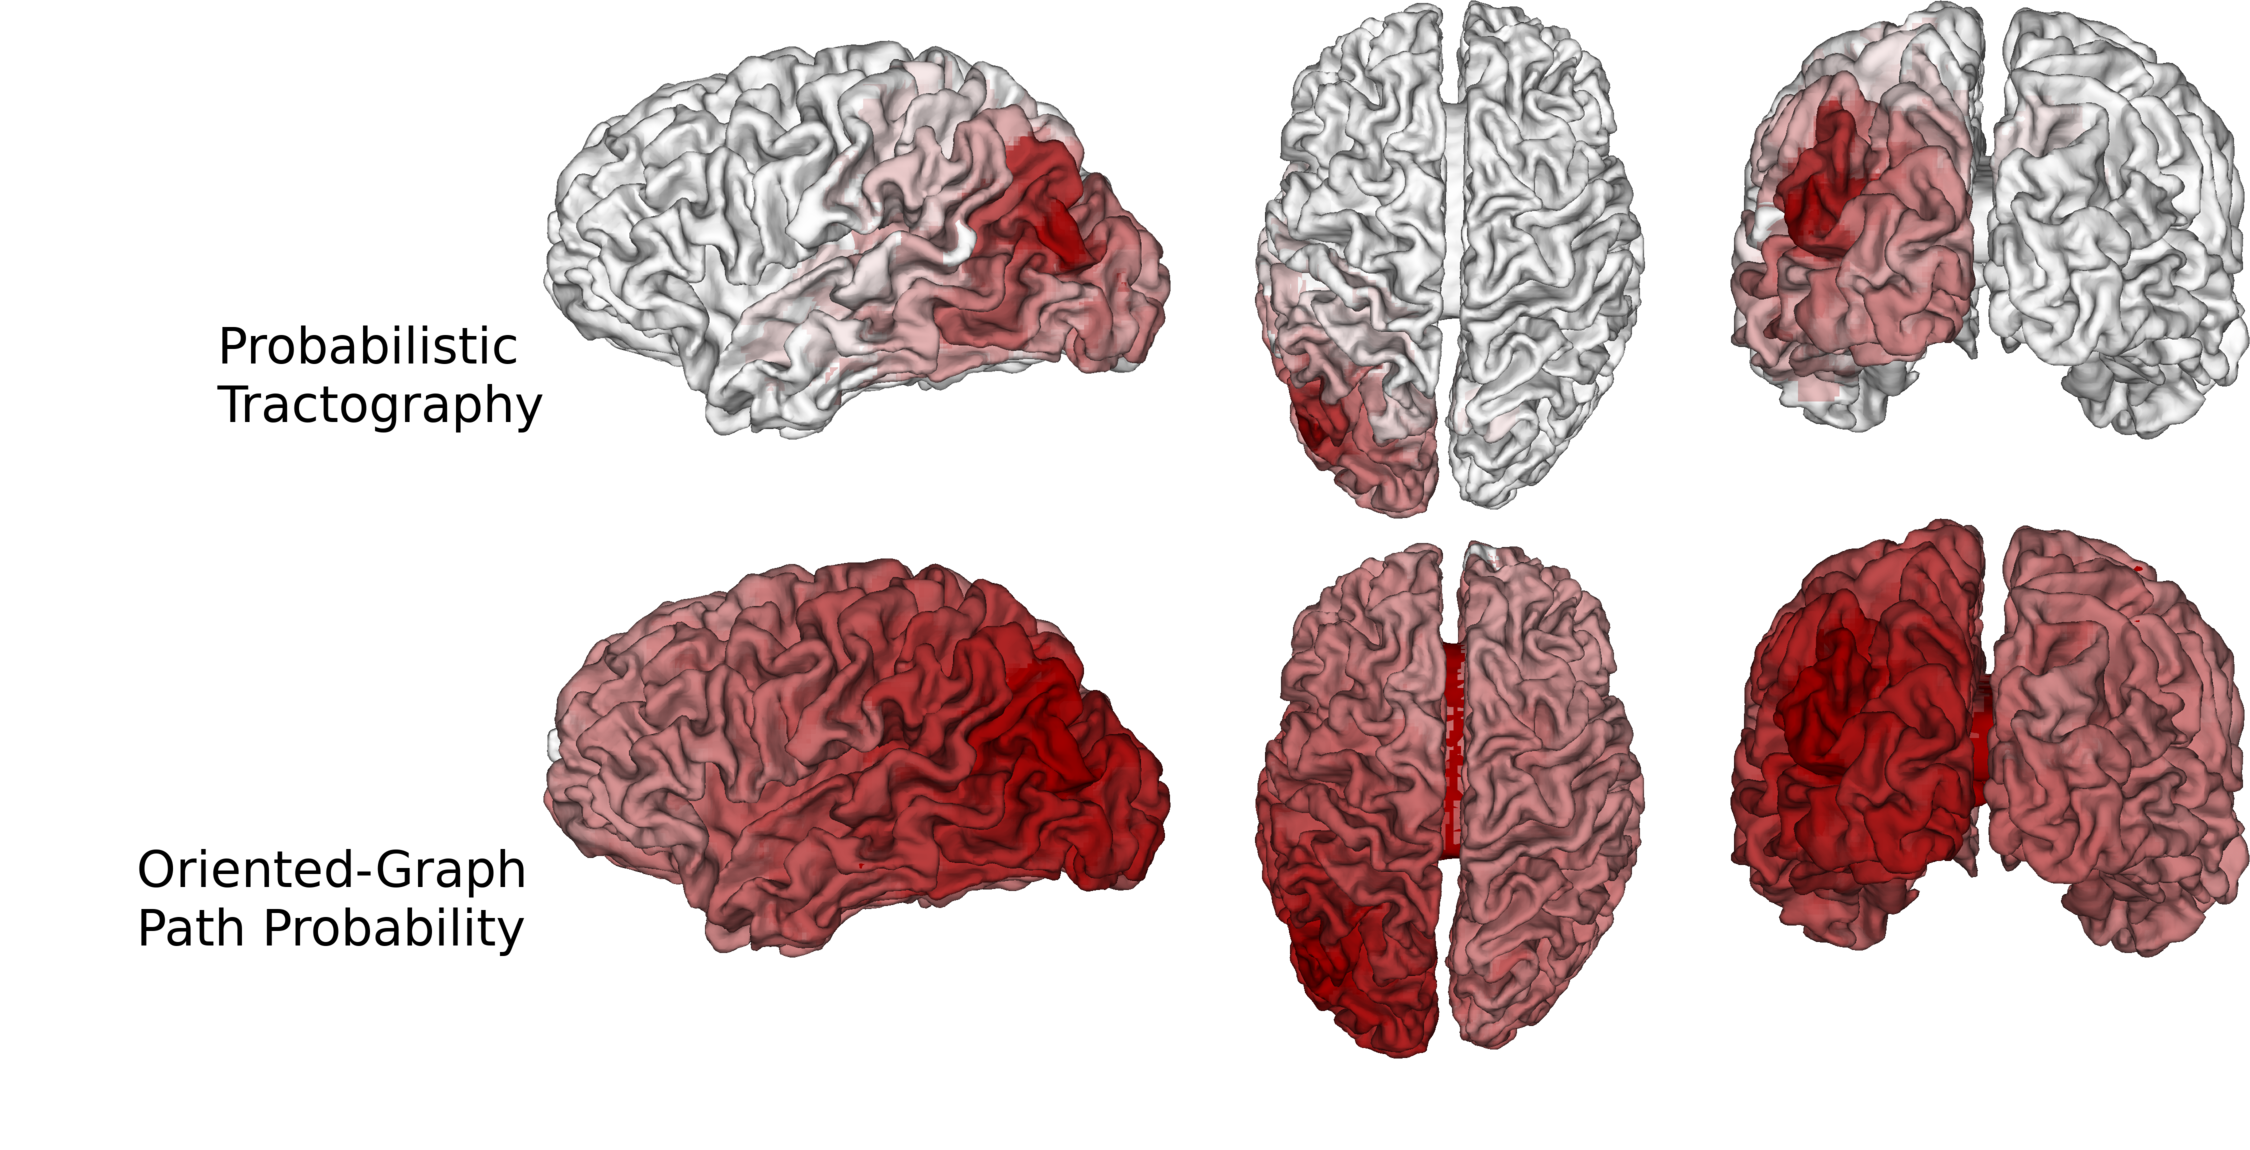
We computed fODFs using MRTRIX7 on a 1.3mm isotropic ($$$b=1000\frac{s}{mm^2}$$$) dMRI dataset. We used a surface-based parcellation of 180 ROIs per hemisphere8, shifted into the WM, as connectivity targets(fig.3). We computed probabilistic tractography with step-size 0.5 voxel, angle-limit $$$45^{\circ}$$$, and interface seeding9. We build the oriented-graph using a 20% fODF threshold, and a cone of $$$\theta=60^{\circ}$$$. The method is implemented10 using the igraph library11. While not computing exactly the same thing, the connectivity weights show a good correlation with the streamline-counts, while also providing a value for all possible connections (fig.4A). Similarly to tractography, the path probabilities are inversely correlated with the length, since it is the product of step probability(fig.4B). However, looking at the geometric means of the probability, which account for the length, reveals a positive correlation(fig.4C). This may be explained if we consider that the majority of steps for longer paths follow very high probability, (i.e. high anisotropy) "main branches" of the WM. For illustration purposes, we projected the connectivity weights from the left PGi to all other parcels for streamline-count and for graph probability(fig.5). The graph weights are dominated by the distance to the seed area similar to the tractography case but extend many more orders of magnitude and cover the entire cortex including areas with very low connectivity.Conclusion
Probabilistic tractography samples the space of fODF "weighted" paths through the WM to approximate the probability of connection. A more systematic approach is to build a graph that has comparable properties to the steps of tractography and compute geodesics through it. We showed a modification to the naive graph that can account for an important property of tractography. The constructed orientated-graph can produce shortest-paths connectome as an alternative to streamline-count which doesn't exhibit undersampling robustness problems.Acknowledgements
This work is supported by the SPP2041 program "Computational Connectomics" of the German Research Foundation (DFG).References
[1] Descoteaux, M., Deriche, R., Knösche, T.R., Anwander, A.: "Deterministic and probabilistic tractography based on complex fibre orientation distributions". IEEE Transactions in Medical Imaging 28 (2) 269–286, (2009).
[2] Parker, G.J.M., Wheeler-Kingshott, C.A.M., Barker, G.J.: "Estimating distributed anatomical connectivity using fast marching methods and diffusion tensor imaging". IEEE Trans. Med. Imaging 21(5), 505–512, (2002).
[3] Jbabdi, S., Bellec, P., Toro, R., Daunizeau, J., Plgrini-Issac, M., Benali, H.: "Accurate anisotropic fast marching for diffusion-based geodesic tractography". Int. J. Biomed. Imaging, (2008).
[4] Iturria-Medina, Y., Canales-Rodríguez, E., Melie-García, L., Valdés-Hernández, P., Martínez-Montes, E., Alemán-Gómez, Y., Sánchez-Bornot, J.: "Characterizing brain anatomical connections using diffusion weighted MRI and graph theory". NeuroImage, (2008).
[5] Battocchio, M. et al.: "Improving Graph-Based Tractography Plausibility Using Microstructure Information". Computational Diffusion MRI. MICCAI 2019, (2019).
[6] Dijkstra, E. W.: "A note on two problems in connexion with graphs". Numerische Mathematik. 1: 269–271, (1959).
[7] Tournier, J.-D., Calamante, F., and Connelly, A.: "Robust determination of the fibre orientation distribution in diffusion MRI: non-negativity constrained super-resolved spherical deconvolution"". Neuroimage, 35, pp. 1459–72, (2007).
[8] Glasser, M. F., Coalson, T. S., Robinson, E. C., Hacker, C. D., Harwell, J., Yacoub, E., et al.: "A multi-modal parcellation of human cerebral cortex". Nature, 1–11, (2016).
[9] Garyfallidis, E., Brett, M., Amirbekian, B., Rokem, A., van der Walt, S., Descoteaux, M., Nimmo-Smith, I. and Dipy Contributors.: "DIPY, a library for the analysis of diffusion MRI data". Frontiers in Neuroinformatics, vol.8, no.8, (2014).
[10] https://github.com/mpaquette/tractoGRAPHy
[11] Csardi, G., Nepusz, T.: “The igraph software package for complex network research.” InterJournal, Complex Systems, 1695, (2006).
Figures