0365
Mesoscale myelin-water fraction and T1/T2/PD mapping through optimized 3D ViSTa-MRF and stochastic reconstruction with preconditioning1Department of Radiology, Stanford University, Stanford, CA, United States, 2Department of Electrical Engineering, Stanford University, Stanford, CA, United States, 3Department of Electrical Engineering and Computer Science, Massachusetts Institute of Technology, Cambridge, MA, United States, 4Center for Brain Imaging Science and Technology, College of Biomedical Engineering & Instrument Science, Zhejiang University, Hangzhou, China, 5Signal and Image Processing Institute, University of Southern California, Los Angeles, CA, United States, 6Centre for Medical Imaging Computing, Department of Computer Science, University College London, London, United Kingdom, 7Techna Institute, University Health Network, Toronto, ON, Canada, 8Department of Imaging Sciences, University of Rochester, Rochester, NY, United States, 9Stanford Center for Cognitive and Neurobiological Imaging, Stanford University, Stanford, CA, United States
Synopsis
In this work, we developed ViSTa-MRF, which combined Visualization of Short Transverse relaxation time component (ViSTa) technique with MR Fingerprinting (MRF), to achieve high-fidelity whole-brain myelin-water fraction (MWF) and T1/T2/PD mapping at sub-millimeter isotropic resolution on a clinical 3T scanner. To achieve fast acquisition and memory-efficient reconstruction, the ViSTa-MRF sequence leverages an optimized 3D tiny-golden-angle-shuffling (TGAS) spiral-projection acquisition and stochastic subspace reconstruction with optimized k-space diagonal preconditioning. With the proposed ViSTa-MRF method, high-fidelity direct MWF mapping was achieved without a need for multi-compartment fitting.
Introduction
Myelin-Water Fraction (MWF)-mapping has shown great potential in characterizing brain’s myelination processes(1). Conventional MWF-mapping utilizes a multi-echo spin-echo sequence with multi-compartment fitting to extract the shorter relaxation time of myelin-water(2). However, such fitting is ill-conditioned and prone to noise. To improve MWF-mapping, the ViSTa technique(3,4) that employed a specifically configured double-inversion-recovery was proposed to suppress the long T1-component for direct visualization of short-T1 myelin-water components. Our previous work(5) incorporated ViSTa into 3D-MR fingerprinting (ViSTa-MRF) with subspace reconstruction, to improve the SNR of the ViSTa and accelerate MWF-mapping, which enables whole-brain 1mm3 MWF and T1/T2/PD maps in ~10 minutes.Building on the previous work, we push the ViSTa-MRF to the mesoscale and develop approaches to improve the fidelity of ViSTa-MRF method: (i) A modified spiral-projection spatiotemporal-encoding scheme termed tiny-golden-angle-shuffling(TGAS)(6) was implemented to maximize the sampling-incoherency for higher accelerations. (ii) To mitigate fat artifact, a non-selective water-excitation hard pulse(7) was employed for data acquisition. (iii) To achieve robustness to B1+ inhomogeneity, B1+ variations were simulated into the dictionary and incorporated into the subspace reconstruction, and (iv) Stochastic primal-dual hybrid-gradient algorithm(8) with optimized k-space diagonal-preconditioning was implemented for memory-efficient subspace reconstruction of very large mesoscale whole-brain MRF data. We demonstrated that the proposed method could achieve high-fidelity whole-brain 0.88- and 0.66-mm isotropic resolution in 9.6 and 22.8 minutes on a 3T clinical scanner.
Methods
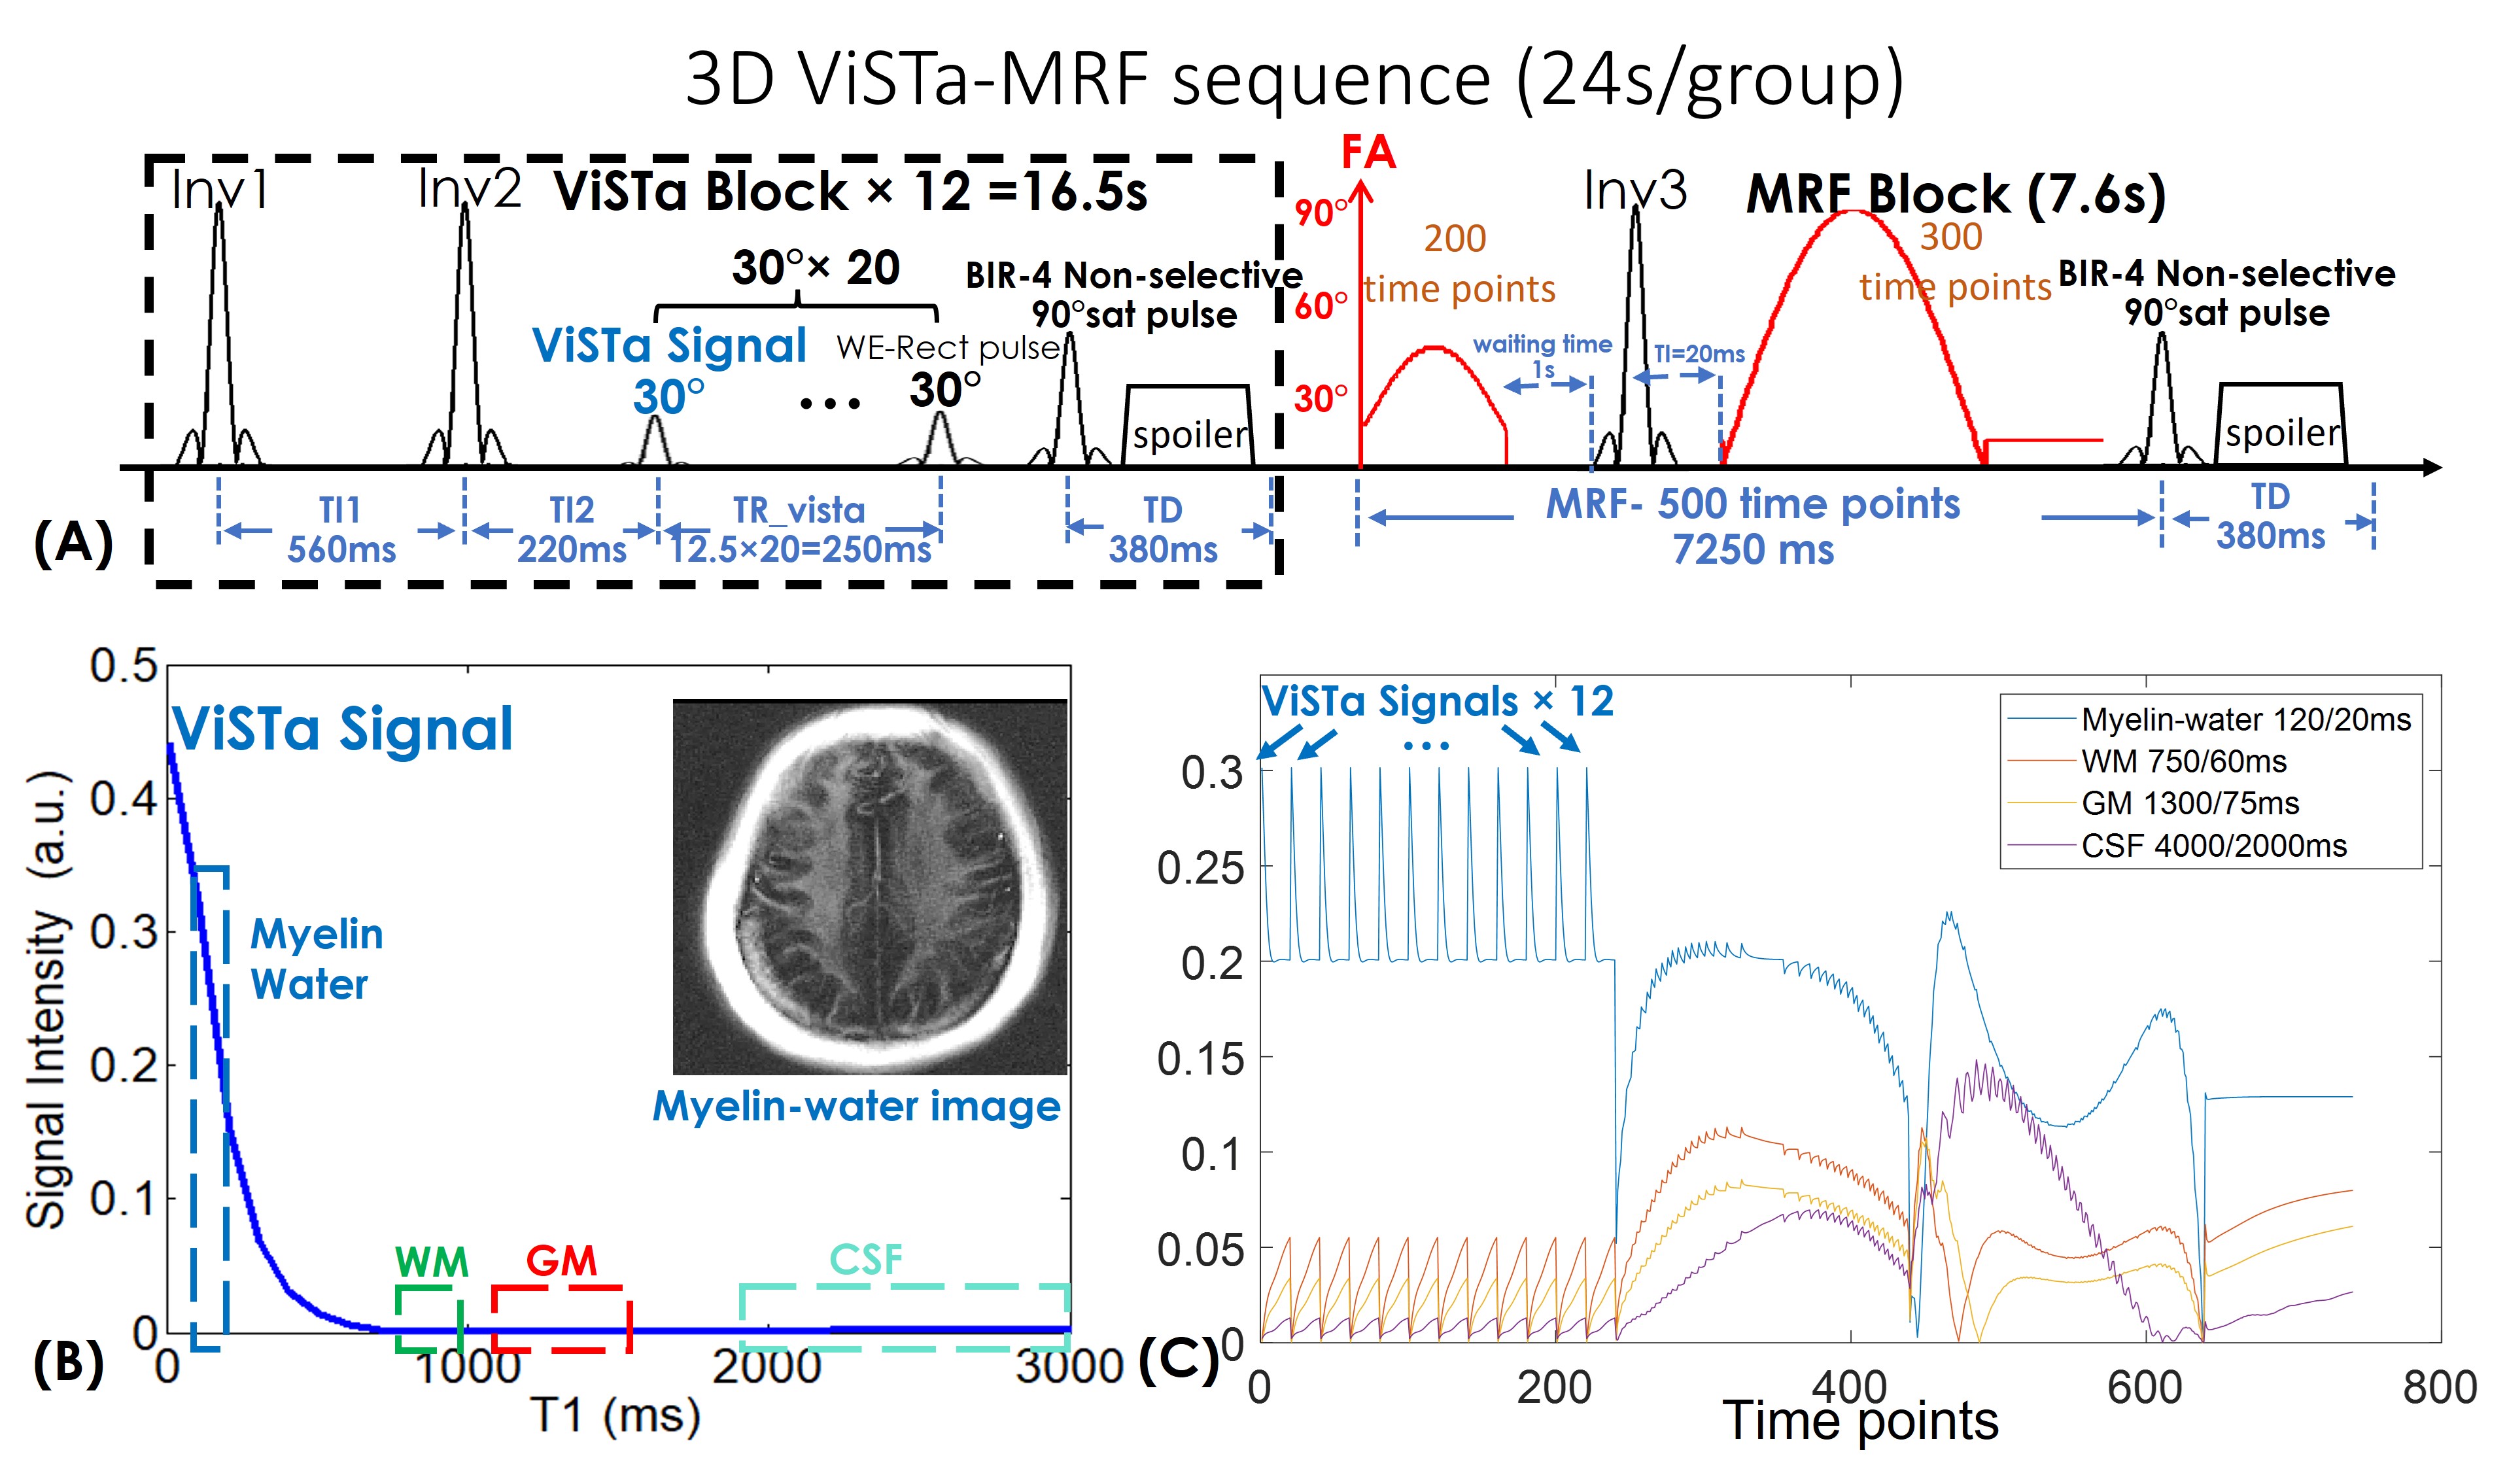
Pulse sequence: Figure1(A) shows the diagram of the ViSTa-MRF sequence, where each acquisition-group consists of multiple ViSTa-blocks and one MRF-block. A water-exciting rectangular(WE-Rect) hard pulse(7) is employed for data acquisition, where the RF duration is set to 2.3ms so that the first zero-crossing of its sinc-shaped frequency response is at the main fat-frequency. In each ViSTa-block, a double-inversion-recovery is performed, with the first subsequent signal time-point labeled the “ViSTa signal”. Through extended-phase-graph(EPG) simulation(9), Fig.1(B) shows that the myelin-water signal is preserved in the ViSTa signal, while the white-matter(WM), gray-matter(GM) and CSF are suppressed, which enables direct myelin-water imaging. Figure1(C) shows the ViSTa-MRF signal-curves with good signal-separability between different tissue-types. To increase the emphasis on the encoding of the short-T1 signal, the sequence repeats the ViSTa-block multiple-times with different spatial-encodings(Fig1.(C)). After the ViSTa-blocks, 500-time-point FISP-MRF data are acquired. Between the acquisition blocks, a BIR-4 90°-saturation-pulse with a waiting time of 380ms is used to achieve steady-state longitudinal-magnetization.Acquisitions: 3D-spiral-projection imaging(SPI) with TGAS was used for ViSTa-MRF acquisition at 0.88- and 0.66-mm whole-brain on a 3T GE Premier scanner with a 48-channel head-neck coil: FOV:220×220×220mm3, TR/TE=12/1.8ms with a 7.0ms spiral-readout. Twenty-four acquisition-groups with 12 ViSTa-blocks and 72 acquisition-groups with 8 ViSTa-blocks were acquired for 0.88-mm and 0.66-mm cases, respectively, where the spiral-interleaves were designed to rotate around three axes by TGAS(Fig.2(A)). This resulted in scan times of 24s×24=9.6minutes for 0.88mm-iso and 19s×72=22.8minutes for 0.66mm-iso datasets.
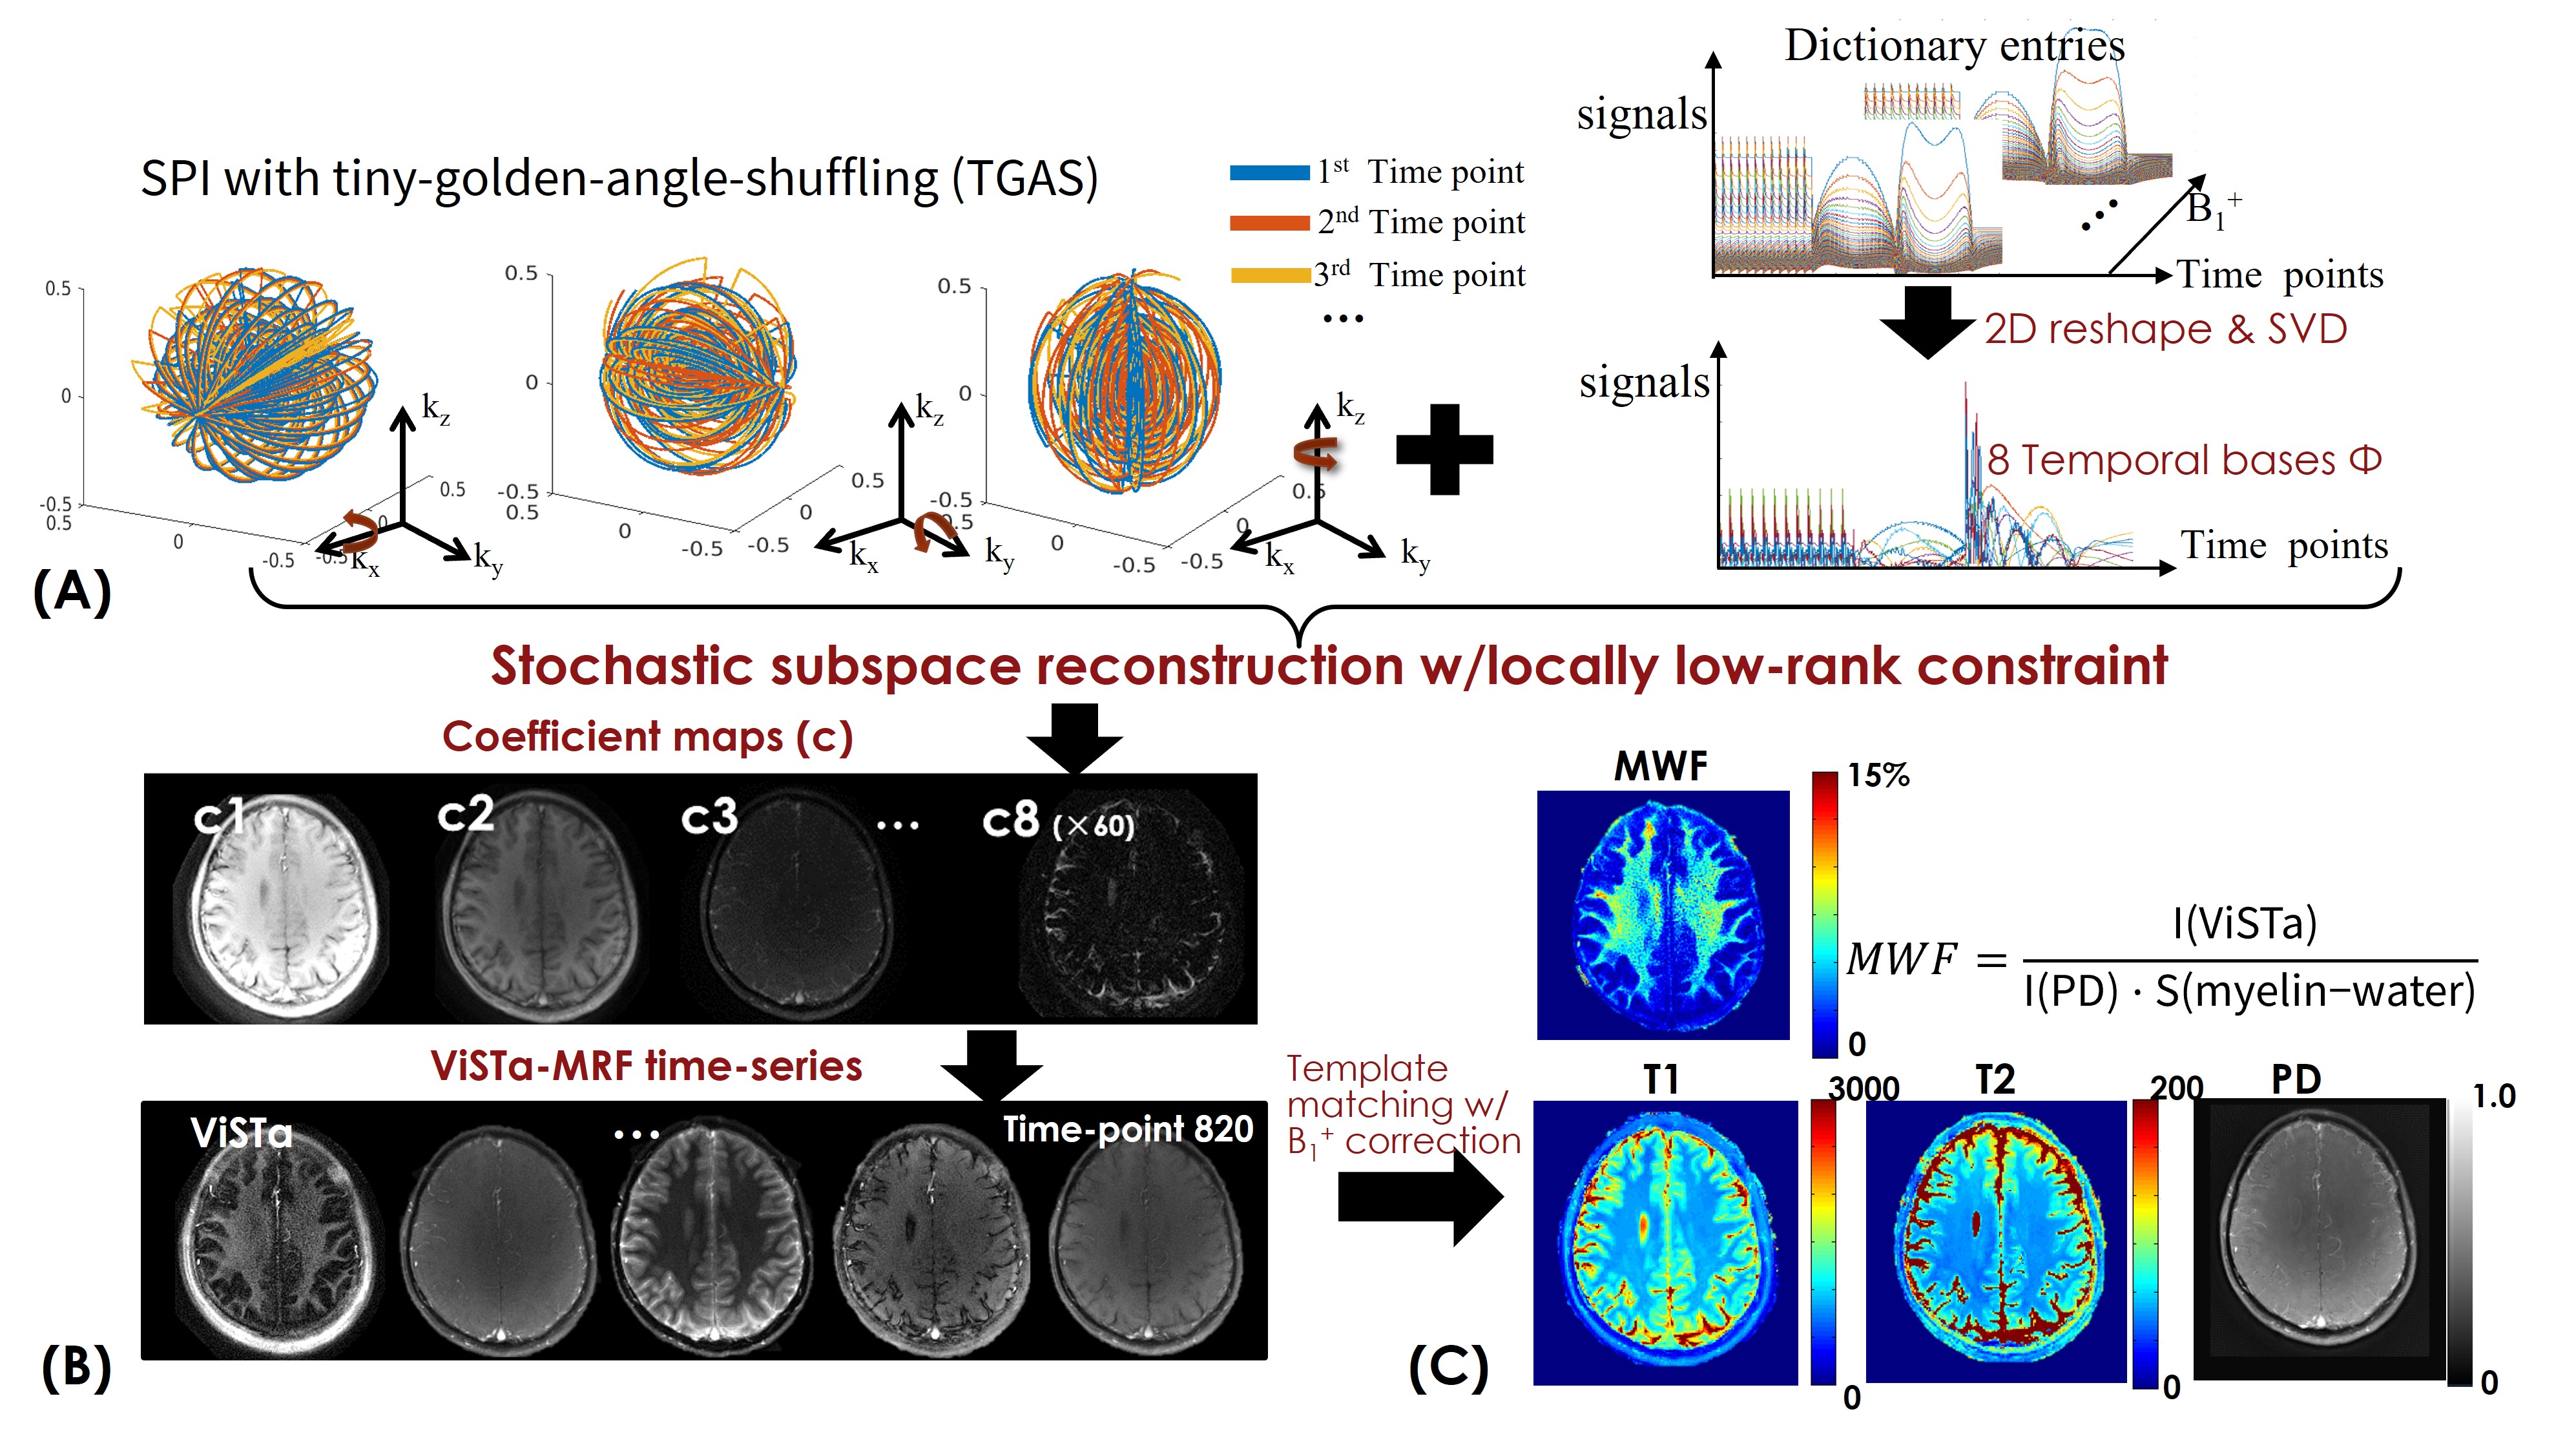
Reconstruction: The ViSTa-MRF dictionary with B1+-variations was generated using EPG, and the first eight principal components were selected as the temporal bases Φ (Fig2(A)). The ViSTa-MRF time-series x is expressed as $$$x=Φc$$$, where c are the temporal coefficient-maps. Figure2(B) shows the flowchart of the subspace reconstruction with locally-low-rank constraint, which could be described as:
$$ min_{c}\bf\parallel MFS\phi c\parallel + \lambda_{1}\bf\parallel c\parallel_{*} [1] $$
where S contains coil sensitivities, F is the NUFFT operator and M is the undersampling-pattern. We implemented a novel algorithm in SigPy(10) that combined stochastic primal-dual hybrid-gradient(8) with optimized k-space diagonal-preconditioning(11) to solve Eq.[1], where at each iteration, a random coil/TR/group was chosen for memory-efficient processing. With such reconstruction, the subproblem per coil and group can be resolved on a GPU with 32GB-VRAM while previously the problem did not fit >1TB of RAM.
The reconstructed c is then used to generate the time-series with voxel-by-voxel B1+-correction for estimating T1/T2/PD maps(Fig.2(C)), while the quantitative MWF-map is derived from the reconstructed first time-point ViSTa image and the PD map.
Results
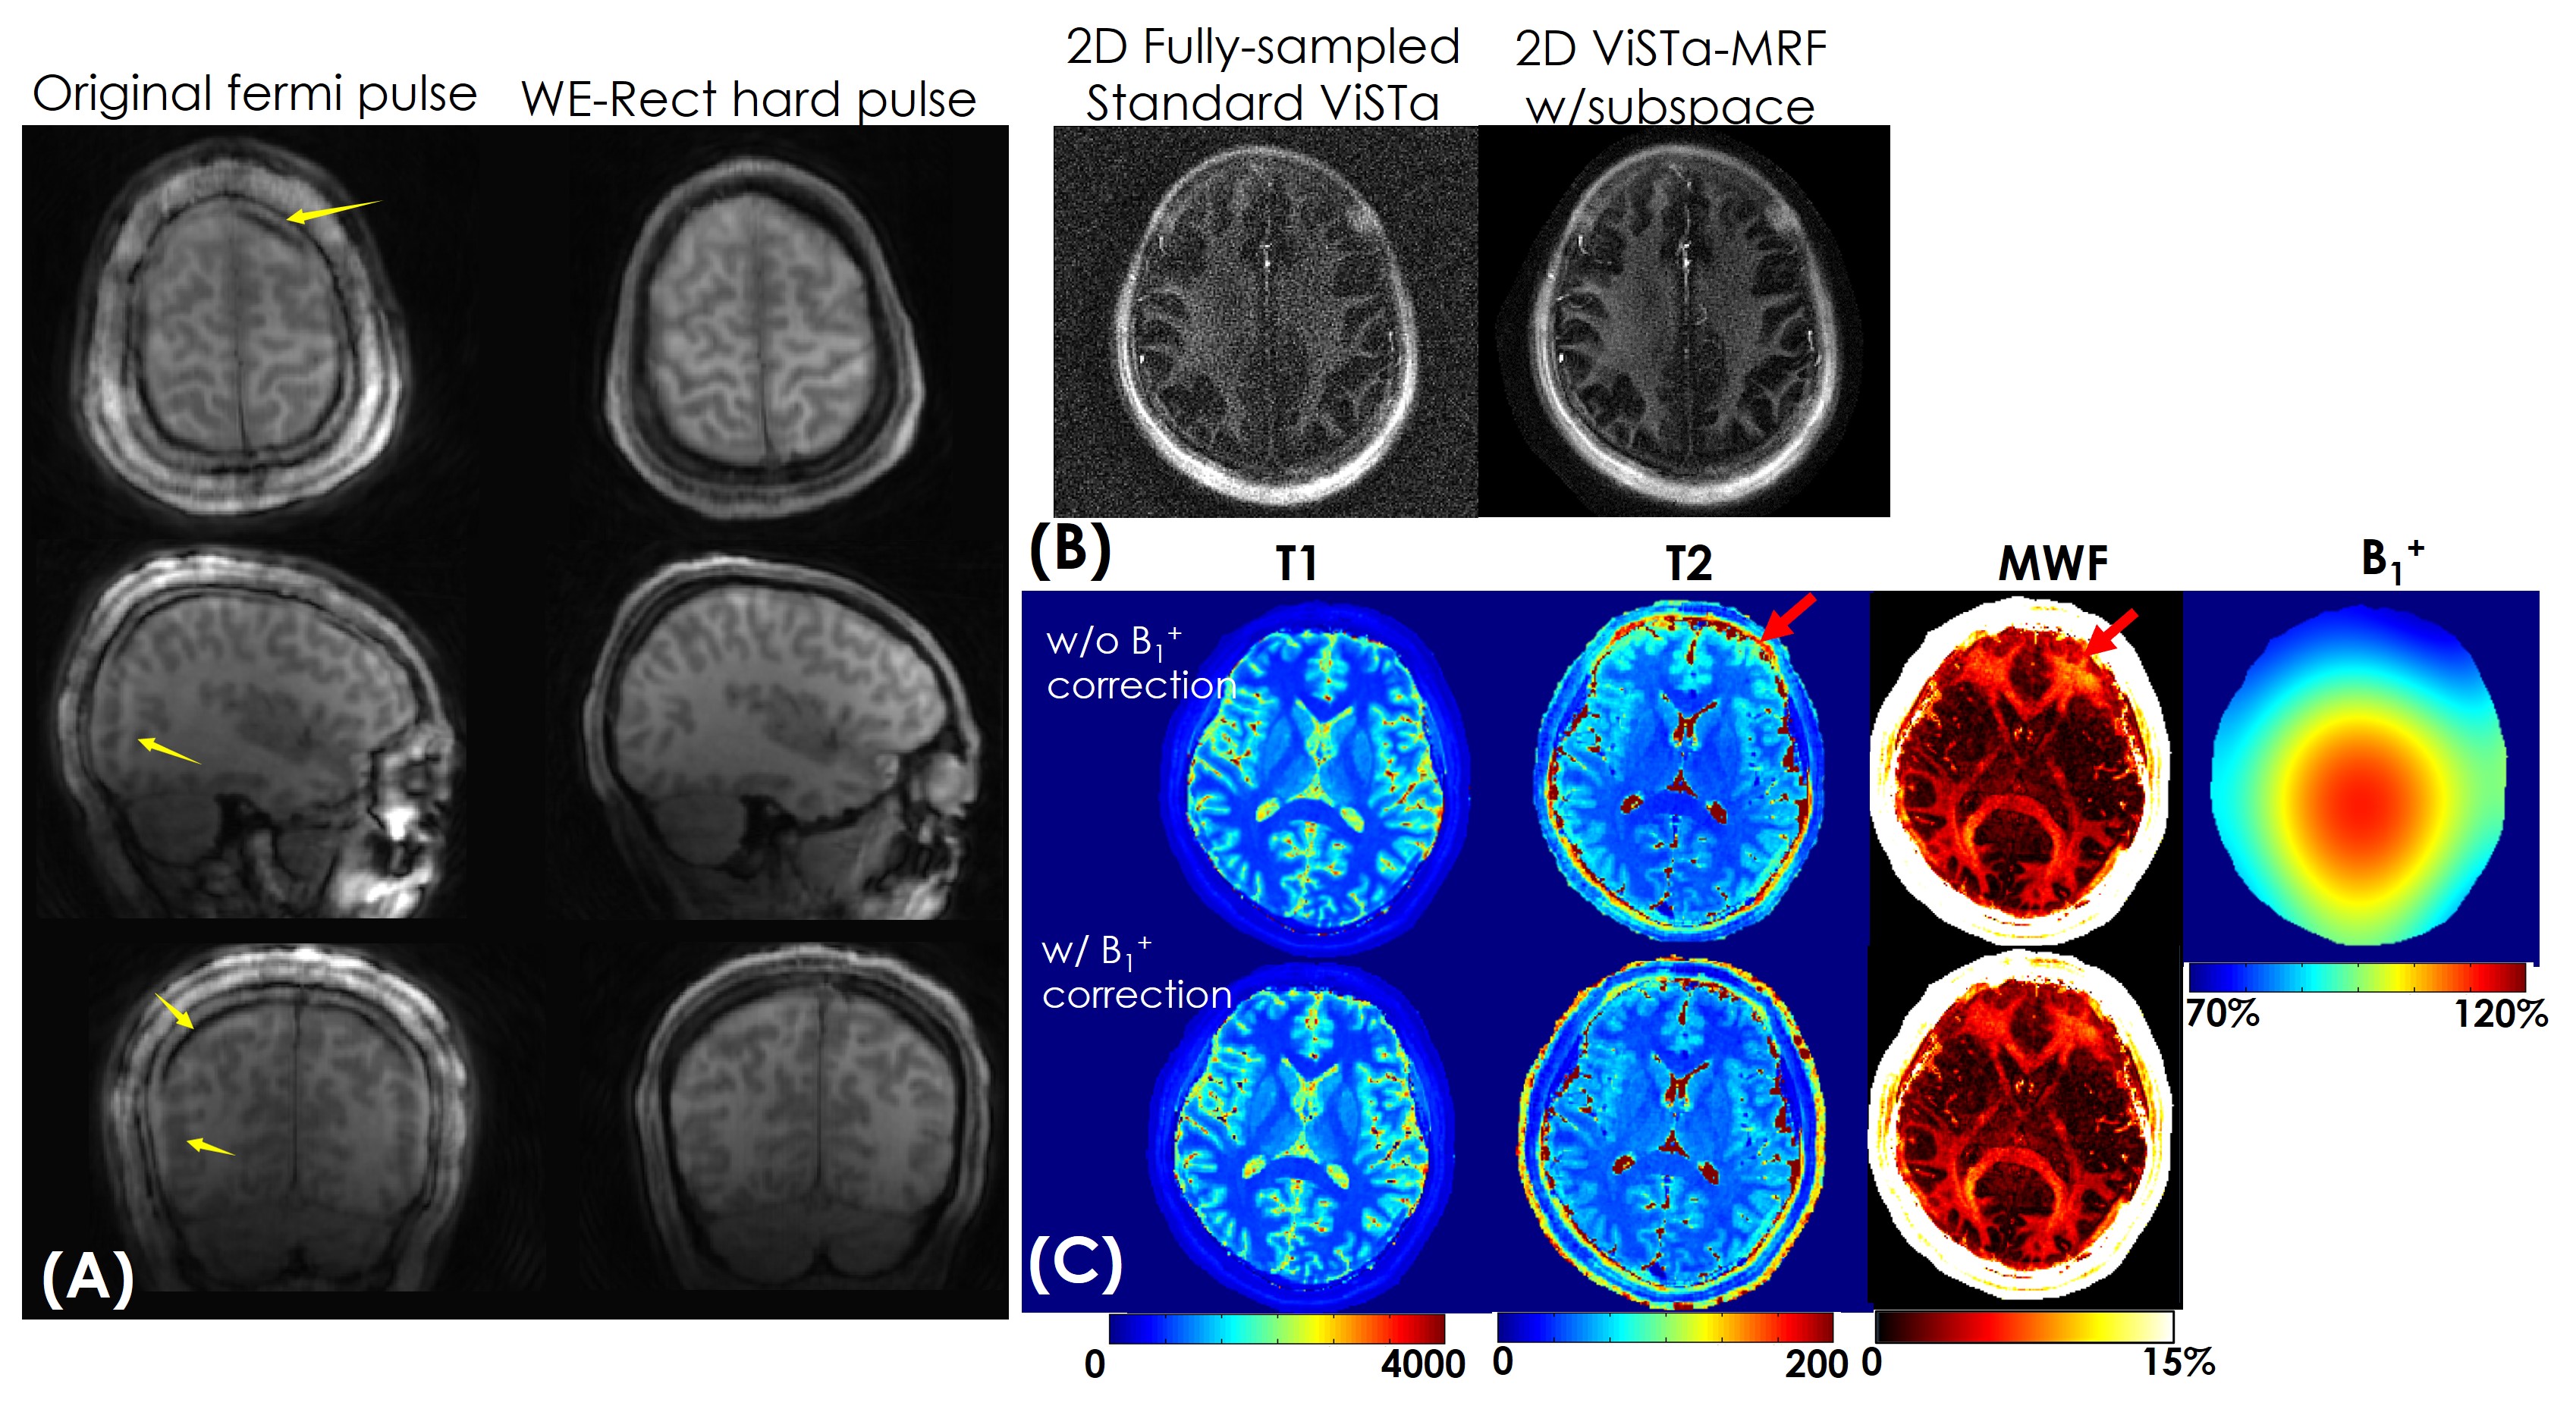
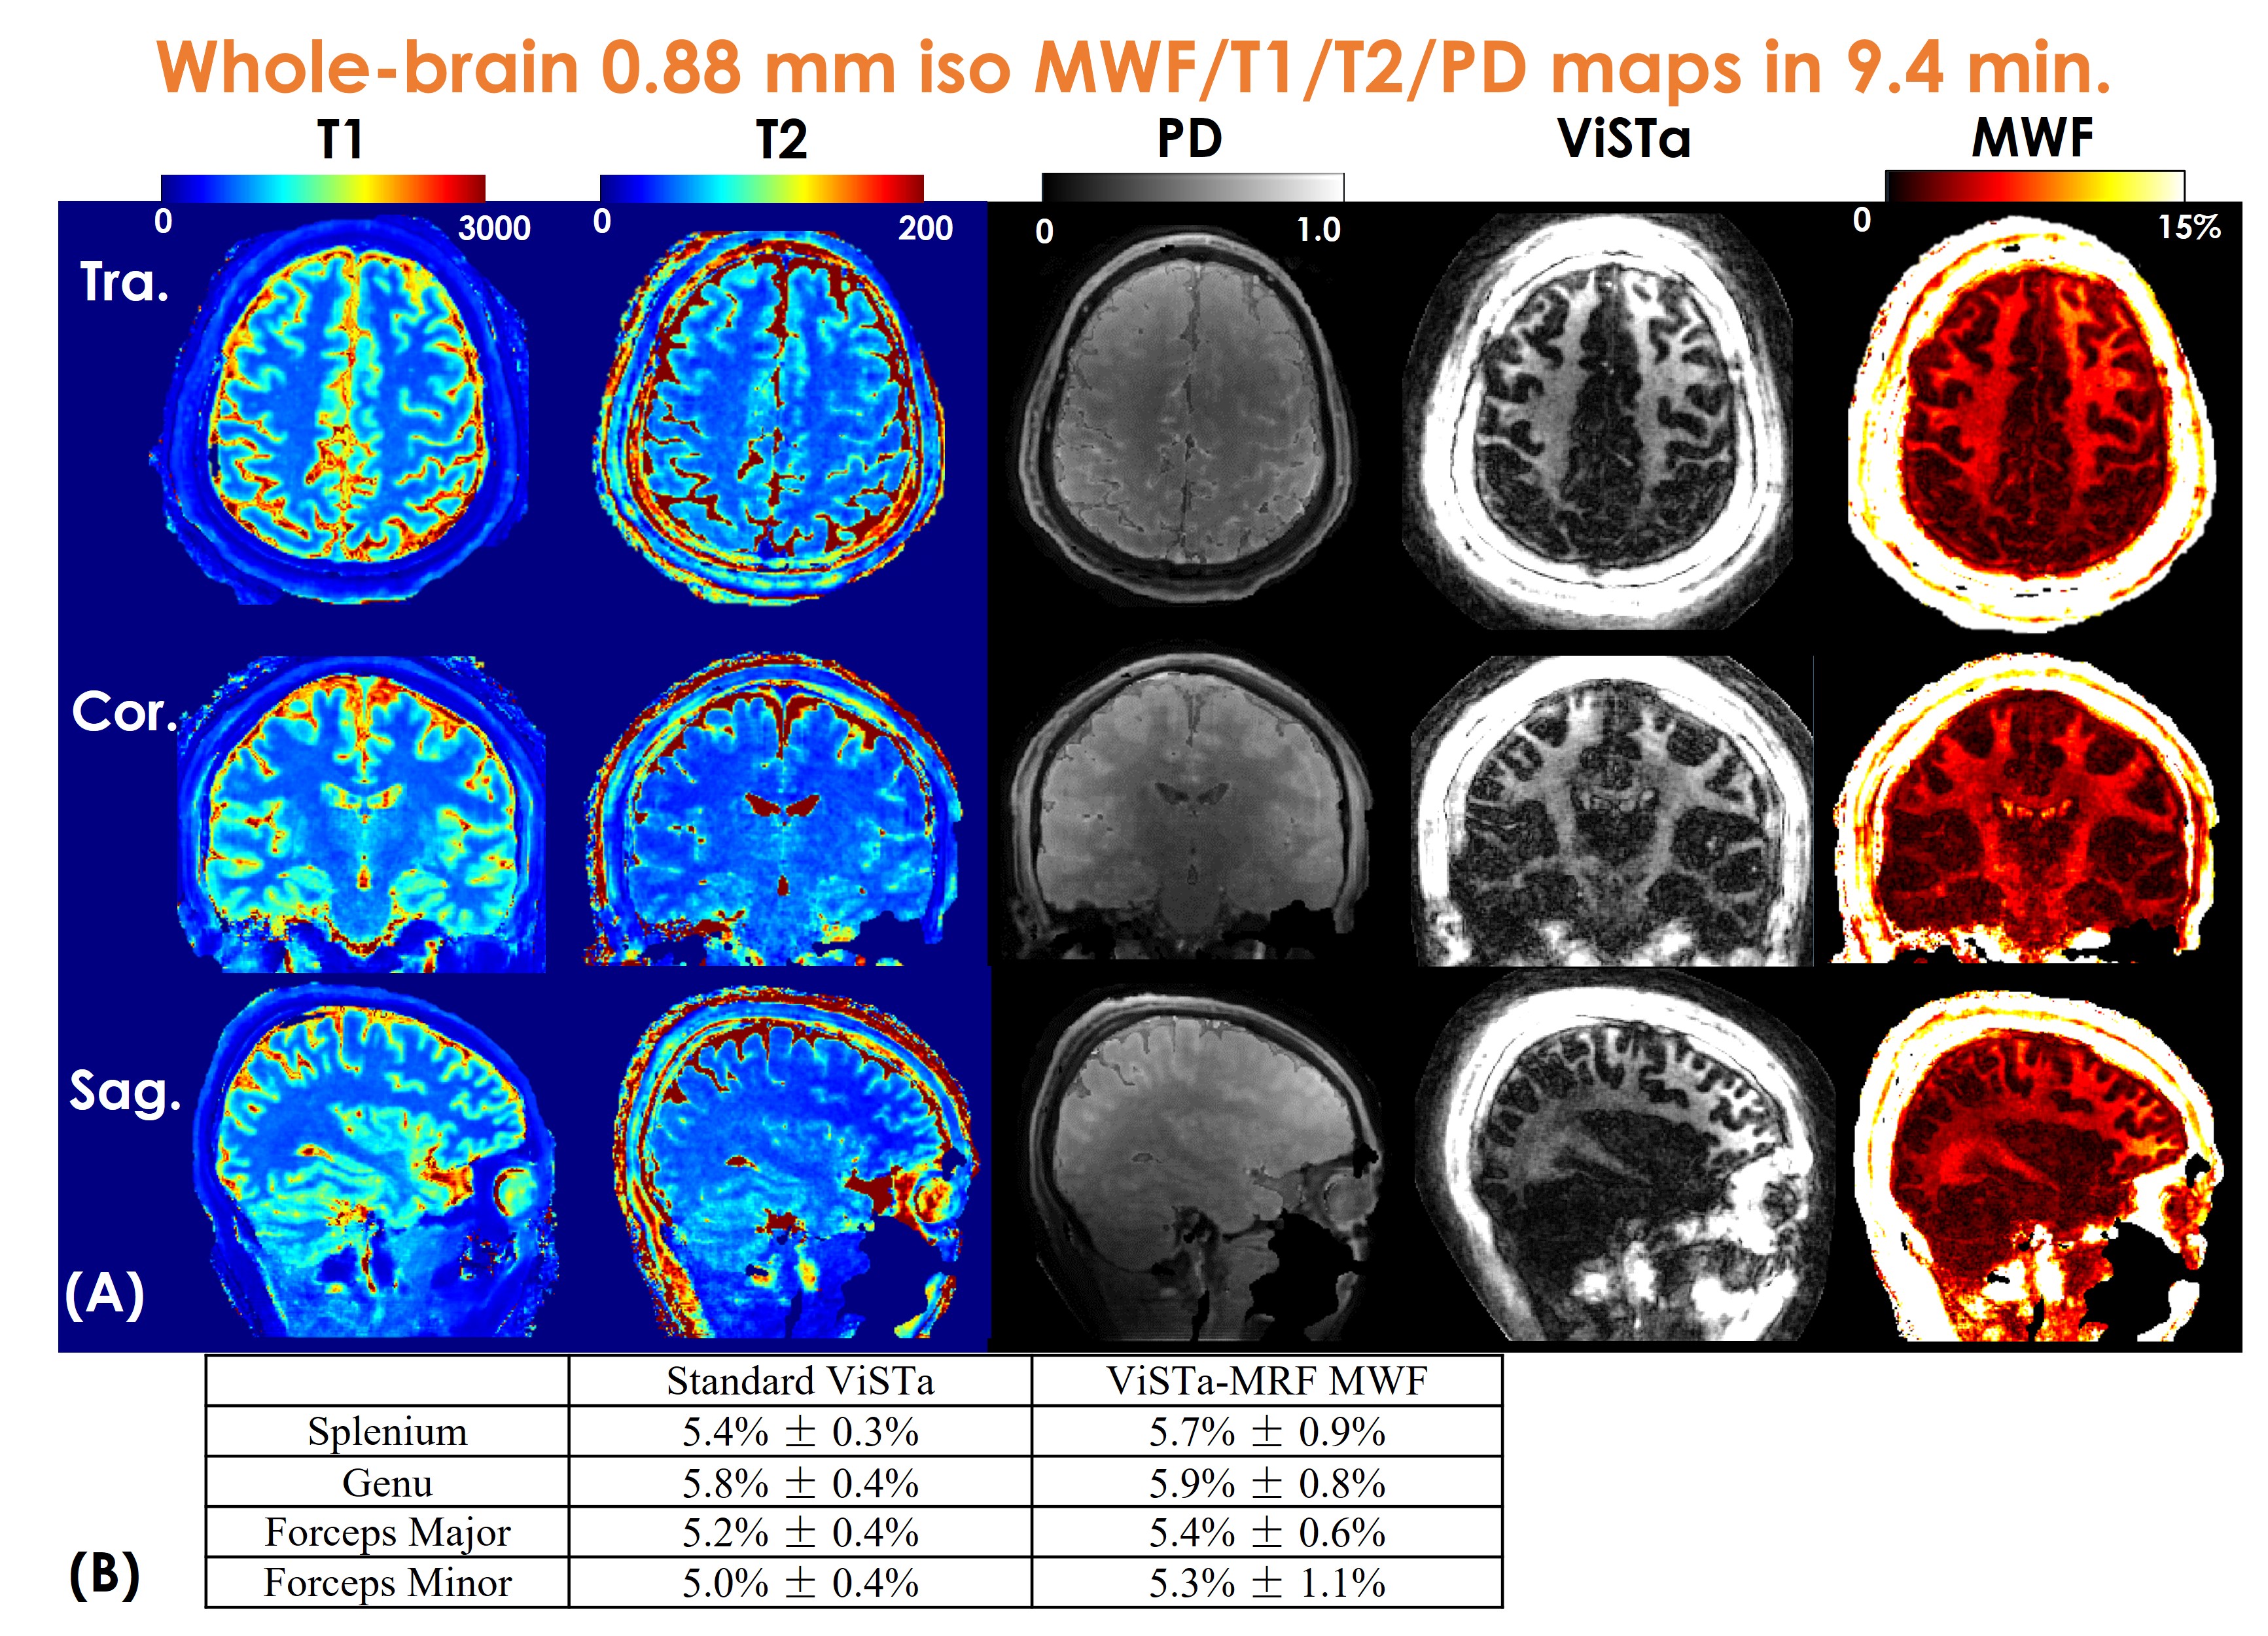
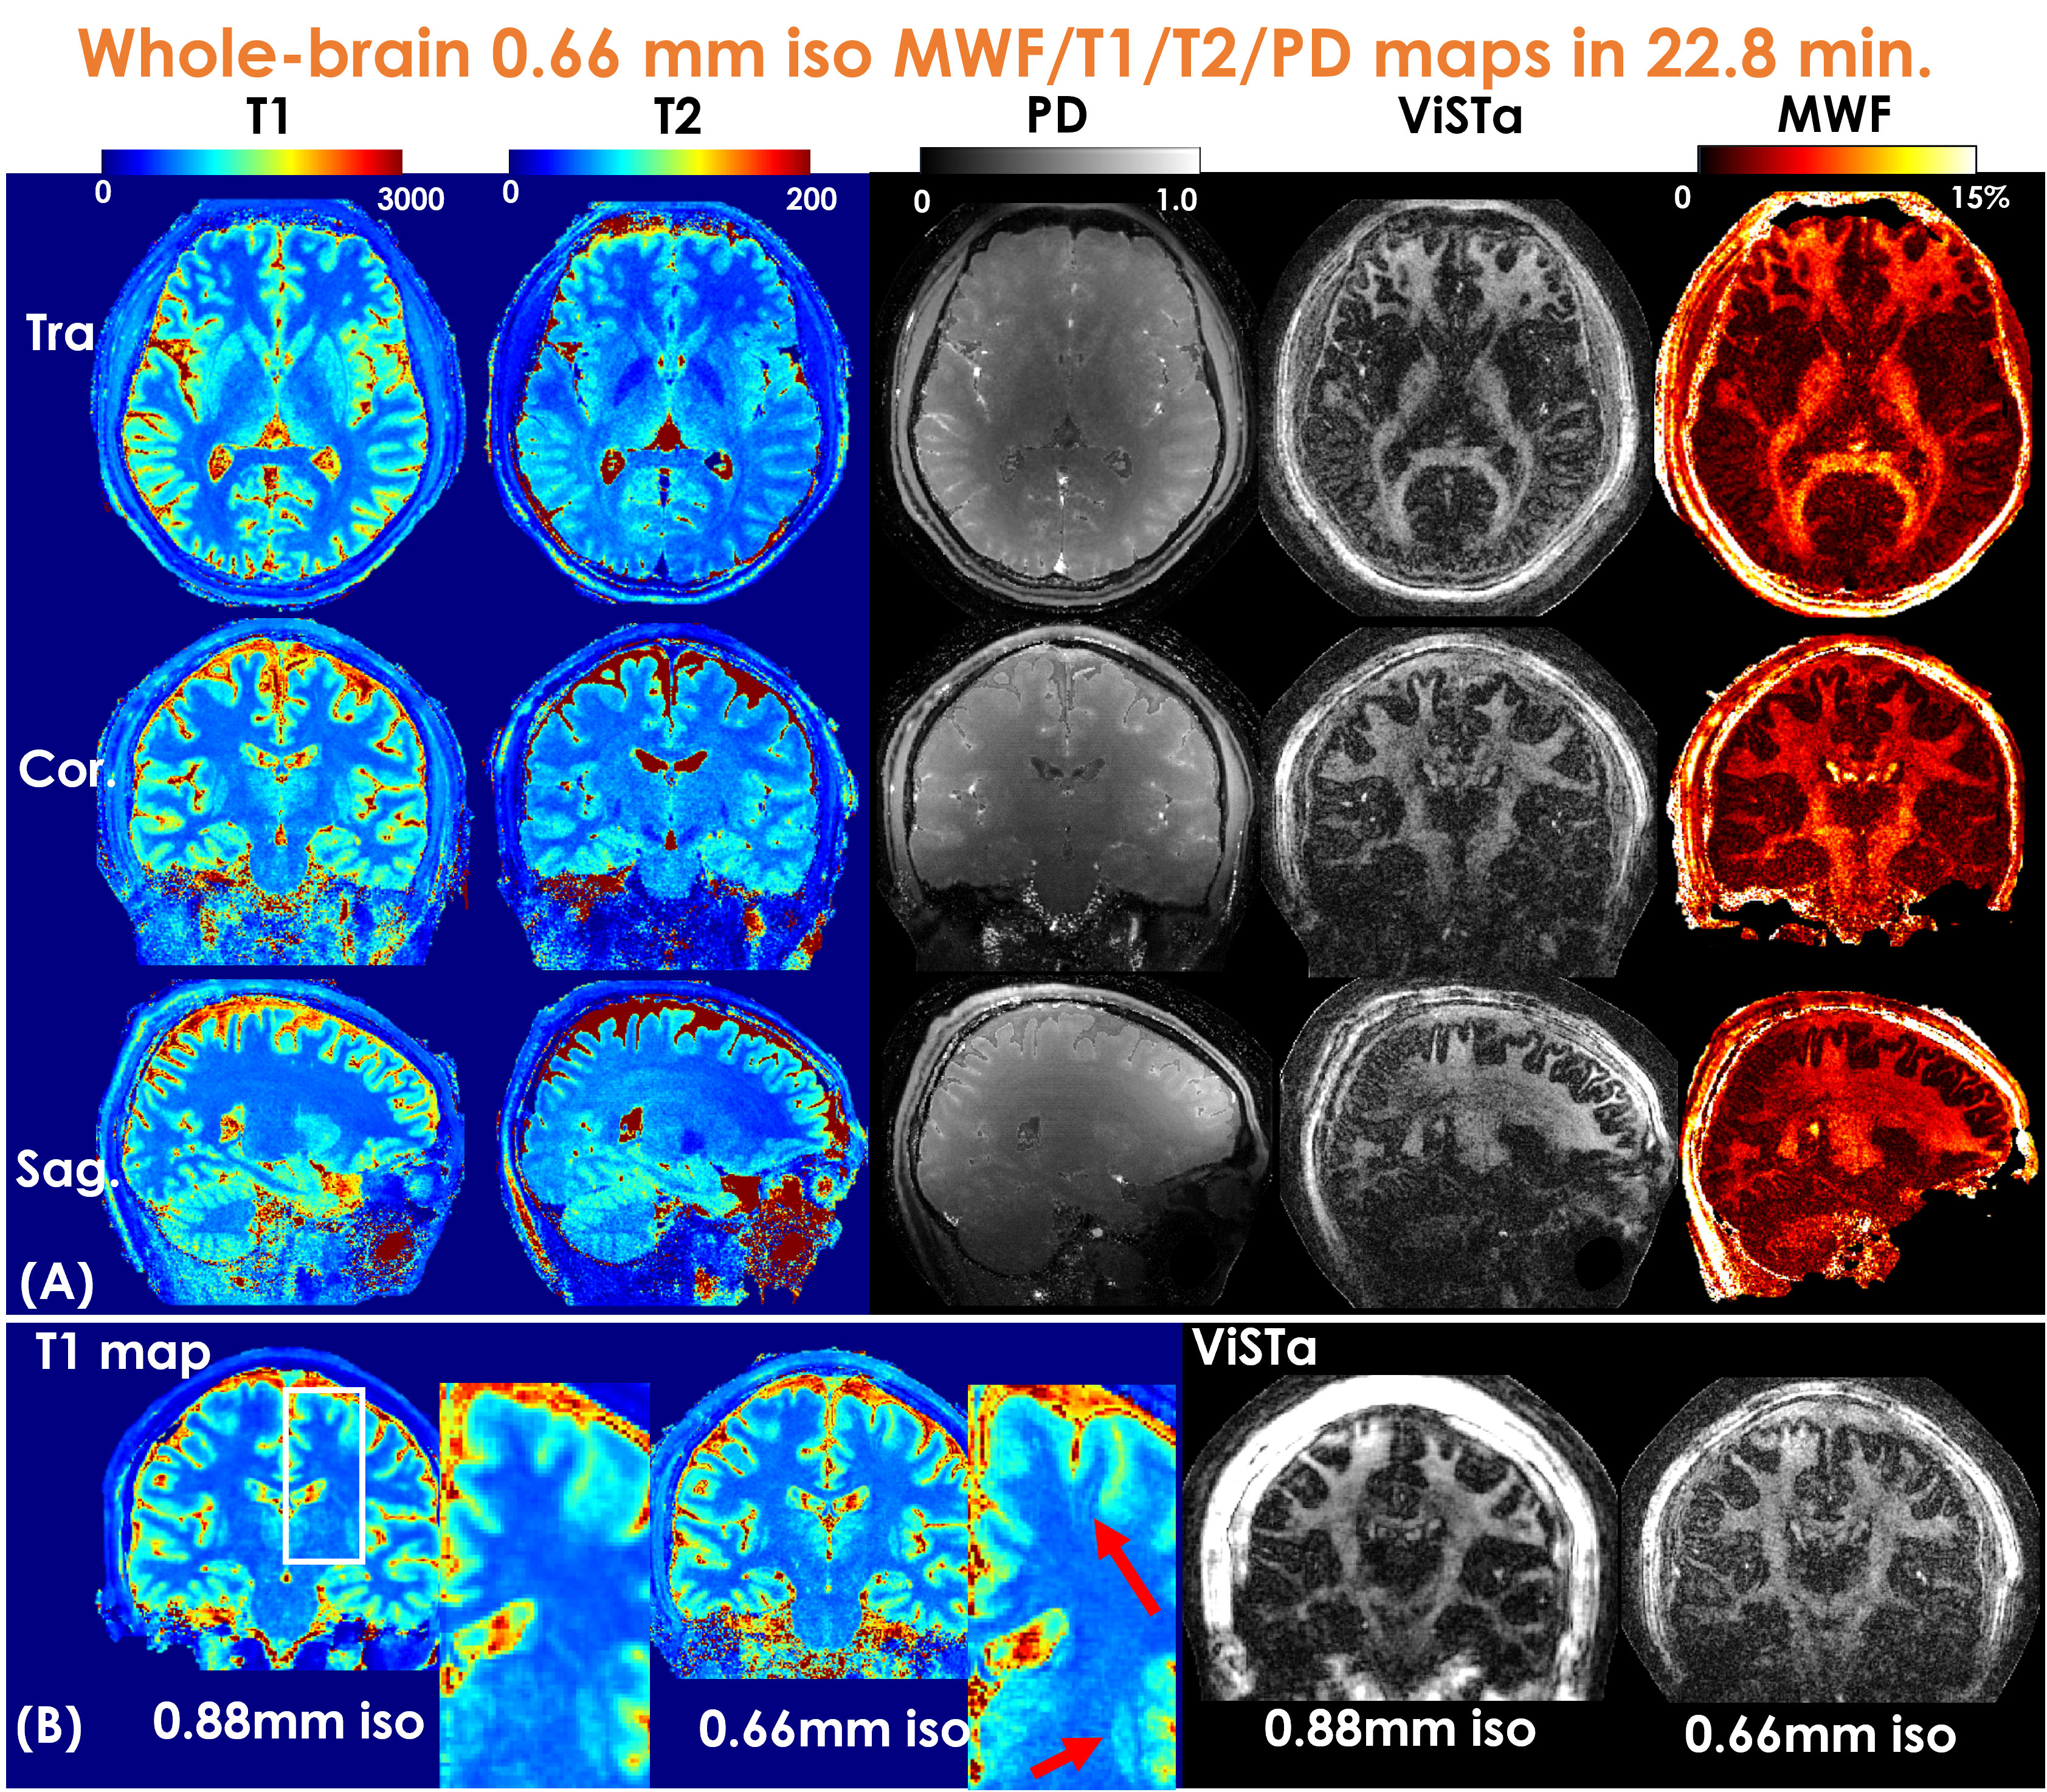
Figure3(A) shows a representative time-resolved MRF-volume after subspace reconstruction using original fermi-pulse and the WE-Rect pulse. Figure3(B) shows the comparison between a fully-sampled standard 2D-ViSTa sequence and ViSTa-MRF with subspace reconstruction, where the results are highly consistent, demonstrating the feasibility in leveraging the joint-spatiotemporal encoding information for highly-accelerated ViSTa-MRF data. Figure3(C) shows T1/T2/MWF maps with and without B1+-correction as well as corresponding B1+-maps. With B1+-correction, the estimated T2 and MWF maps are more uniform compared to the results without B1+ correction.Figure4(A) and 5(A) shows whole-brain 0.88mm-iso and 0.66mm-iso T1/T2/PD/ViSTa and MWF maps in three orthogonal views, respectively, where the MWF values shown in Fig.4(B) from ViSTa-MRF across four WM-regions are consistent with the literature results(3). In comparison with the 0.88mm-iso results, the higher resolution in the 0.66-mm dataset can aid in better visualization of subtle brain structures such as small sulci and the periventricular space as indicated by the red arrows in Fig5(B).
Discussion and conclusion
In this work, we developed an optimized 3D ViSTa-MRF pulse sequence together with a novel stochastic subspace reconstruction to achieve whole-brain mesoscale MWF and T1/T2/PD mapping in a single scan. The results demonstrate that the proposed method enables high-quality multi-parametric brain mapping at sub-millimeter resolution on a clinical 3T scanner.Acknowledgements
This study is supported in part by GE Healthcare research funds and NIH R01EB020613, R01MH116173, R01EB019437, U01EB025162, P41EB030006.References
1. Piredda GF, Hilbert T, Thiran JP, Kober T. Probing myelin content of the human brain with MRI: A review. Magn. Reson. Med. 2021;85:627–652 doi: 10.1002/mrm.28509.
2. Mackay A, Whittall K, Adler J, Li D, Paty D, Graeb D. In vivo visualization of myelin water in brain by magnetic resonance. Magn. Reson. Med. 1994;31:673–677 doi: 10.1002/mrm.1910310614.
3. Oh SH, Bilello M, Schindler M, Markowitz CE, Detre JA, Lee J. Direct visualization of short transverse relaxation time component (ViSTa). Neuroimage 2013;83:485–492 doi: 10.1016/j.neuroimage.2013.06.047.
4. Wu Z, Bilgic B, He H, et al. Wave-CAIPI ViSTa: highly accelerated whole-brain direct myelin water imaging with zero-padding reconstruction. Magn. Reson. Med. 2018;80:1061–1073 doi: 10.1002/mrm.27108.
5. Liao C, Cao X, Gong T, et al. High-resolution myelin-water fraction (MWF) and T1/T2/proton-density mapping using 3D ViSTa-MR fingerprinting with subspace reconstruction. In: ISMRM . ; 2021. p. 1545.
6. Cao X, Liao C, Srinivasan Iyer S, et al. Optimized multi-axis spiral projection MR fingerprinting with subspace reconstruction for rapid whole-brain high-isotropic-resolution quantitative imaging.
7. Norbeck O, Sprenger T, Avventi E, et al. Optimizing 3D EPI for rapid T1-weighted imaging. Magn. Reson. Med. 2020;84:1441–1455 doi: 10.1002/mrm.28222.
8. Chambolle A, Ehrhardt MJ, Richtarik P, Schonlieb CB. Stochastic primal-dual hybrid gradient algorithm with arbitrary sampling and imaging applications. SIAM J. Optim. 2018;28:2783–2808 doi: 10.1137/17M1134834.
9. Weigel M. Extended phase graphs: Dephasing, RF pulses, and echoes - Pure and simple. J. Magn. Reson. Imaging 2015;41:266–295 doi: 10.1002/jmri.24619.
10. Ong F, Lustig M. SigPy: a python package for high performance iterative reconstruction. In: ISMRM. ; 2019.
11. Ong F, Uecker M, Lustig M. Accelerating Non-Cartesian MRI Reconstruction Convergence Using k-Space Preconditioning. IEEE Trans. Med. Imaging 2020;39:1646–1654 doi: 10.1109/TMI.2019.2954121.
Figures