0182
Quantitative Parameter Mapping of Prostate using Stack-of-Stars and QTI Encoding1GE Healthcare, Munich, Germany, 2GE Healthcare, Madrid, Spain, 3IRCCS Stella Maris, Pisa, Italy, 4IMAGO7 Foundation, Pisa, Italy, 5Hospital Universitario y Politécnico La Fe, Valencia, Spain, 6Technische Hochschule Ingolstadt, Ingolstadt, Germany
Synopsis
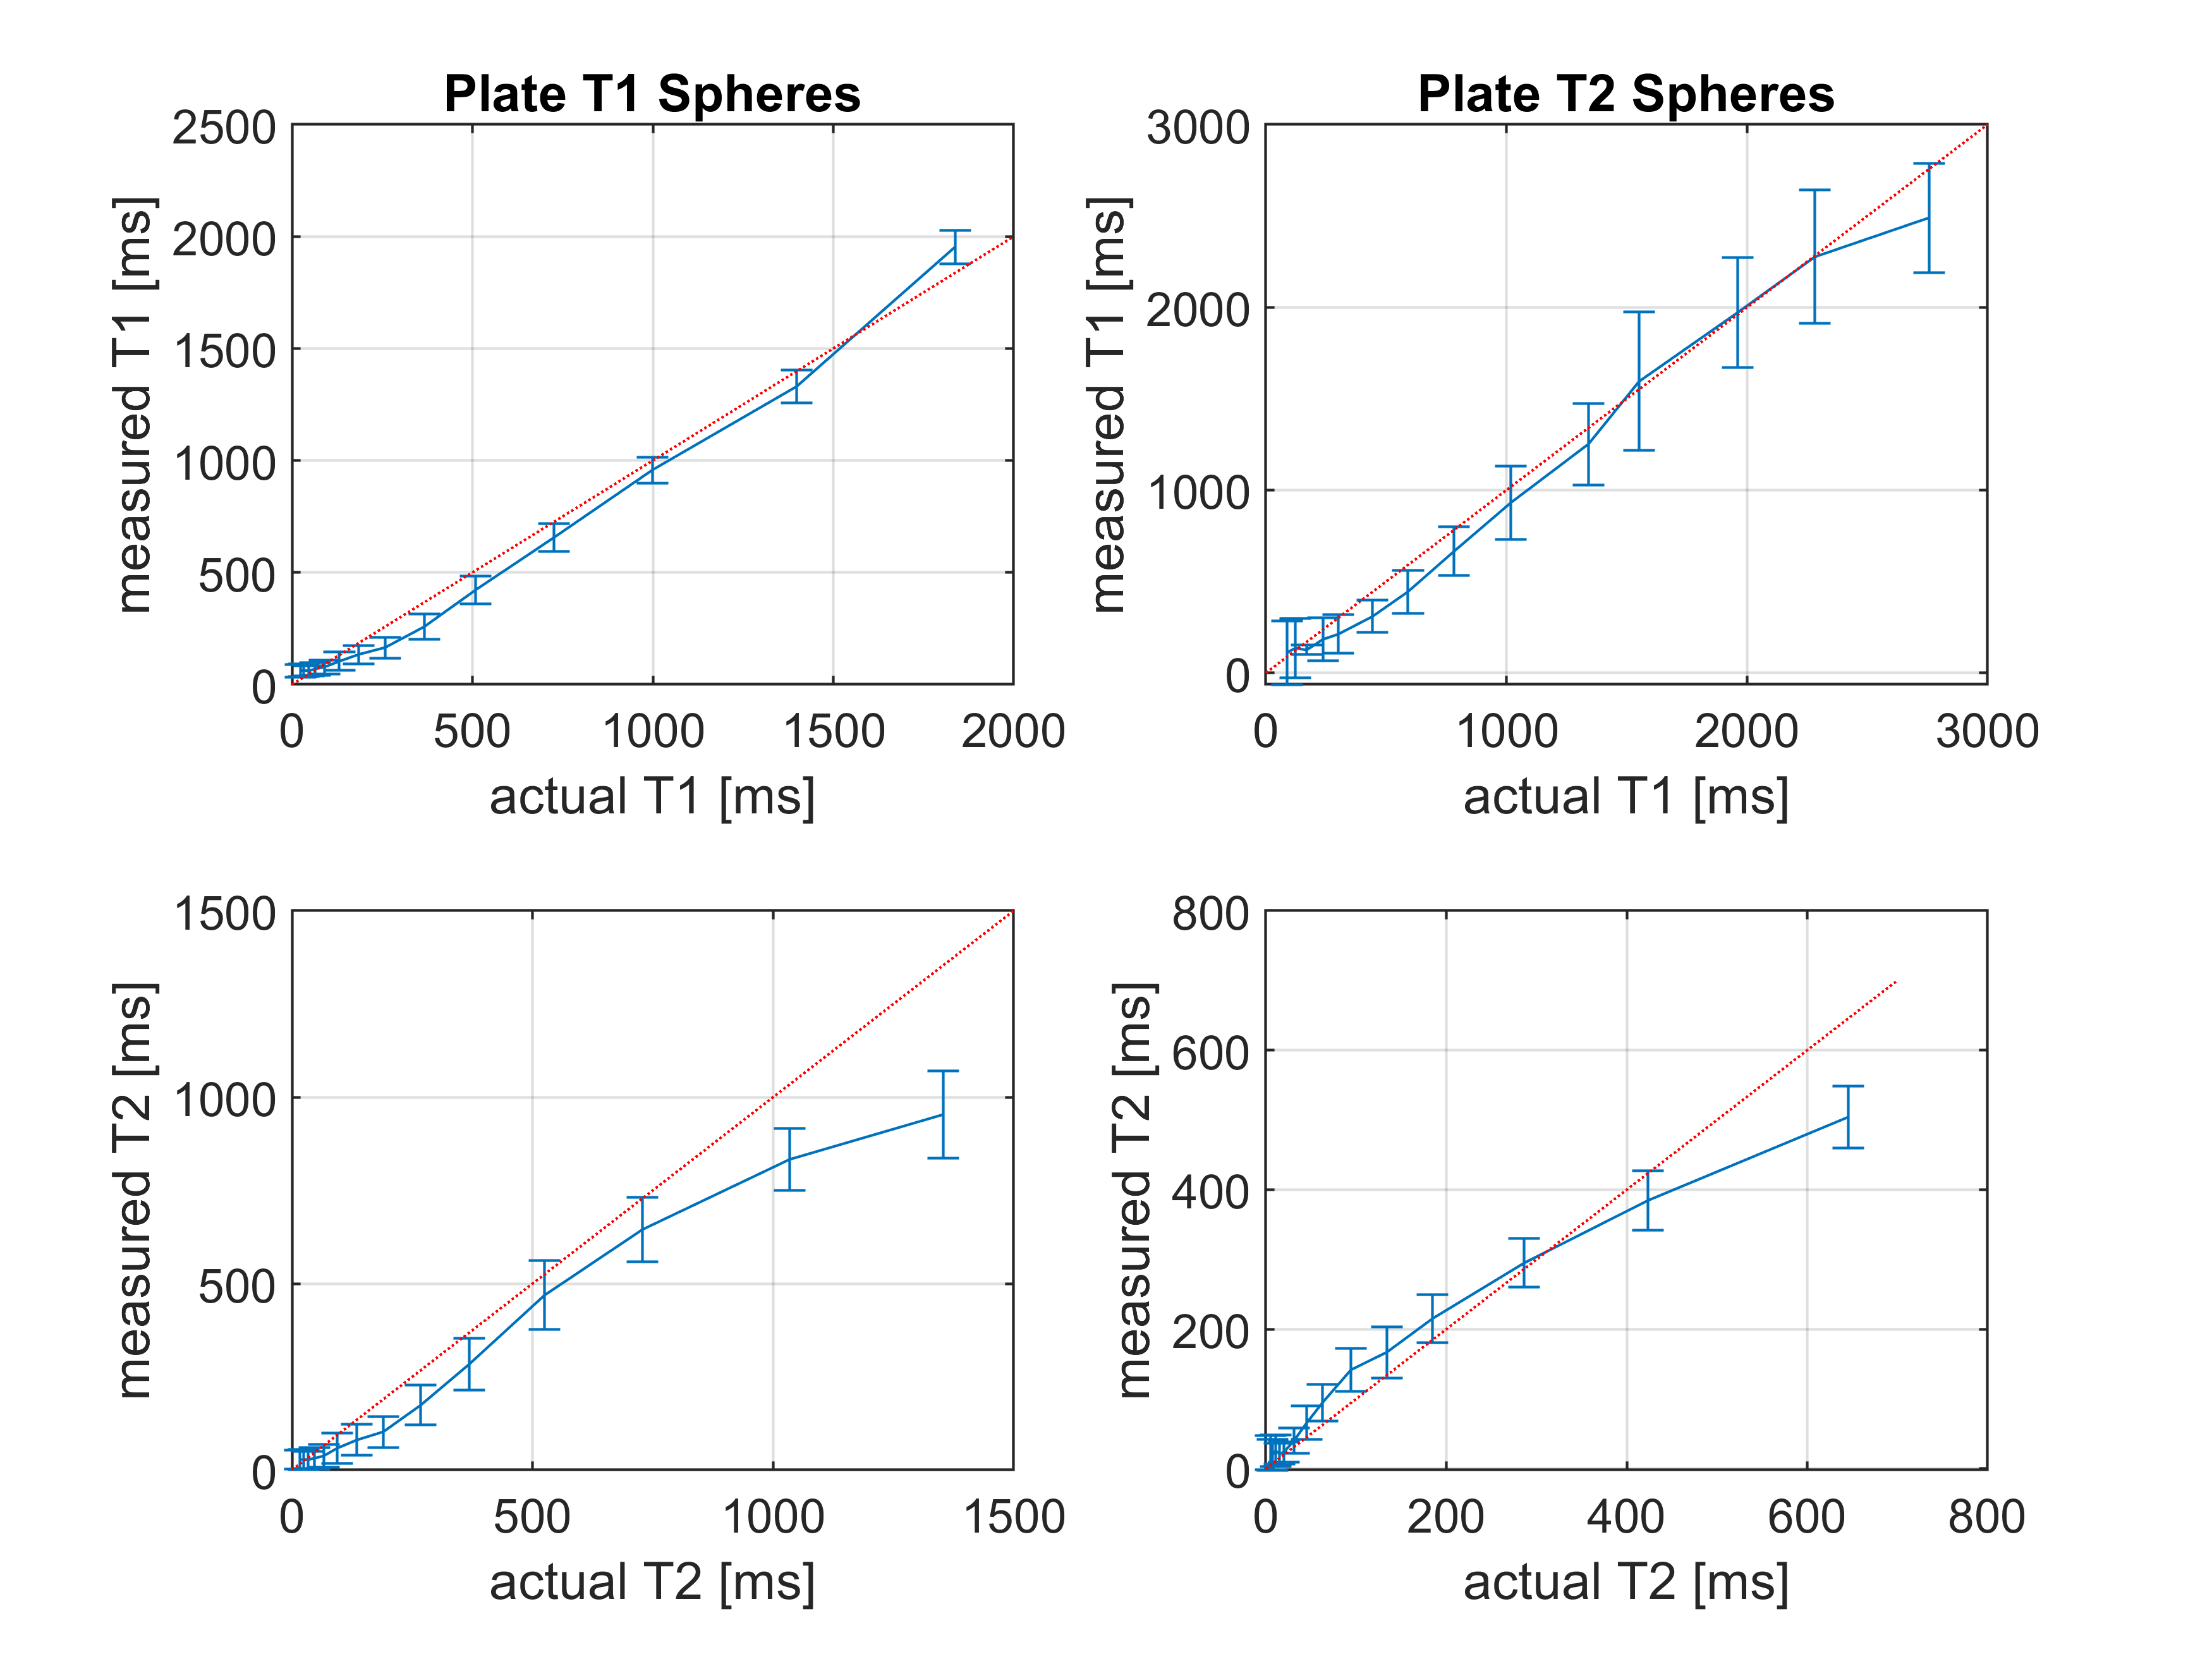
Quantitative MRI offers diagnostic insights into tissue and enables characterisation of diseases, while reducing variability between operators, sites and vendors. A stack-of-stars sequence using Quantitative Transient State Imaging (QTI) was optimised and implemented to map T1, T2 and Proton Density in human prostates. Resulting in vivo multi-parametric maps were of high quality, while validation in the NIST phantom show good agreement with T1 and T2 reference values.
Introduction
Quantitative MRI is a way to provide reproducible data across different operators, sites and vendors. Quantitative Transient State Imaging (QTI) [1], which shares some concepts with MR Fingerprinting [2], offers fast and simultaneous mapping of T1, T2 and Proton Density (PD) with high reproducibility and repeatability [3]. Most studies and developments, however, focused on brain MRI, while body applications are generally challenging because of motion, B0 inhomogeneities and large lipid contents. The goal of this work was to implement a QTI stack-of-stars sequence and optimise it for prostate MRI.Methods
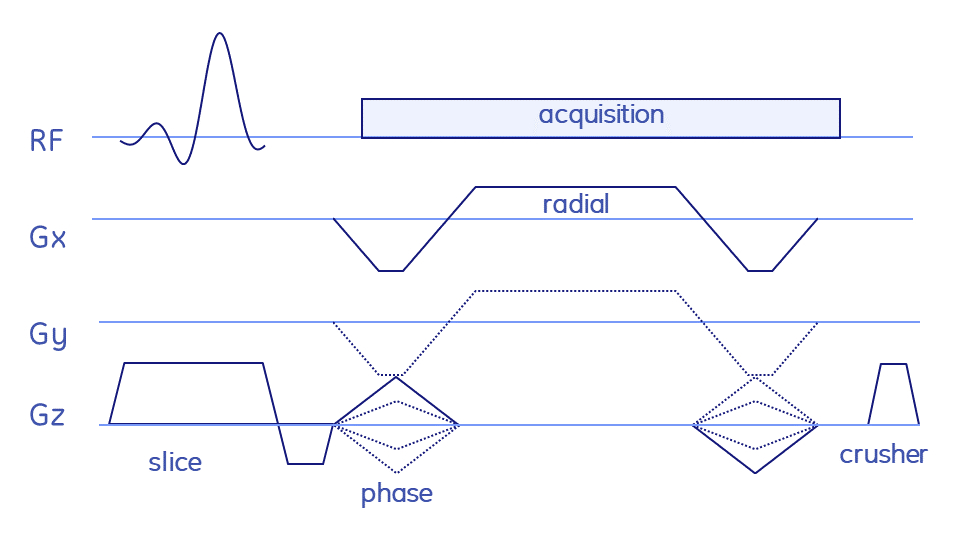
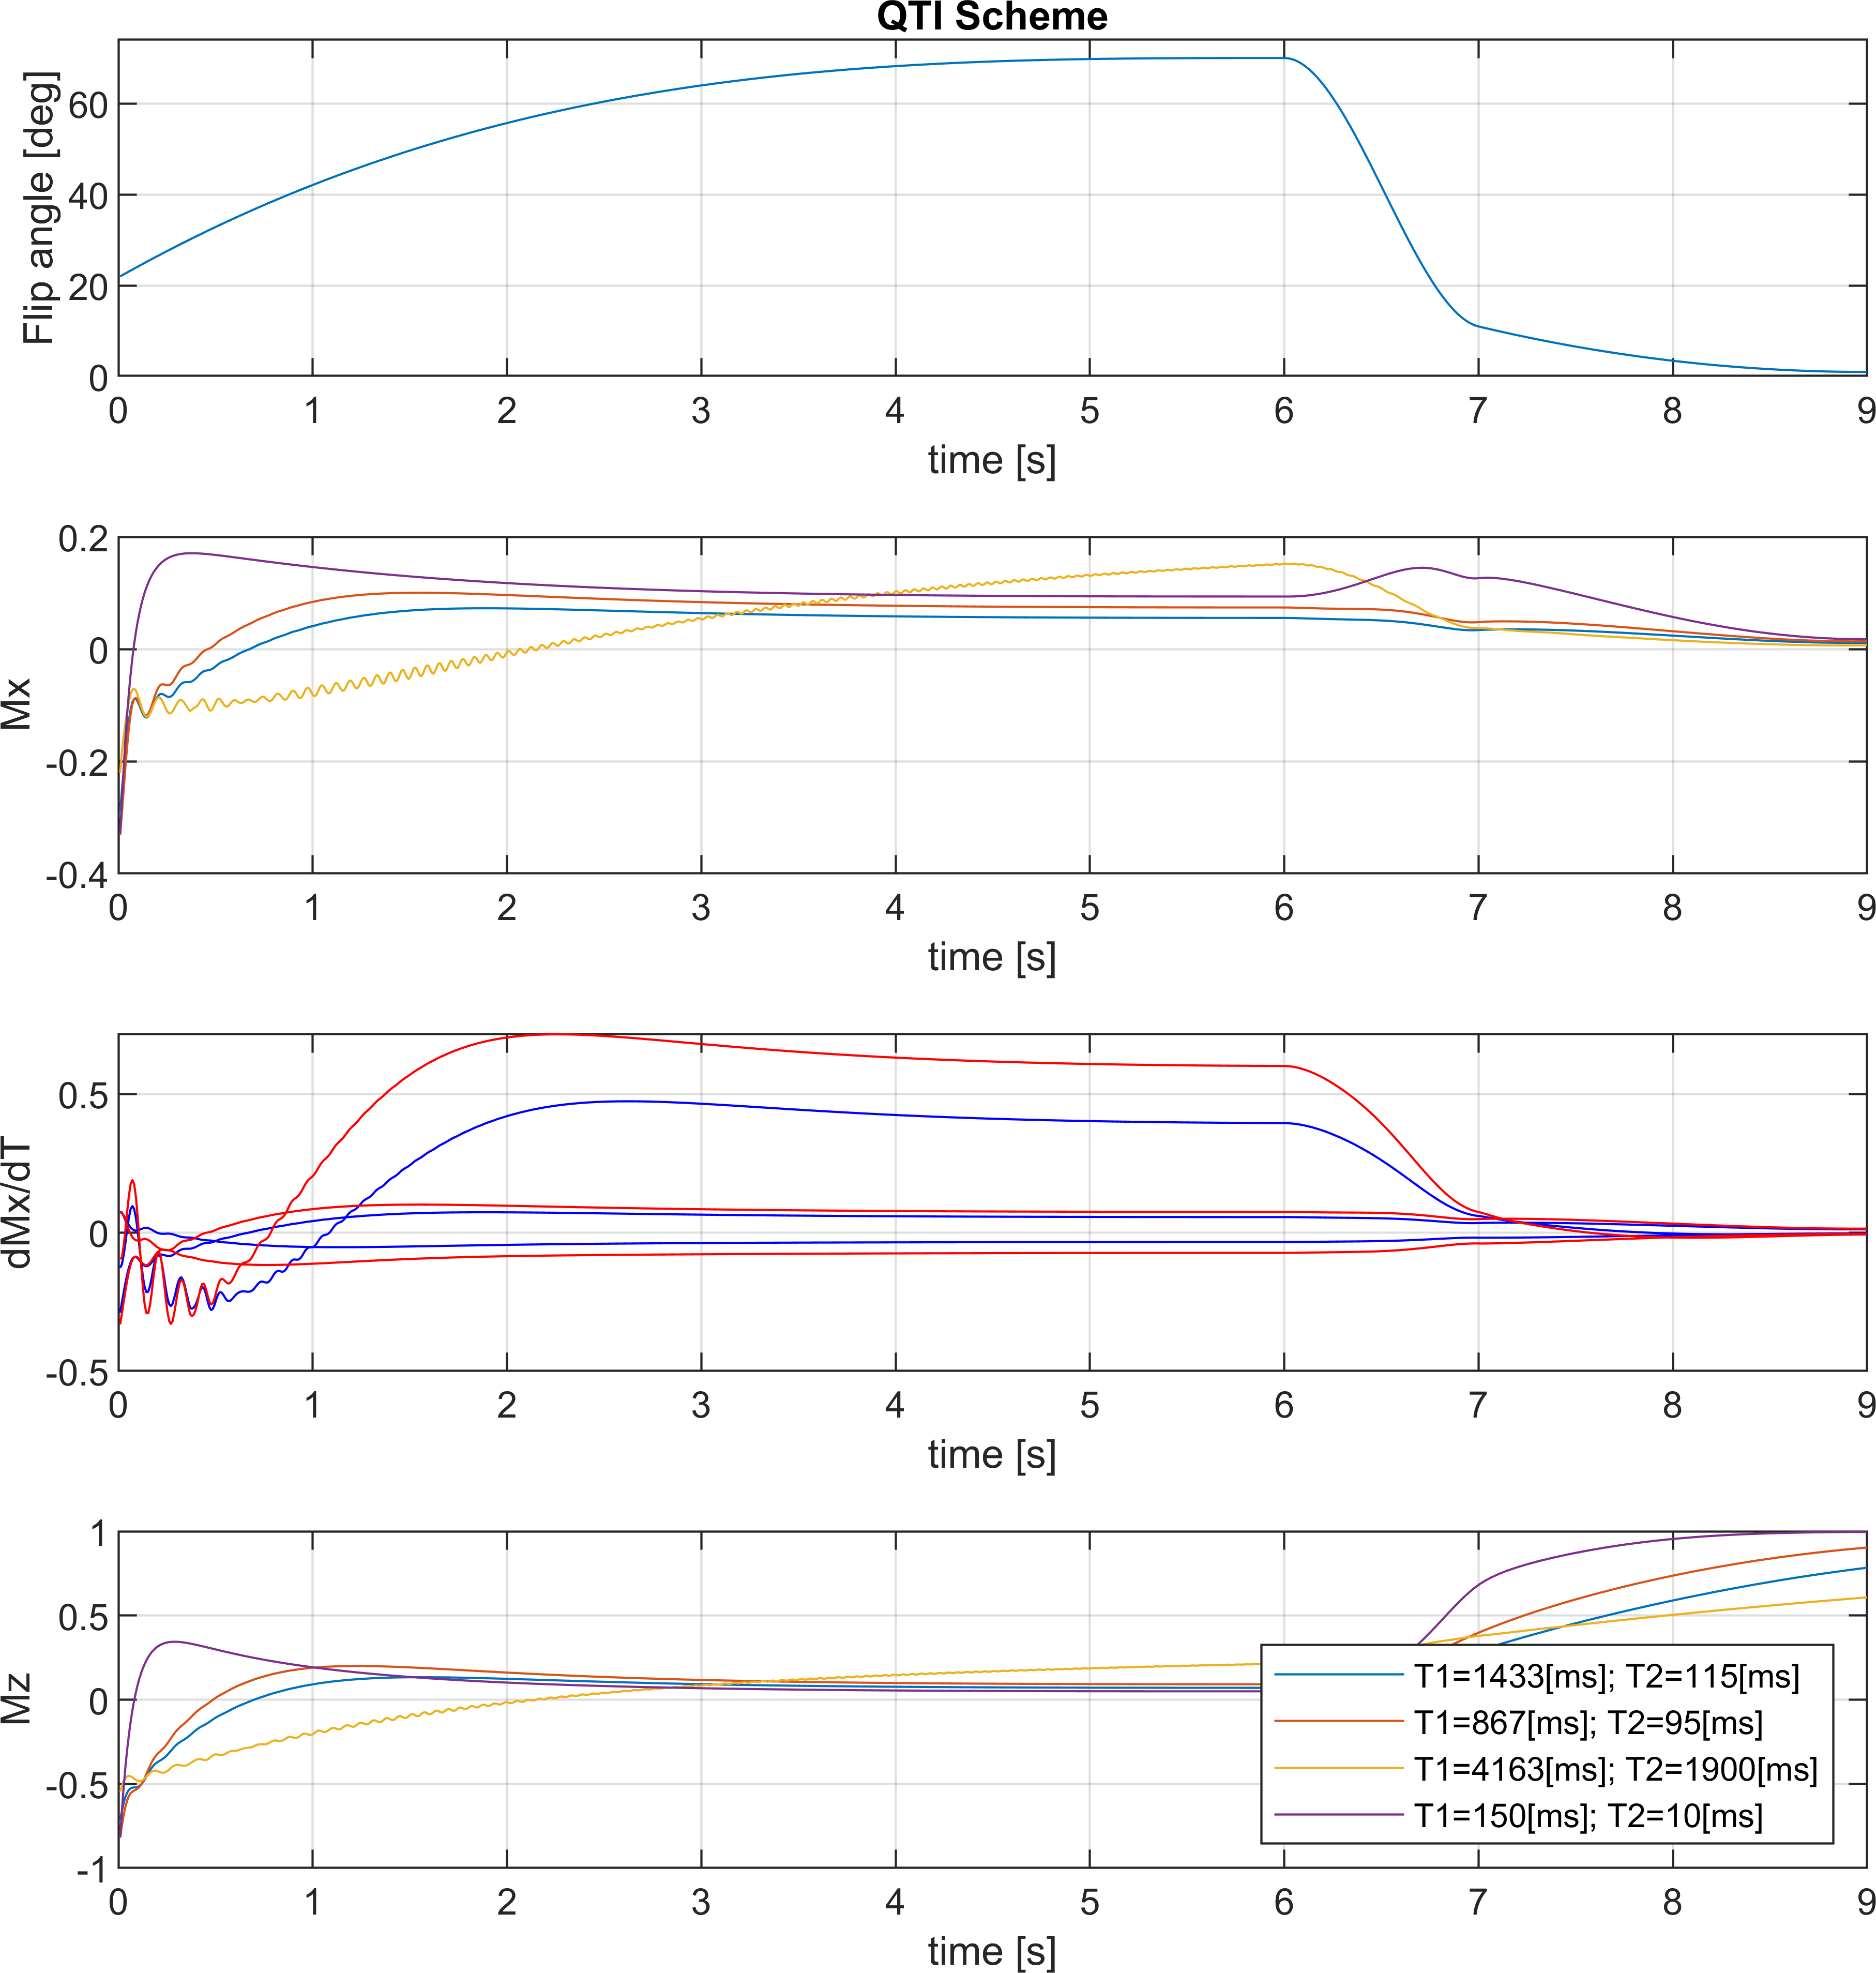
The stack-of-stars sequence is shown in Fig. 1, while the QTI flip angle scheme and its optimisation are depicted and explained in Fig. 2. The whole stack-of-stars QTI encoding was implemented via fidall, a flexible multi-release sequence to read in gradient waveforms, RF pulses and parameters such as lists of flip angles from external files.Two healthy volunteers were scanned in the prostate on a 3T PET-MR (GE Healthcare, Waukesha, WI, USA) whole-body scanner equipped with a torso multi-channel receive coil, while the brain of one healthy-volunteer and the NIST phantom were acquired using an 8-channel head receive coil. Sequence parameters were: FOV=300x300x90 mm3, matrix size=300x300x20, 2000 spokes per phase-encoding plane segmented into two QTI trains each with one inversion and 1000 dfferent flip angles; TR=9.4ms, total acquisition time 6:16 min.
Data was reconstructed via SVD-compression, gridding, coil combination, apodisation and matching pursuit to simulated Extended Phase Graphs.
Results and Discussion
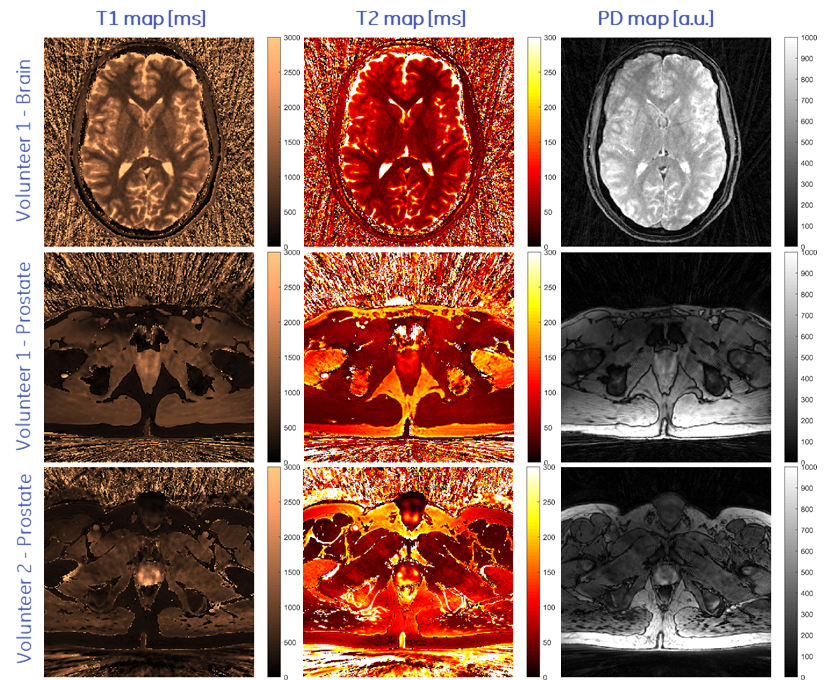
Representative axial slices of the obtained T1, T2 and PD of the brain and the two prostate acquisitions are shown in Fig. 3. T1 and T2 times agree well with published values [3,5]. Compared to 2D methods, the proposed stack-of-stars acquisition scheme has the advantage of improving SNR by acquiring (hence averaging) the full volume during the whole acquisition time. Sufficient SNR is required for accurately fitting T1 and T2 maps and to provide clinically relevant image quality. This is challenging in prostate imaging without endorectal coils due to the distance from the surface receive coil elements. SNR was improved by using sufficiently long acquisition times, by reducing the readout gradient amplitude and by using a voxel size of 1x1x4.5mm, i.e., an increased voxel dimension along z.Image reconstruction and parameter inference (including Dicom export) is implemented on the MRI scanner to facilitate a clinical workflow. Currently, reconstruction times were in the same order of magnitude as the acquisition time and could be accelerated by using newer computers or GPUs.
Conclusion
MR quantitative parameter mapping using the proposed QTI stack-of-stars sequence meets tight clinical time constraints, while yielding high quality T1, T2 and PD maps.Acknowledgements
EU H2020 CHAIMELEON grant (#952172).References
[1] Rapid three-dimensional multiparametric MRI with quantitative transient-state imaging. Gómez PA, Cencini M, Golbabaee M, Schulte RF, Pirkl C, Horvath I, Fallo G, Peretti L, Tosetti M, Menze BH, Buonincontri G. Sci Rep. 2020 Aug 13;10(1):13769. doi: 10.1038/s41598-020-70789-2.
[2] Magnetic resonance fingerprinting. Ma D, Gulani V, Seiberlich N, Liu K, Sunshine JL, Duerk JL, Griswold MA. Nature. 2013 Mar 14;495(7440):187-92. doi: 10.1038/nature11971.
[3] Three dimensional MRF obtains highly repeatable and reproducible multi-parametric estimations in the healthy human brain at 1.5T and 3T. Buonincontri G, Kurzawski JW, Kaggie JD, Matys T, Gallagher FA, Cencini M, Donatelli G, Cecchi P, Cosottini M, Martini N, Frijia F, Montanaro D, Gómez PA, Schulte RF, Retico A, Tosetti M. Neuroimage. 2021 Feb 1;226:117573. doi: 10.1016/j.neuroimage.2020.117573.
[4] Optimal experiment design for magnetic resonance fingerprinting. Bo Zhao, Haldar JP, Setsompop K, Wald LL. Annu Int Conf IEEE Eng Med Biol Soc. 2016 Aug;2016:453-456. doi: 10.1109/EMBC.2016.7590737.
[5] The effect of gadolinium-based contrast agent administration on magnetic resonance fingerprinting-based T1 relaxometry in patients with prostate cancer. Sushentsev N, Kaggie JD, Buonincontri G, Schulte RF, Graves MJ, Gnanapragasam VJ, Barrett T. Sci Rep. 2020 Nov 24;10(1):20475. doi: 10.1038/s41598-020-77331-4.
Figures