3966
High angular resolution susceptibility and diffusion imaging in post mortem chimpanzee brain: Tensor characteristics and similarities1Max Planck Institute for Human Cognitive and Brain Sciences, Leipzig, Germany, 2Donders Institute for Brain, Cognition and Behaviour, Nijmegen, Netherlands, 3Max Planck Institute for Evolutionary Anthropology, Leipzig, Germany, 4Tai Chimpanzee Project, Centre Suisse de Recherches Scientifiques en Cote d'Ivoire, Abidjan, Cote D'ivoire, 5Department of Human Evolutionary Biology, Harvard University, Cambridge, MA, United States, 6Project Group Epidemiology of Highly Pathogenic Microorganisms, Robert Koch Institute, Berlin, Germany, 7EECS, UC Berkeley, Berkeley, CA, United States
Synopsis
We present a ‘high angular resolution’ approach to susceptibility tensor imaging (STI) consisting of susceptibility-weighted acquisitions at 60 independent orientations in post- mortem chimpanzee brain. The derived susceptibility tensor and metrics are compared with the corresponding diffusion tensor-derived metrics and single-orientation quantitative susceptibility mapping (QSM) results. A preliminary approach to assess the voxel-wise relationship of the two tensors in white matter is presented: using machine learning strategies, an effort to estimate the susceptibility tensor from the diffusion tensor and minimum single-orientation QSM data in selected regions of interest was made.
Introduction
There is increasing interest in linking brain pathologies to local alterations of iron-myelin content, and hence, in their precise quantitative assessment, for example by quantitative susceptibility mapping (QSM)1,2. Susceptibility has been shown to be anisotropic, especially in white matter (WM) regions, due to the specific arrangement of lipids enveloping myelinated fibers3. In susceptibility tensor imaging (STI), susceptibility is depicted as a 2nd rank symmetric tensor, in a similar way as orientation-dependent diffusivity in diffusion tensor imaging (DTI). However, the quality of STI is severely limited due to the need for multiple re-orientations of the sample inside the main magnetic field, whereas orientation-dependent information on water diffusion is easily obtained by corresponding selections of the diffusion-encoding gradients4,5.Despite different physical origins underlying susceptibility and diffusion, their orientation dependence is primarily defined by the presence of myelinated fibers and previous studies reported similarities between the susceptibility tensor (ST) and diffusion tensor (DT) in main fiber bundles. Consistently, we may assume that the ST shares the same shortcomings of the DT, such as an incapability to resolve multiple fiber orientations within a voxel6.
We present a pipeline for acquisition and processing of high angular resolution susceptibility imaging (‘HARSI’) for post-mortem brain data, to better exploit orientation-dependent susceptibility for WM characterization. On the first step, the derived ST is analyzed and its correlation with the corresponding DT is assessed. Single-orientation susceptibility estimates are compared with a reference STI-derived susceptibility map, and a preliminary pipeline is developed for studying the potential of voxel-wise estimation of ST from DT and minimum susceptibility data using machine learning.
Methods
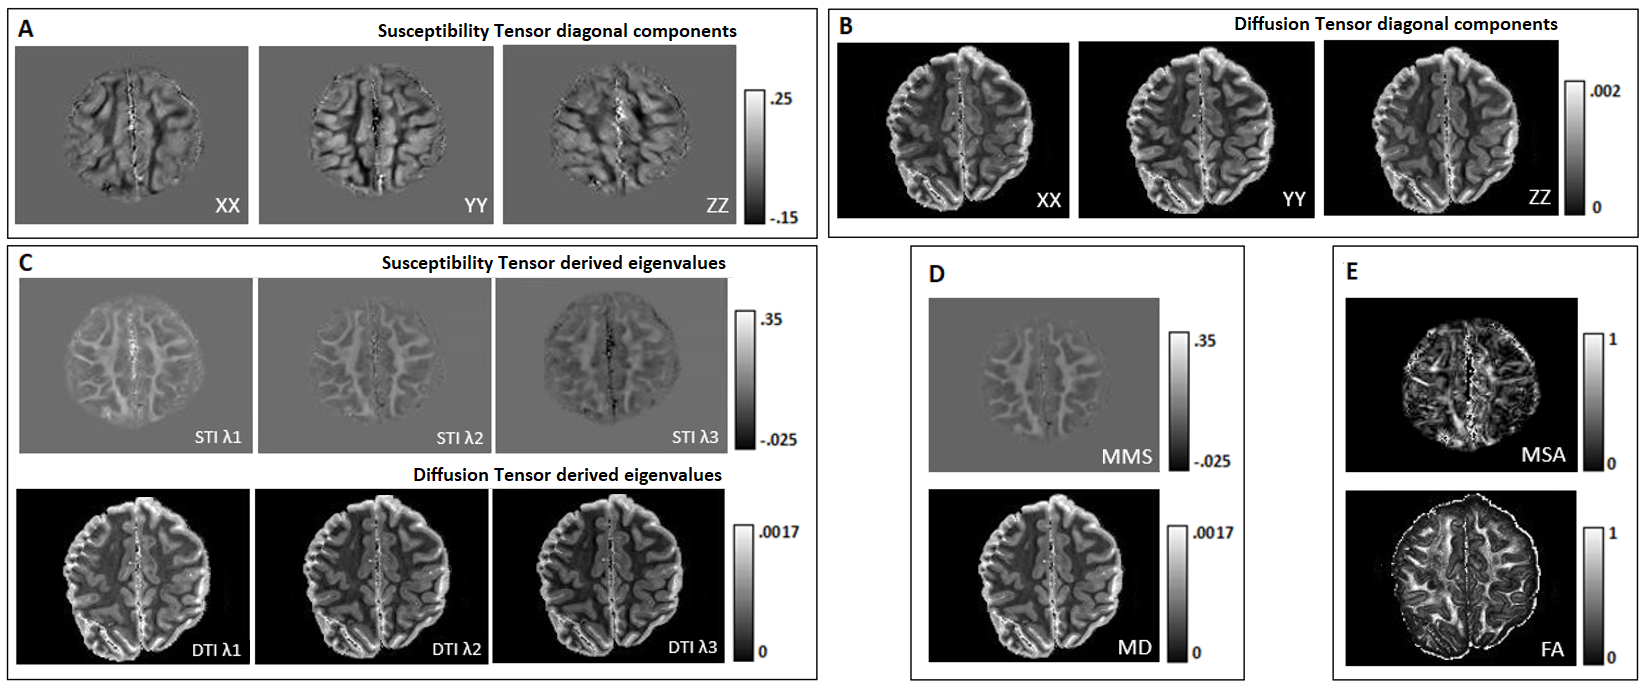
ME-FLASH MRI data were acquired with a 32-channel head coil from a post-mortem chimpanzee brain, on a Siemens MAGNETOM 7T scanner. 60 whole-brain volumes were obtained (0.8mm-isotropic, TE=4,15ms)7, with orientations calculated based on the bipolar electrostatic repulsion system, using MRTRIX8. ESPRiT-SVD was used for coil combination9,10. Each re-orientation phase volume was registered to a reference based on the transformation derived by the registration of corresponding magnitude volumes, using FMRIB-FSL11. From the same specimen, 2D ME-DW segmented EPI data were acquired on a Siemens Connectom 3T scanner with Gmax=300mT/m, 0.8mm-isotropic, TR=6105ms, TE=45.0,50.9,56.8,62.7,68.6 ms, b=5000s/mm2 ,60 directions for improved SNR reconstruction12. For registration of the DT and metrics to the reference STI volume, Elastix-Toolbox was used13.On the registered phase volumes, phase unwrapping was performed using the Laplacian method and background phase removal using V-SHARP5, to obtain tissue phase volumes. Field-to-source inversion and ST reconstruction was accomplished using the iLSQR method14,15. Processing the ST, we obtained eigenvectors and eigenvalues, mean susceptibility anisotropy (MSA) and mean magnetic susceptibility (MMS) maps5 (Fig. 1).
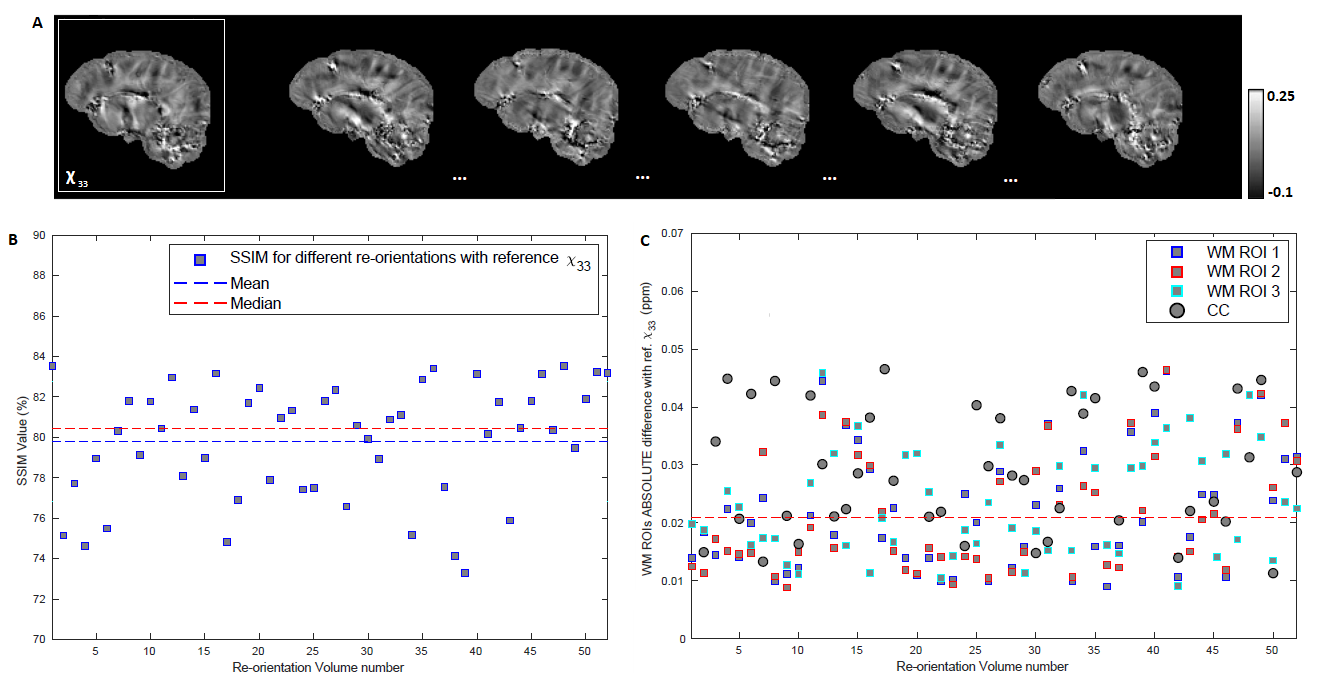
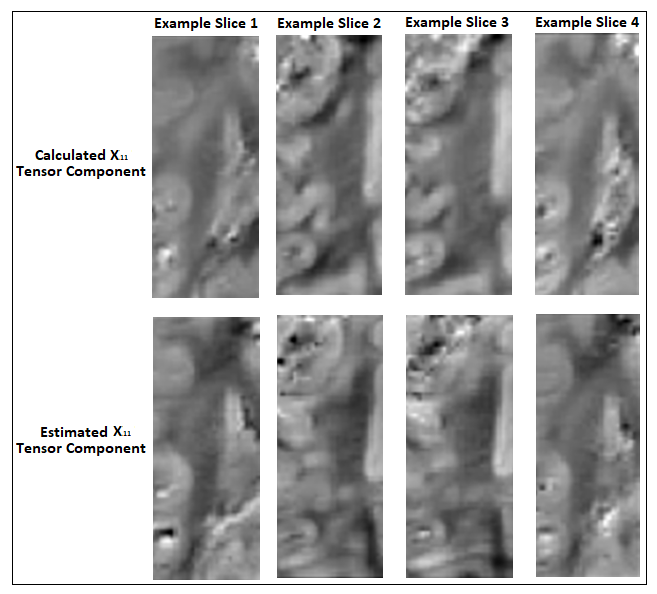
The correspondence between the tensors/derived metrics were visually assessed. The differences in susceptibility maps between STI reference (component χ33) and single-orientation maps of the reoriented specimen, were quantified by (i)the absolute of the mean differences in selected WM ROIs and (ii)the structural similarity index measure(SSIM) to assess the visual similarities on the full volume16. On a preliminary effort to estimate the ST voxel-wise based on DT and single-orientation data, a multi-layer sequential deep learning model was created in Keras. Training used as input the right hemisphere DT plus one selected single-orientation QSM, and as output the corresponding area of the ST (Fig. 1). Left hemisphere was used as test-set. The background and relatively isotropic areas were masked out beforehand using a FA-derived mask.
Results
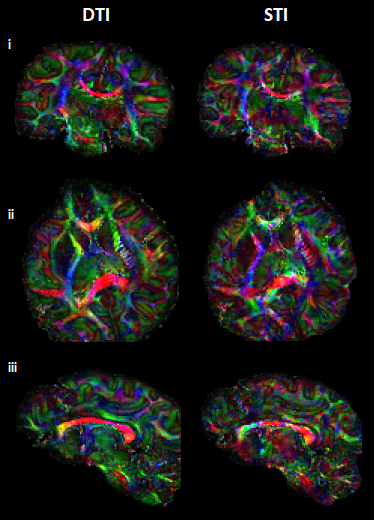
Visual inspection of ST and DT (Fig.2A-B) indicates significantly improved quality of the main ST components, using the high-angular dataset. DT and ST exhibited significant visual similarities. The eigenvalues from both tensors (Fig.2C-D-E) follow the same trend of λ1>λ2≈λ3, in WM, in accordance with previous publications5. MMS provides detailed quantitative characteristics, clear differentiation of GM/WM and exhibits obvious resemblance with MD. FA and MSA constitute quantifications of the voxel-anisotropy for diffusion and susceptibility, respectively. MSA shows more variability, compared to FA. Primary eigenvectors exhibit similar orientation characteristics in both methods, with need for further validation of STI-derived details (Fig.3).In Fig.4 we can observe the comparison between selected single-orientation QSM susceptibility estimates and the reference derived by the STI analysis. The absolute difference in WM ROIs fluctuates between 0.01-0.046 ppm (Mean: 0.022 ppm, Median: 0.021 ppm). The SSIM fluctuates between 73%-84% (mean: 79.7%, median:80.4%). The obtained results resemble former reported QSM-STI reference comparisons16.
As a limitation, the registration match was suboptimal between DT and ST volumes due to the need of separate acquisitions in different brain containers resulting in non-correctable transformations and limited voxel-to-voxel corresponding areas (i.e. small-inconsistent training set). Nevertheless, the preliminary results (Fig.5) are promising regarding an estimation of ST main components in WM parts.
Discussion
The ST calculated with the high-angular phase dataset is of unprecedented detail. Analysis shows qualitative spatial resemblance in diffusion and susceptibility anisotropy and primary eigenvectors. Deviations exist between the mean susceptibility calculated through STI and the single orientation QSM pointing to a residual inaccuracy of QSM data, which are typically obtained without consideration of orientation effects. The machine learning estimations show promising visual correspondence, however, with currently limited accuracy due to remaining registration issues. This limitation is addressed in ongoing work by using custom-fit 3D-printed individualized brain containers17,18.Acknowledgements
We would like to thank Evolution of Brain Connectivity (EBC) project, the Ministère de l’Enseignement Supérieur et de la Recherche Scientifique and the Ministère de Eaux et Fôrests in Côte d’Ivoire, and the Office Ivoirien des Parcs et Réserves for permitting the study, and the staff of the Tai Chimpanzee Project for their commitment. Special thanks to Fabian Leendertz and his group at the Robert Koch Institute for their support.
References
- Möller HE, Bossoni L, Connor JR, Crichton RR, Does MD, Ward RJ, Zecca L, Zucca FA, Ronen I. Iron, Myelin, and the Brain: Neuroimaging Meets Neurobiology. Trends Neurosci. 2019 Jun;42(6):384-401. doi: 10.1016/j.tins.2019.03.00
- Deistung A, Schweser F, Reichenbach JR. Overview of quantitative susceptibility mapping. NMR Biomed. 2017 Apr;30(4). doi: 10.1002/nbm.3569.
- Samuel Wharton, Richard Bowtell, Fiber orientation-dependent WM contrast in GE MRI, Proceedings of the National Academy of Sciences Nov 2012, 109 (45) 18559-18564; DOI: 10.1073/pnas.1211075109
- Liu C. Susceptibility tensor imaging. Magn Reson Med. 2010;63(6):1471-1477. doi:10.1002/mrm.22482
- Wei Li Chunlei Liu Timothy Q Duong , Peter C M van Zijl, Xu Li, Susceptibility tensor imaging (STI) of the brain, NMR Biomed,2017 Apr;30(4):10.1002/nbm.3540. doi: 10.1002/nbm.3540
- D.S. Tuch, T.G. Reese, M.R. Wiegell, N. Makris, J.W. Belliveau, V.J. Wedeen. High angular resolution diffusion imaging reveals intravoxel white matter fiber heterogeneity. Magn. Reson. Med. 2002; 48: 577-582.
- Su Y., An experimental set-up for orientation dependence MRI of post-mortem brain to study microstructure of white matter, KIT & MPI CBS, MSc Thesis, 2019
- Tournier, J.-D.; Smith, R. E.; Raffelt, D.; Tabbara, R.; Dhollander, T.; Pietsch, M.; Christiaens, D.; Jeurissen, B.; Yeh, C.-H. & Connelly, A. MRtrix3: A fast, flexible and open software framework for medical image processing and visualisation. NeuroImage, 2019, 202, 116137, doi: 10.1016/j.neuroimage.2019.116137
- Uecker, M., Lustig, M., . Estimating absolute-phase maps using ESPIRiT and virtual conjugate coils. Magn. Reson. Med., 2016, doi:10.1002/mrm.26191
- Bilgic, B., Polimeni, J.R., Wald, L.L., Setsompop, K., Automated tissue phase and QSM estimation from multichannel data, in: Proceedings of the ISMRM 24th Annual Meeting & Exhibition, 2016.
- M. Jenkinson, C.F. Beckmann, T.E. Behrens, M.W. Woolrich, S.M. Smith. FSL. NeuroImage, 2012, 62:782-90, doi: 10.1016/j.neuroimage.2011.09.015
- C. Eichner, M. Paquette, T. Mildner, T. Schlumm, K. Pléh, L. Samuni, C. Crockford, R.M. Wittig, C. Jäger, H.E. Möller, A.D. Friederici, A. Anwander. Increased sensitivity and signal-to-noise ratio in diffusion-weighted MRI using multi-echo acquisitions. NeuroImage, 2020; 221: 117172, https://doi.org/10.1016/j.neuroimage.2020.117172
- S. Klein, M. Staring, K. Murphy, M.A. Viergever, J.P.W. Pluim, "Elastix: a toolbox for intensity based medical image registration," IEEE Transactions on Medical Imaging, 2010; vol. 29, no. 1, pp. 196 - 205, doi: 10.1109/TMI.2009.2035616
- Li, W., Wu, B., & Liu, C., 5223 STI Suite : a Software Package for Quantitative Susceptibility Imaging. Proceedings of the ISMRM - Annual Meeting & Exhibition, 2014
- Bilgic B, Xie L, Dibb R, Langkammer C, Mutluay A, Ye H, Polimeni JR, Augustinack J, Liu C, Wald LL, Setsompop K. Rapid multi-orientation quantitative susceptibility mapping. Neuroimage. 2016 Jan 15;125:1131-1141. doi: 10.1016/j.neuroimage.2015.08.015.
- Langkammer C, Schweser F, Shmueli K, Kames C, Li X, Guo L, Milovic C, Kim J, Wei H, Bredies K, Buch S, Guo Y, Liu Z, Meineke J, Rauscher A, Marques JP, Bilgic B. Quantitative susceptibility mapping: Report from the 2016 reconstruction challenge. Magn Reson Med. 2018;79(3):1661-1673. doi: 10.1002/mrm.26830
- J.R. Guy, P. Sati, E. Leibovitch, Steven Jacobson, A.C. Silva, D.S. Reich. Custom-fit 3D-printed brain holders for comparison of histology with MRI in marmosets. J. Neurosci. Meth. 2016; 257: 55-63. 18, doi: 10.1016/j.jneumeth.2015.09.002
- A. Alkemade, K. Pine, E. Kirilina, M.C. Keuken, M.J. Mulder, R. Balesar, J.M Groot, R.L.A.W. Bleys, R. Trampel, N. Weiskopf, A. Herrler, H.E. Möller, P.-L. Bazin, B.U. Forstmann. 7 Tesla MRI followed by histological 3D reconstructions in whole-brain specimens. Front. Neuroanat. 2020; 14: 536838, https://doi.org/10.3389/fnana.2020.536838
Figures
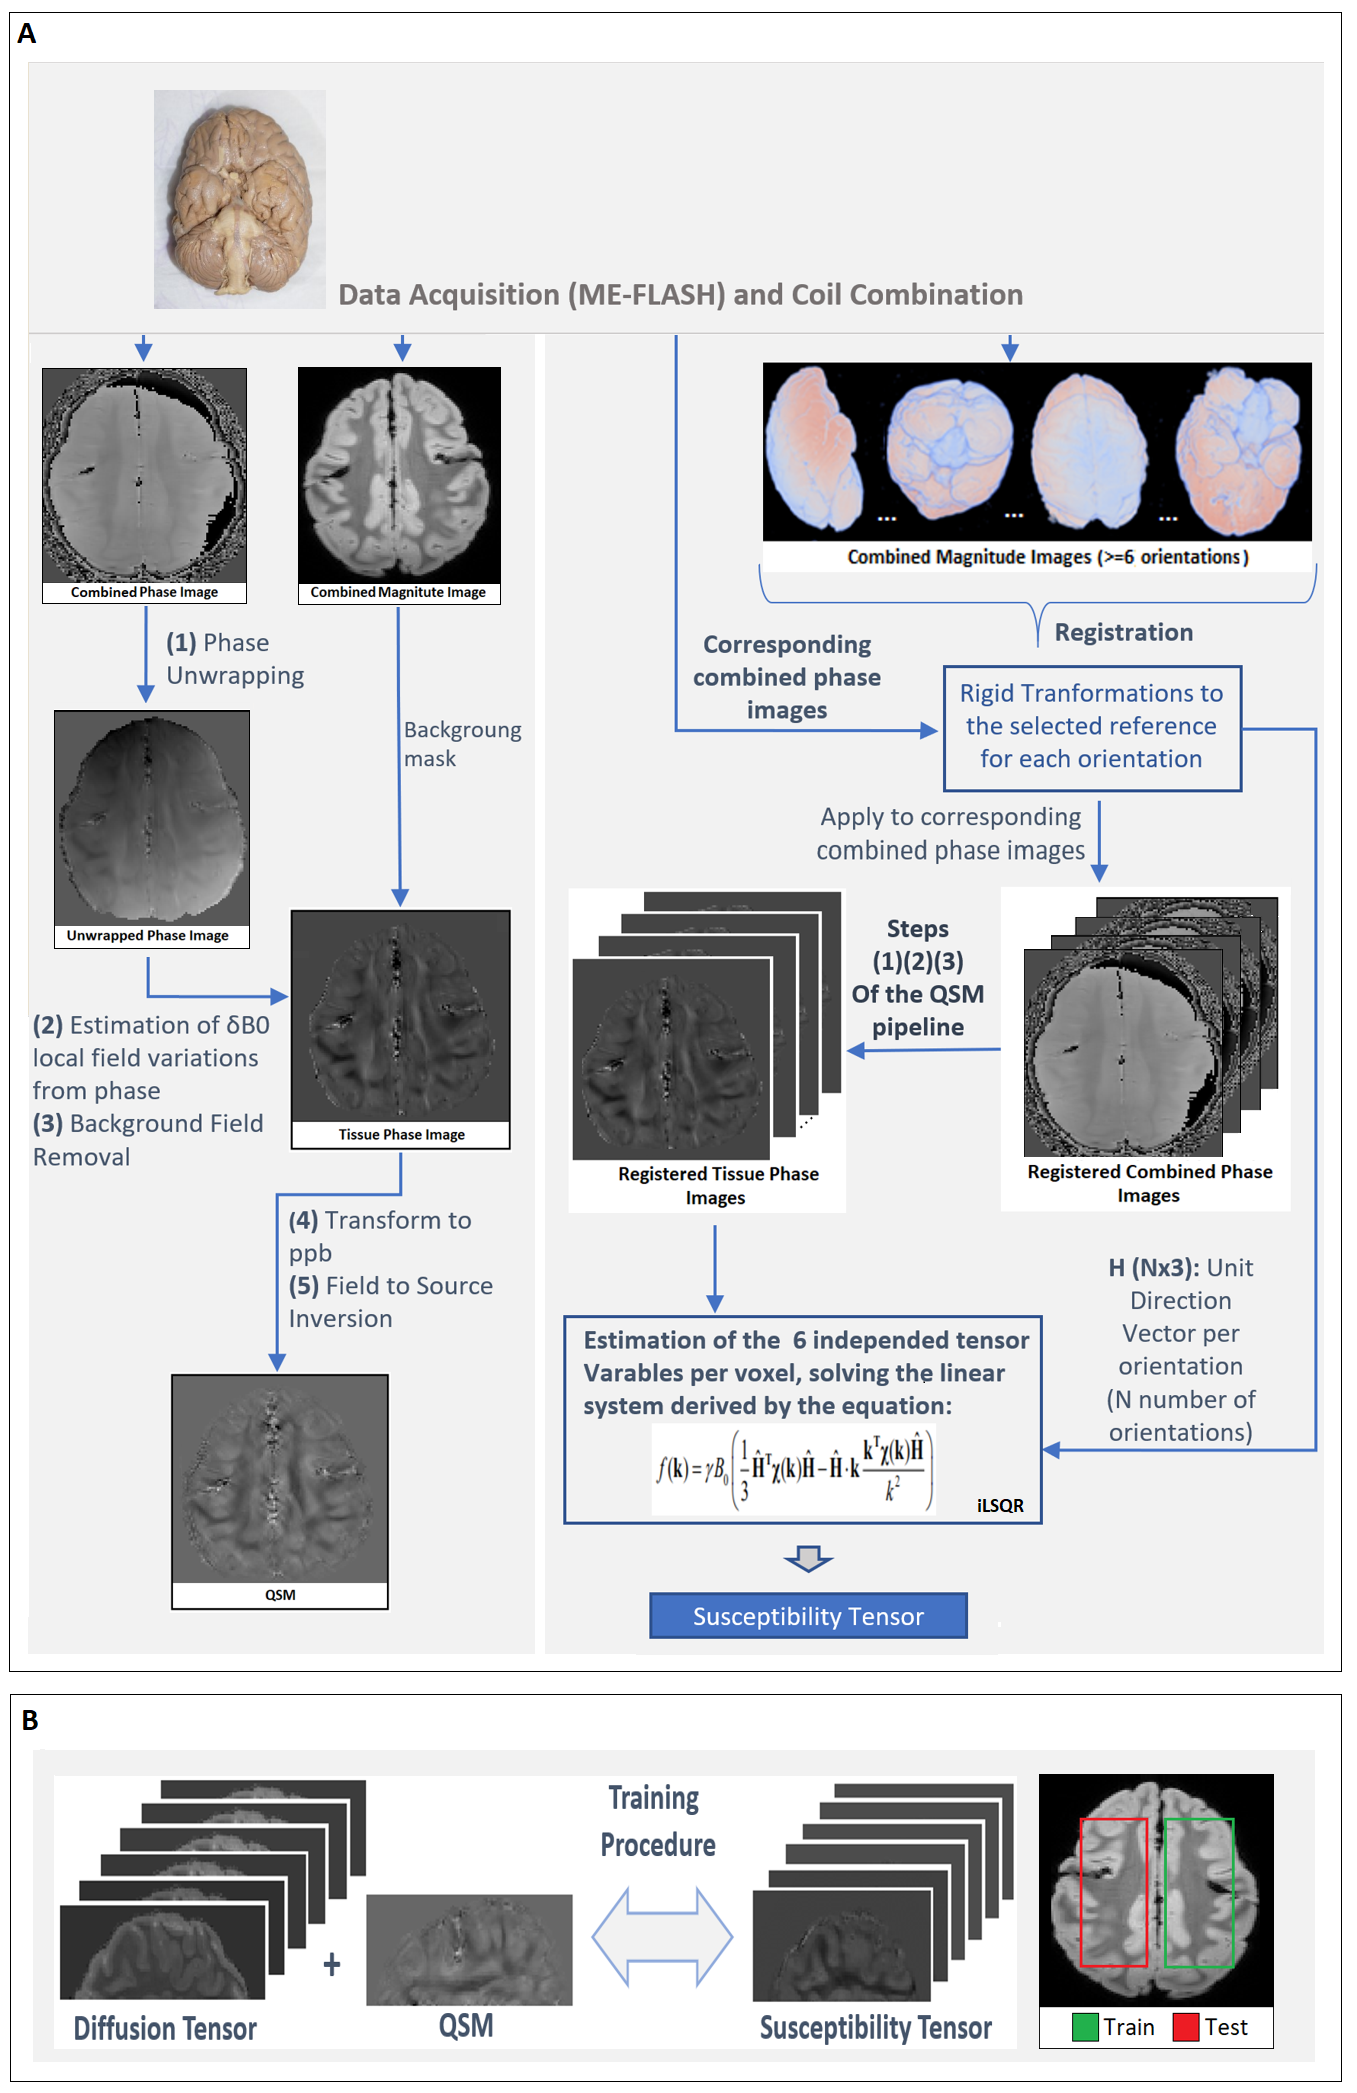
Figure 1. (A) Schematic of the QSM and STI pipelines. The brain used in for the data acquisitions of this abstract comes from a wild, female Chimpanzee (Pan troglodytes verus) named “Emma”, 6 years old, from Tai National Forest, Ivory Coast, West Africa. Cause of death was an attack by another group of Chimpanzees. (B) The general pipeline used for training of the machine learning model.