3846
On the effect of fat spectrum complexity in Dixon MR Fingerprinting1Department of Diagnostic and Interventional Radiology, School of Medicine, Technical University of Munich, Munich, Germany, 2Philips Research Lab, Hamburg, Germany, 3Philips Healthcare, Hamburg, Germany, 4Department of Diagnostic and Interventional Neuroradiology, Technical University of Munich, Munich, Germany
Synopsis
Dixon Magnetic Resonance Fingerprinting (Dixon-MRF) has been emerging for achieving efficient fat suppression in body applications of MRF. Fat quantification using traditional Dixon imaging relies on a pre-calibrated proton density fat spectrum. The fat spectrum is known to be composed of different fat peaks, which have different relaxation times and are affected by J-coupling modulations. Existing Dixon-MRF methods perform water-fat separation assuming a constant pre-calibrated fat spectrum and not accounting how the complex fat spectrum varies along the MRF flip angle train. The present work proposes a framework to characterize the effect of fat spectrum complexity in Dixon-MRF.
Purpose:
Magnetic resonance fingerprinting (MRF) enables the simultaneous acquisition of several quantitative parameters by varying acquisition parameters during the pulse sequence train(1). MRF has been increasingly used in applications outside the brain, including the prostate(2), the abdomen(3),the myocardium(4) and the breast(5). Spiral trajectories are commonly used in MRF acquisitions because of their sampling speed and large k‐space coverage. However, for the application of spiral trajectories in the body, MRF acquisitions require efficient fat suppression. Dixon Magnetic Resonance Fingerprinting (Dixon-MRF) enables water-fat separation to remove the fat-induced blurring in spiral imaging(6,7), to remove bias in water relaxometry(8,9) and to quantify the tissue fat fraction(10). Fat quantification using traditional Dixon imaging relies on a pre-calibrated proton density fat spectrum(11). However, the fat spectrum is known to be composed of different fat peaks which have different relaxation times and are affected by J-coupling modulations. Existing Dixon MRF methods perform water-fat separation assuming a constant pre-calibrated proton density (PD)-weighted fat spectrum and not accounting how the complex fat spectrum varies along the MRF flip angle train. The present work proposes a framework to characterize the effect of fat spectrum complexity in Dixon-MRF, relying on a fully-sampled multi-echo Cartesian acquisition using an MRF flip angle train excitation.Methods:
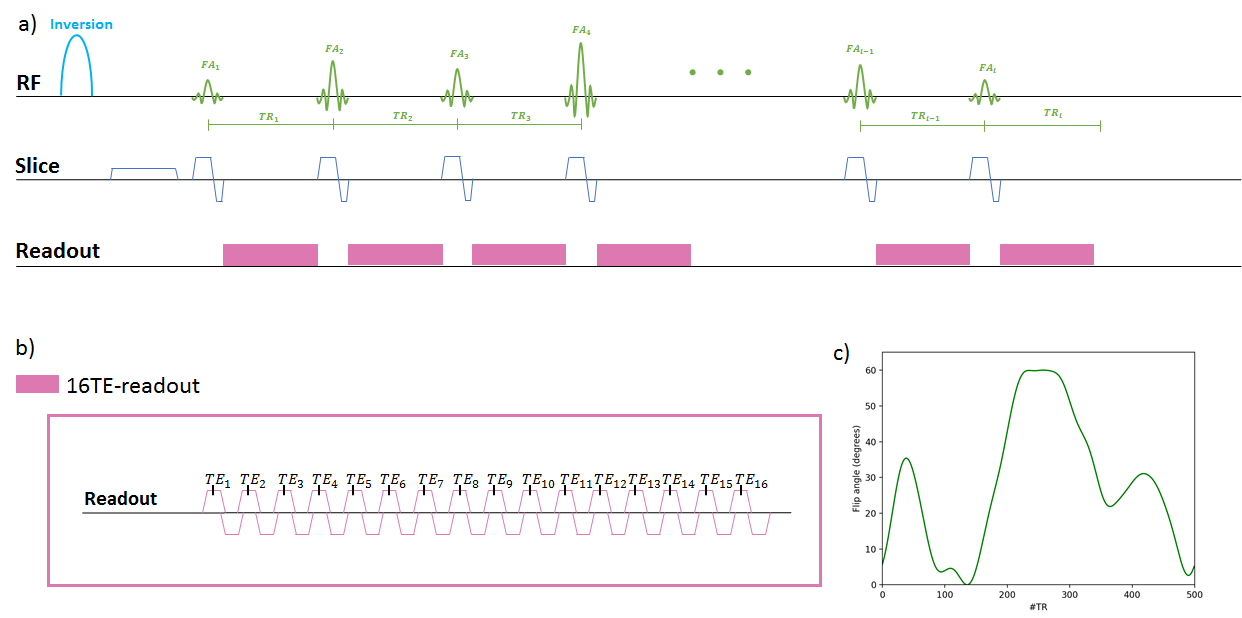
Fully-sampled multi-echo Cartesian MRF pulse sequenceA spoiled gradient echo MRF sequence(12)(Figure 1a) is the basis for the multi-echo acquisition and was extended by reading 16-echoes with a monopolar readout gradient (Figure 1b). The MRF flip angle train varies smoothly along all TRs (40ms) (Figure 1c). The same 2D-image is acquired for every element of the MRF flip angle train ($$$MRF_i$$$) and for every echo time ($$$TE_n$$$).
Signal modelling theory
Assuming a fat spectrum with $$$ P $$$ peaks and a single $$$T_2^*$$$ decay, the signal of a fully-sampled multi-echo Cartesian MRF acquisition at $$$ TE_n$$$ and after one $$$ MRF_i$$$ is:
$$s\left(TE_{n},MRF_{i}\right)=W_{0}e^{i\phi_{W}}\psi\left(MRF_{i},T_{1 W},T_{2 W}\right)e^{\left(i\omega_{W}-R_{W}\right)TE_{n}}+\sum_{p=1}^{P}\alpha_{p}F_{0}e^{i\phi_{F}}_{0}\psi\left(MRF_{i},T_{1p},T_{2p}\right)e^{\left(i\omega_{p}-R_{p}\right)TE_{n}}$$
where $$$W_0$$$ and $$$F_0$$$ are the water and fat proton density signals.
Calibration of MRF-weighted fat spectrum
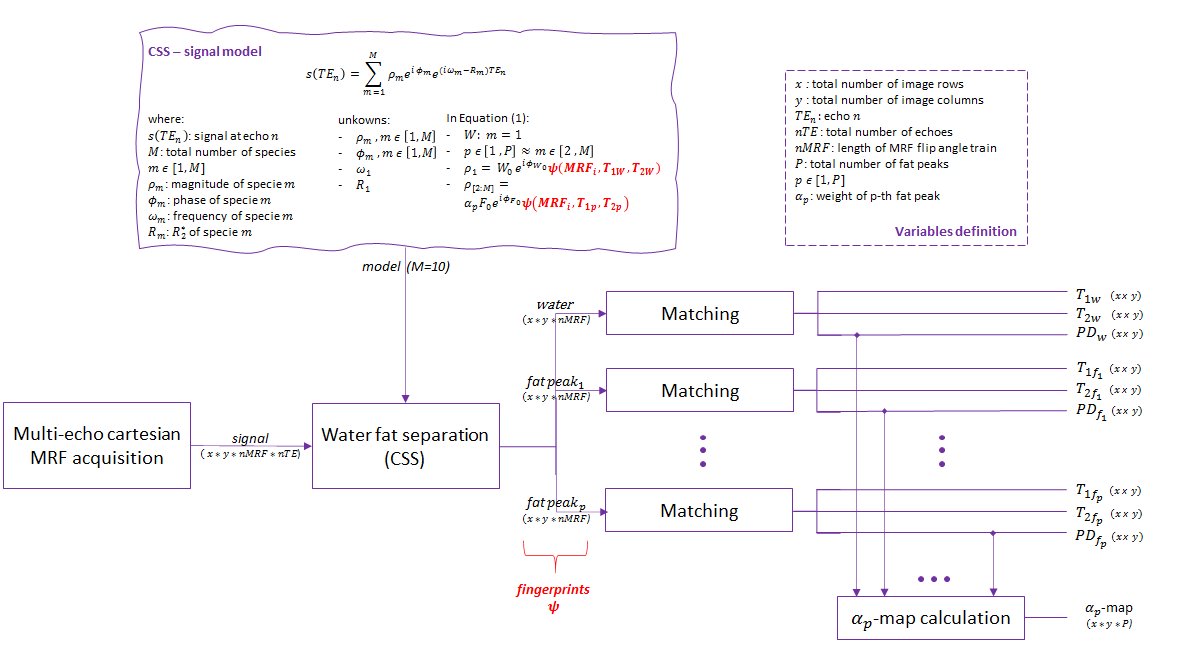
The framework (Figure 2) processes fully-sampled multi-echo Cartesian MRF-data and calculates maps of $$$T_1$$$, $$$T_2$$$ for water and for all fat peaks and maps for the relative fat peak weights $$$\alpha_p$$$.The multi-echo MRF signal is processed for water-fat separation using the chemical species separation (CSS) algorithm(13). CSS allows to define the MRF signal as the sum of 10 chemical species: water and 9 fat peaks at 0.90, 1.30, 1.60, 2.02, 2.24, 2.75, 4.20, 5.19 and 5.29ppm, corresponding to subcutaneous fat(14). In contrast to the PD-weighted fat spectrum approach, the proposed MRF-weighted fat spectrum approach defines the fat peaks as independent species, each with its own magnitude and phase, to account the complex fat spectrum variation across all $$$MRF_i$$$ . Since their frequencies are known and a single $$$R_2^*$$$ is considered, the problem is then solved for in total 22 unknowns(10 magnitudes, 10 phases, frequency of water and $$$R_2^*$$$). The fingerprints, $$$\psi$$$ , per species across all $$$MRF_i$$$ are assembled from the CSS results.
As a next step, every $$$\psi$$$ is matched to obtain its $$$T_1$$$, $$$T_2$$$ and $$$PD$$$ values which will form the corresponding maps of the acquired 2D-image. A dictionary was previously computed simulating signals based on the described sequence and considering $$$T_1$$$=[50:5:1700]ms and $$$T_2$$$=[10:1:300]ms.Finally, the $$$\alpha_p$$$ map of the MRF-weighted fat spectrum is calculated from the PD-maps of all fat peaks according to Eq.(2).
$$\alpha_{p}(x,y)=\frac{PD_{p}(x,y)}{\sum_{l=1}^{9}PD_{l}(x,y)}$$
Dictionary signals simulations
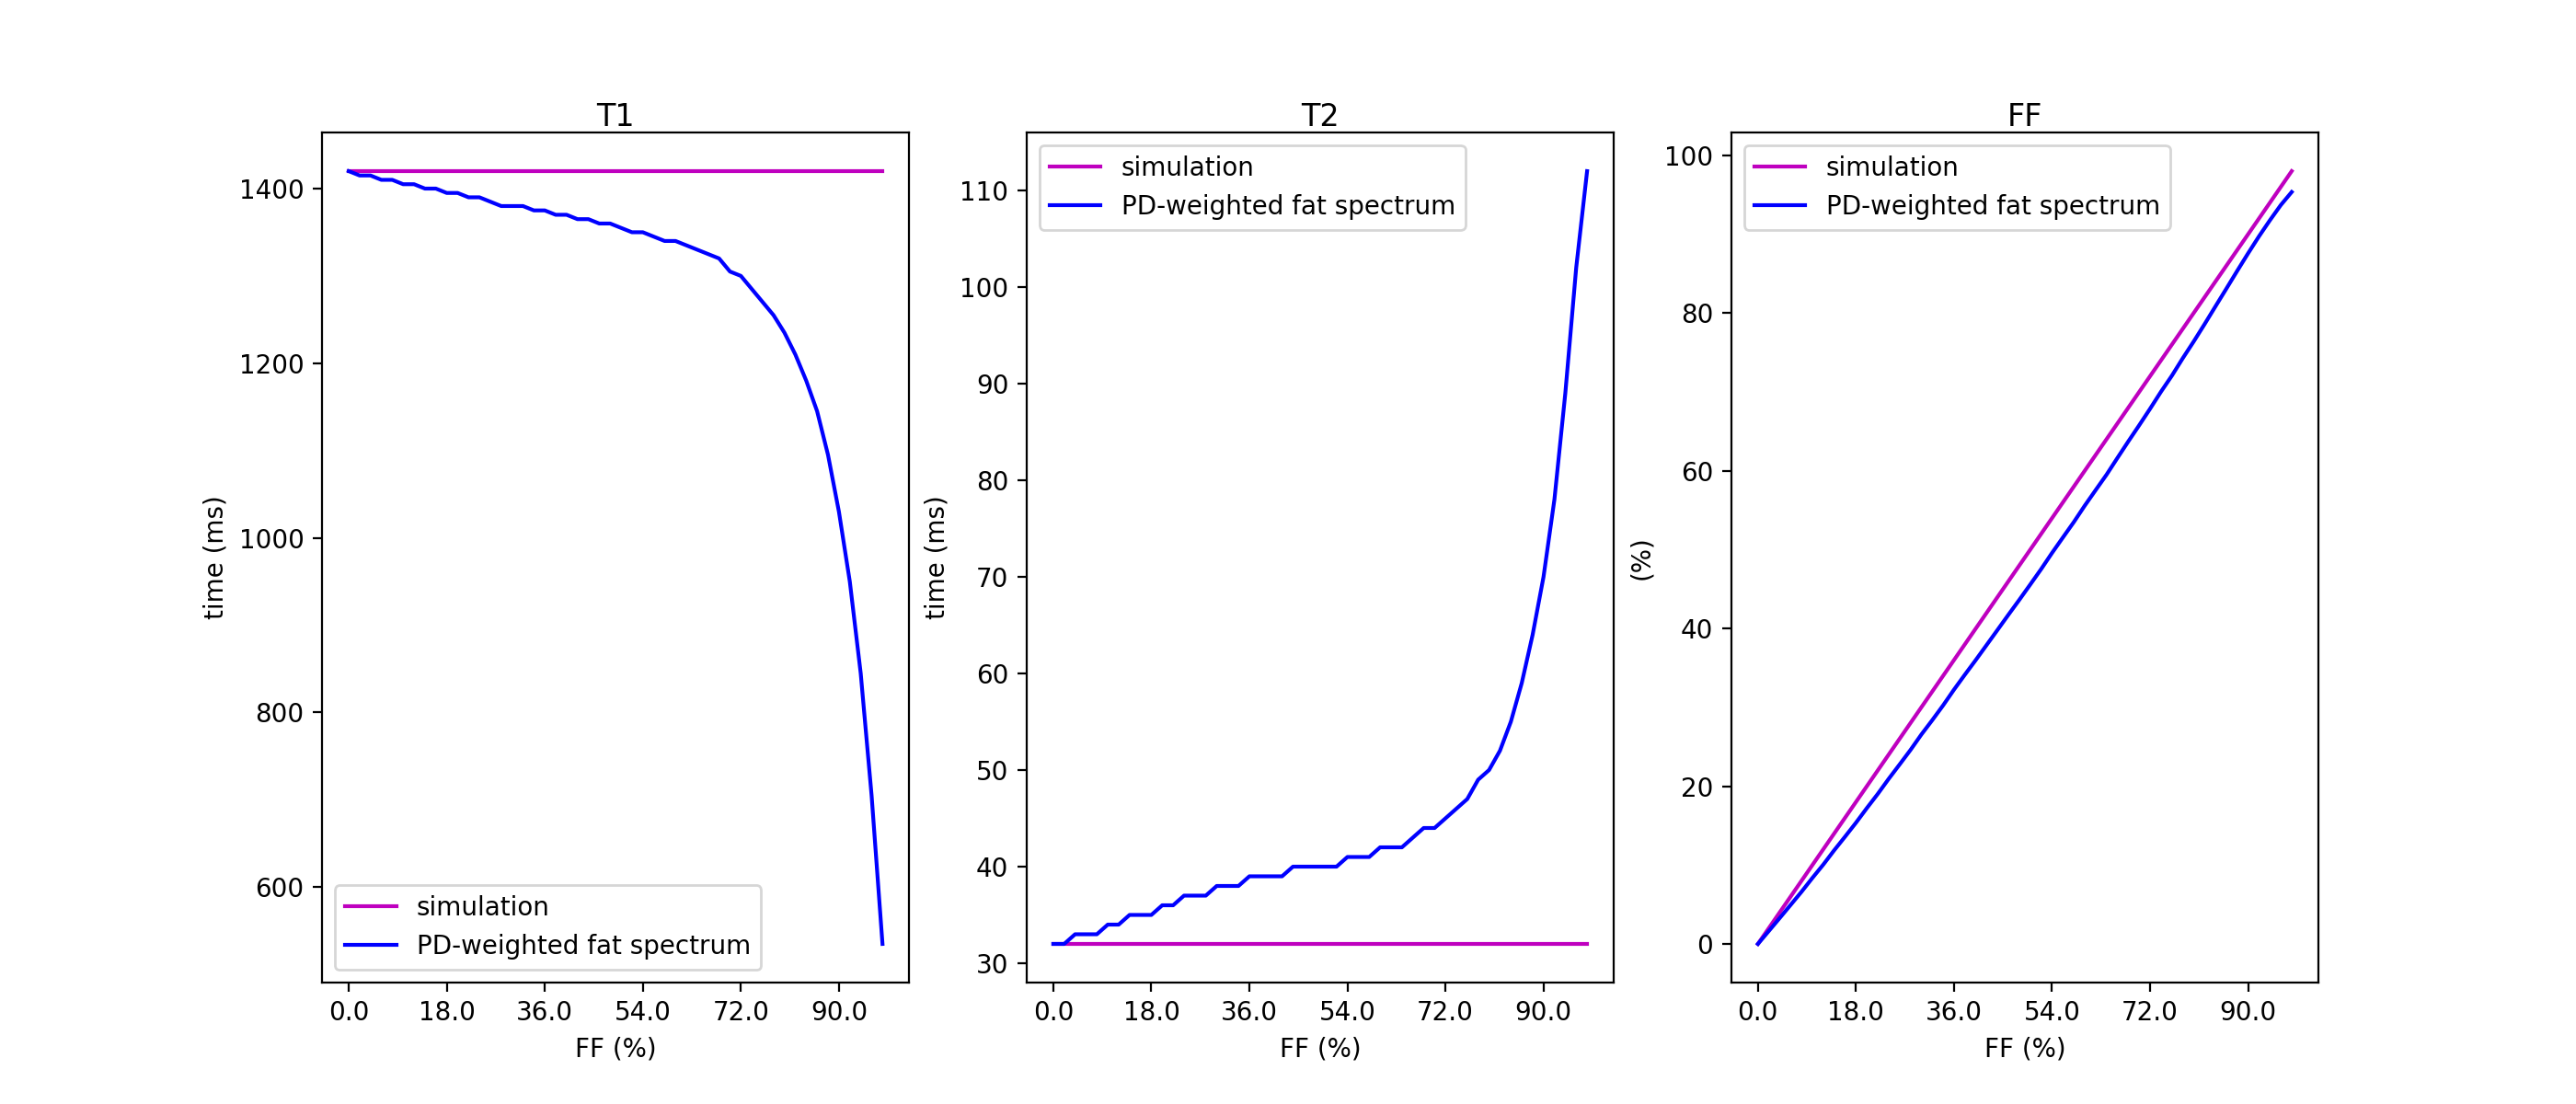
Signals with different fat fractions were simulated for evaluating the bias induced by using the the PD-weighted fat spectrum on synthetic data generated using the MRF-weighted fat spectrum. The fingerprints of the fat peaks and the $$$\alpha_p$$$ were averaged from a fat-ROI and water was represented by the dictionary entry with $$$T_1=1420$$$ms and $$$T_2=32$$$ms. Following Eq.(1), a 6-echoes signal is simulated and processed by using the PD-weighted fat spectrum. Dictionary matching is performed on the water and fat images for calculation of $$$T_1, T_2$$$ and $$$FF$$$.
In-vivo data simulations
The signal from a muscle-, a fat-ROI and the combination of both allow to simulate different FF from in-vivo data. Only 6 echoes were considered for analysing the bias induced by using the PD-weighted fat spectrum.
Results:
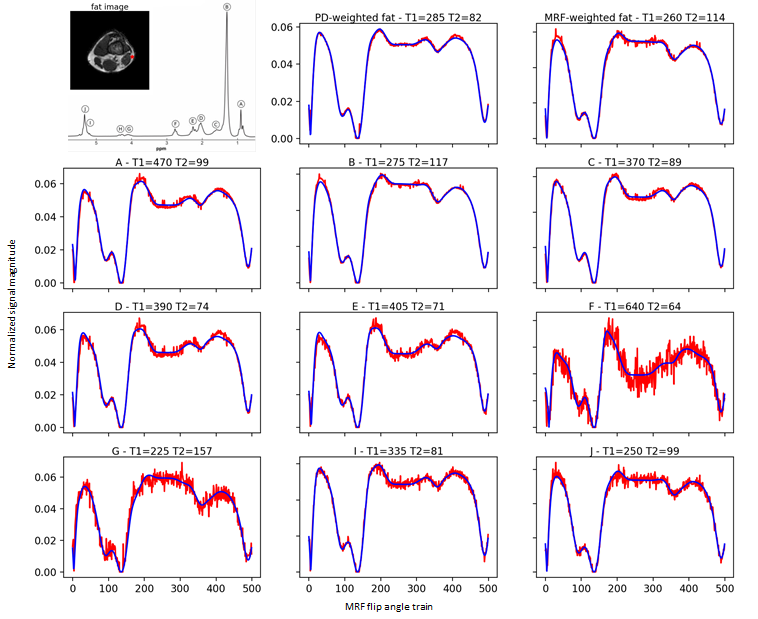
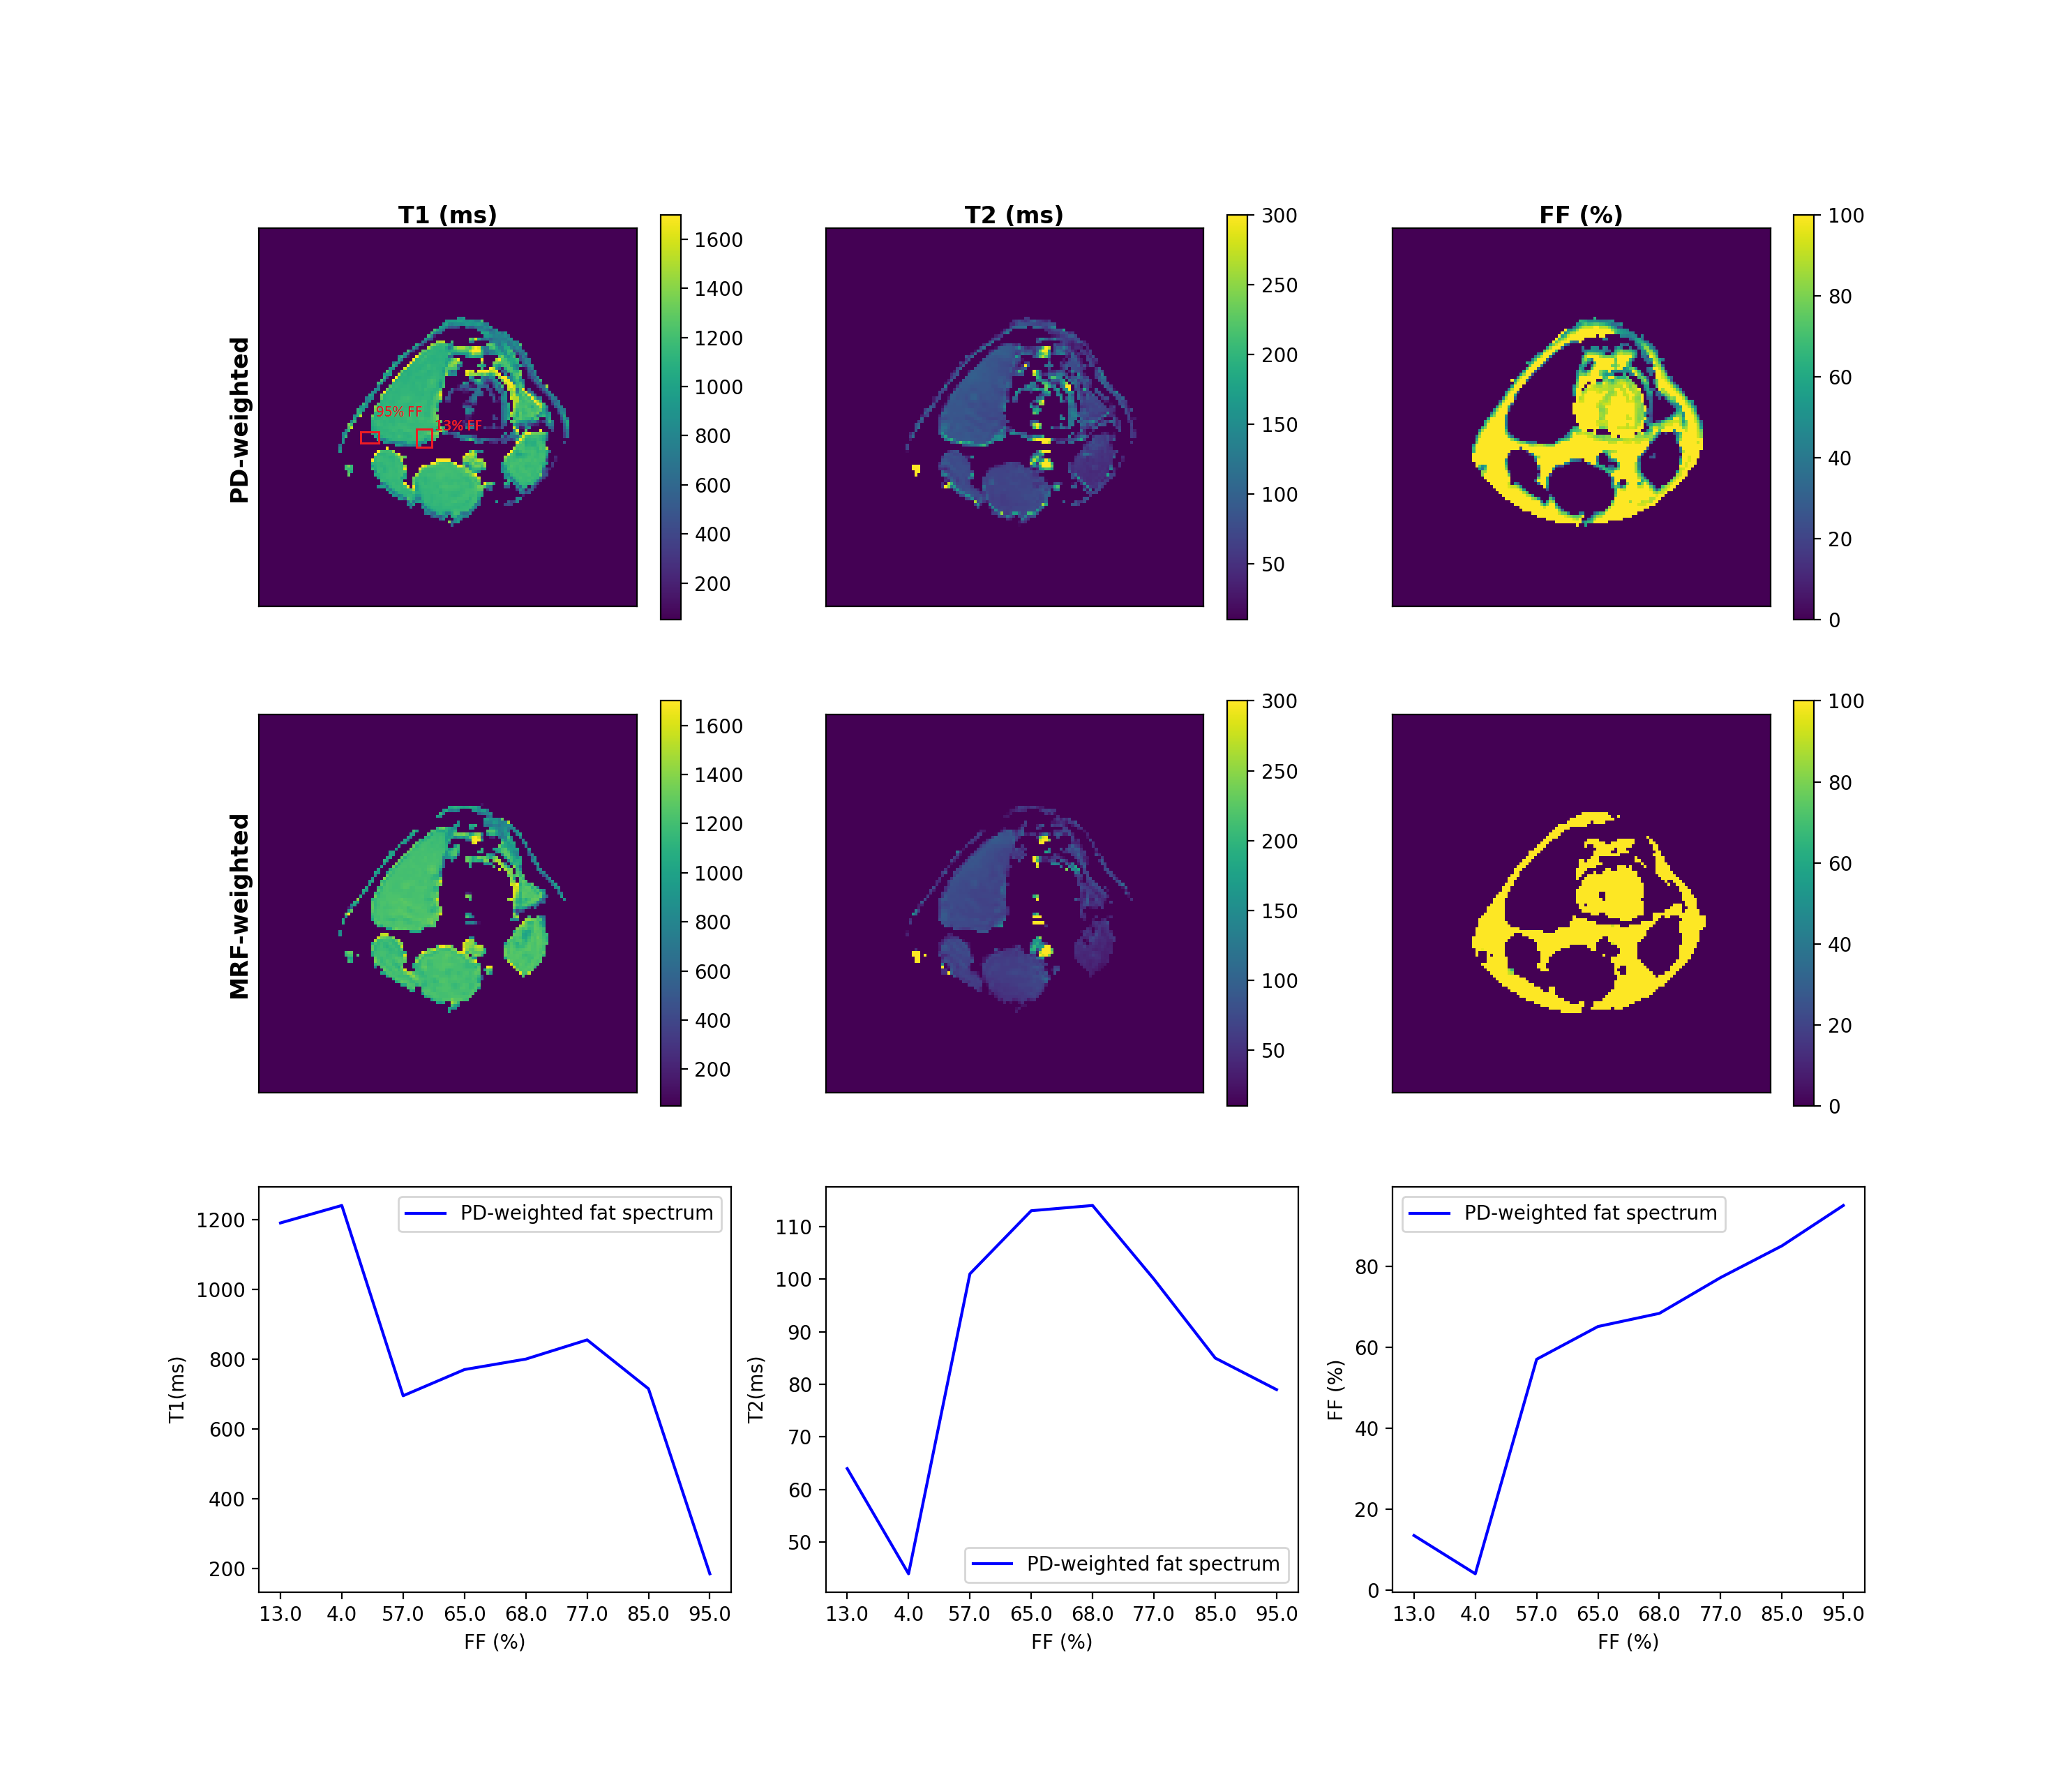
For a fat-pixel, every fat peak matches to a unique fingerprint (Figure 3). When a signal simulated from those fingerprints was processed using the PD-weighted fat spectrum, the $$$T_1$$$ of water was underestimated while the $$$T_2$$$ was overestimated along FF (Figure 4).In-vivo simulations of partial voluming effects between muscle and fat show again the influence of the MRF flip angle train in the water-fat separation performance (Figure 5). The in-vivo water T2 maps using the PD-weighted fat spectrum show overestimation at the border between muscle and fat, which is an area with intermediate fat fraction.Discussion & Conclusion:
The present work shows the effect of the fat spectrum complexity in Dixon MRF and proposes a framework to extract an MRF-weighted fat spectrum. When the pre-calibrated PD-weighted fat spectrum is used, the fat spectrum complexity is ignored, the FF bias is small, but the and water relaxation times show a bias which increases as the FF increases. Therefore, a strategy incorporating the MRF-weighted fat spectrum in the Dixon-MRF processing needs to be developed.Acknowledgements
The present research was supported by Philips Healthcare.References
1. Ma D, Gulani V, Seiberlich N, Liu K, Sunshine JL, Duerk JL, Griswold MA. Magnetic resonance fingerprinting. Nature 2013;495(7440):187-192.
2. Yu AC, Badve C, Ponsky LE, Pahwa S, Dastmalchian S, Rogers M, Jiang Y, Margevicius S, Schluchter M, Tabayoyong W, Abouassaly R, McGivney D, Griswold MA, Gulani V. Development of a Combined MR Fingerprinting and Diffusion Examination for Prostate Cancer. Radiology 2017;283(3):729-738.
3. Chen Y, Jiang Y, Pahwa S, Ma D, Lu L, Twieg MD, Wright KL, Seiberlich N, Griswold MA, Gulani V. MR Fingerprinting for Rapid Quantitative Abdominal Imaging. Radiology 2016;279(1):278-286.
4. Jaubert O, Cruz G, Bustin A, Schneider T, Lavin B, Koken P, Hajhosseiny R, Doneva M, Rueckert D, Botnar RM, Prieto C. Water-fat Dixon cardiac magnetic resonance fingerprinting. Magn Reson Med 2020;83(6):2107-2123.
5. Panda A, Chen Y, Ropella-Panagis K, Ghodasara S, Stopchinski M, Seyfried N, Wright K, Seiberlich N, Griswold M, Gulani V. Repeatability and reproducibility of 3D MR fingerprinting relaxometry measurements in normal breast tissue. J Magn Reson Imaging 2019;50(4):1133-1143.
6. Koolstra K, Webb AG, Veeger TTJ, Kan HE, Koken P, Bornert P. Water-fat separation in spiral magnetic resonance fingerprinting for high temporal resolution tissue relaxation time quantification in muscle. Magn Reson Med 2020;84(2):646-662.
7. Nolte T, Gross-Weege N, Doneva M, Koken P, Elevelt A, Truhn D, Kuhl C, Schulz V. Spiral blurring correction with water-fat separation for magnetic resonance fingerprinting in the breast. Magn Reson Med 2020;83(4):1192-1207.
8. Ostenson J, Damon BM, Welch EB. MR fingerprinting with simultaneous T1, T2, and fat signal fraction estimation with integrated B0 correction reduces bias in water T1 and T2 estimates. Magn Reson Imaging 2019;60:7-19.
9. Marty B, Carlier PG. MR fingerprinting for water T1 and fat fraction quantification in fat infiltrated skeletal muscles. Magn Reson Med 2020;83(2):621-634.
10. Jaubert O, Arrieta C, Cruz G, Bustin A, Schneider T, Georgiopoulos G, Masci PG, Sing-Long C, Botnar RM, Prieto C. Multi-parametric liver tissue characterization using MR fingerprinting: Simultaneous T1 , T2 , T2 *, and fat fraction mapping. Magn Reson Med 2020;84(5):2625-2635.
11. Yu H, Shimakawa A, McKenzie CA, Brodsky E, Brittain JH, Reeder SB. Multiecho water-fat separation and simultaneous R2* estimation with multifrequency fat spectrum modeling. Magn Reson Med 2008;60(5):1122-1134.
12. Jiang Y, Ma D, Seiberlich N, Gulani V, Griswold MA. MR fingerprinting using fast imaging with steady state precession (FISP) with spiral readout. Magn Reson Med 2015;74(6):1621-1631.
13. Diefenbach MN, Liu C, Karampinos DC. Generalized parameter estimation in multi-echo gradient-echo-based chemical species separation. Quant Imaging Med Surg 2020;10(3):554-567.
14. Ren J, Dimitrov I, Sherry AD, Malloy CR. Composition of adipose tissue and marrow fat in humans by 1H NMR at 7 Tesla. J Lipid Res 2008;49(9):2055-2062.
Figures