3769
Mobile application for in vivo MR spectroscopy: Pocket MRS1Department of Biomedical Engineering, Columbia University, New York City, NY, United States, 2Department of Radiology, Columbia University Medical Center, New York, NY, United States
Synopsis
Pocket MRS is a mobile application that offers simple and easy access to simulated spectra from human brain and its detailed analysis. Spectra available from 0 to 300 ms TE were simulated using realistic quantum mechanical density operator simulations, and scaled using known concentration, T1 and T2 values across 19 different metabolites and a sum of 10 macromolecules. Spectra can be manipulated with respect to echo time, magnetic field quality and noise levels, providing quick and convenient visualization of the impact of typical experimental conditions on spectral appearance.
Motivation
The successful application of in vivo magnetic resonance spectroscopy (MRS) methods requires the understanding of its principles, yet due to their complexity, MRS spectra and the underlying metabolic information can be difficult to grasp. Moreover, many spectra acquired with MRS consist of multiple overlapping signals, which are hard to disentangle without proper prior knowledge.Today, these tasks are answered by specialized software running on desktop computers. Although these software packages are irreplaceable when it comes to spectral analysis and quantification, they are not suitable for on-the-fly visual investigation of spectra. Here we employ the computational power of currently available smartphones, i.e., mobile computers, to visualize and manipulate simulated spectra to resemble proton (1H) MR spectra measure in vivo.
The motivation to develop an interactive and accessible tool for MRS was driven by situations in the scanner control room, class room or when viewing spectra from the PACS system, when, for example, chemical shifts, T2 relaxation and effects of J-evolution for a chemical compound needed to be explained. A visual comparison of the spectrum from Pocket MRS to the spectrum at hand can provide deep and convenient insight into the presence, absence or shape of particular peaks of interest across customizable echo time, linewidth and noise level.
The proposed MRS mobile application (app), Pocket MRS, was designed to be a fast, interactive and educational tool for students, medical professionals, researchers and anybody else engaged in the field of in vivo MRS.
Software Description
The spectra are based on simulations of typical spin-echo based acquisition performed in MAgnetic Resonance Spectrum Simulator (MARSS)1,2 for brain at 3 T. 19 brain metabolites and macromolecules were simulated from 0 to 300 ms TE with TR of 2 s, literature T1 and T2 relaxation times3–8 and concentrations5,9 in vivo at 3 T, and measured J-coupling constants in case of metabolites10,11. Macromolecule signal was treated as the sum of 10 individual macromolecule resonances. All signals were exponentially line broadened by $$$ (\frac{1}{\pi T_{2,m}}) $$$ where $$$ T_{2,m} $$$ is the T2 value for the particular metabolite, and macromolecules used previously measured linewidths4.Data is stored in memory as free induction decays; hence no simulations are required on the fly. Signal processing is performed by using sliders or other controls on the display. The spectra can then be easily manipulated with respect to the static magnetic field (B0) homogeneity and noise levels, providing quick and convenient visualization of the impact of typical experimental conditions on spectral appearance. This enables real-time adjustment of spectral parameters that can take minutes or longer to simulate on a desktop computer. Current version of the app was developed for Apple iOS 14.2.
The app consists of several tools for easy identification of metabolites:
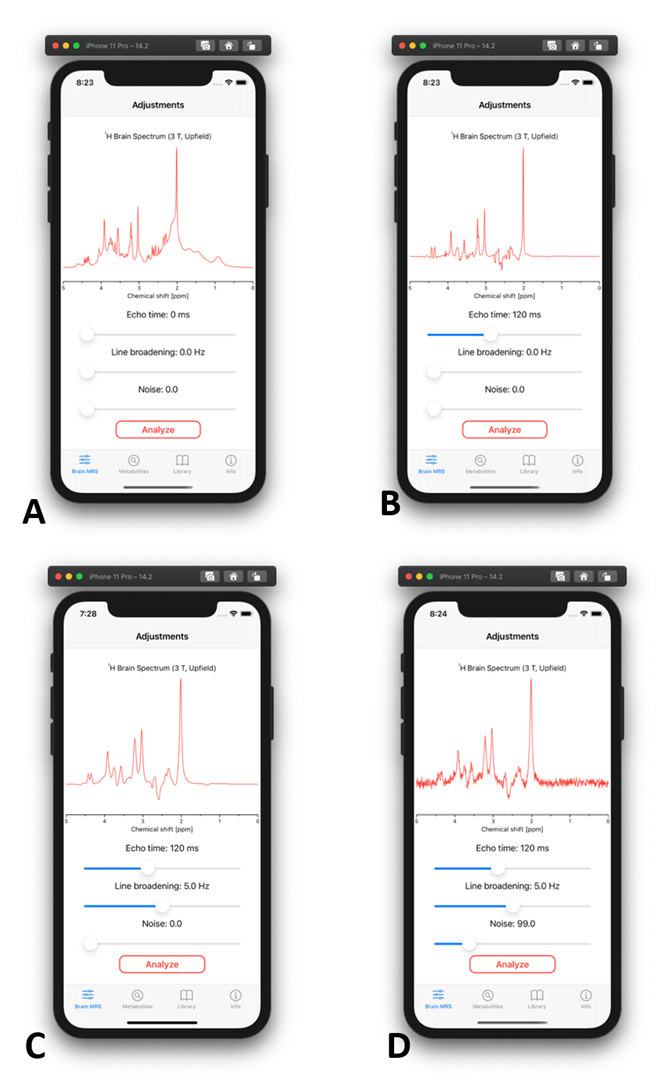
- Brain MRS - Adjustments: Current version contains simulated spectra with ideal spin echo sequence brain metabolites at 3 T (Fig. 1A). This tool allows to adjust three parameters: echo time (TE), line broadening and noise levels. All three parameters can be changed with sliders and the spectrum will update in real-time. User can create realistic spectrum with combination of different TE (Fig. 1B), line broadening (Fig. 1C) and noise levels (Fig. 1D). Because spectra already contain natural linewidth broadening due to T2 relaxation, a broadening of 0 Hz reflects a perfectly homogenous magnetic field B0, not 0 Hz linewidths of metabolites.
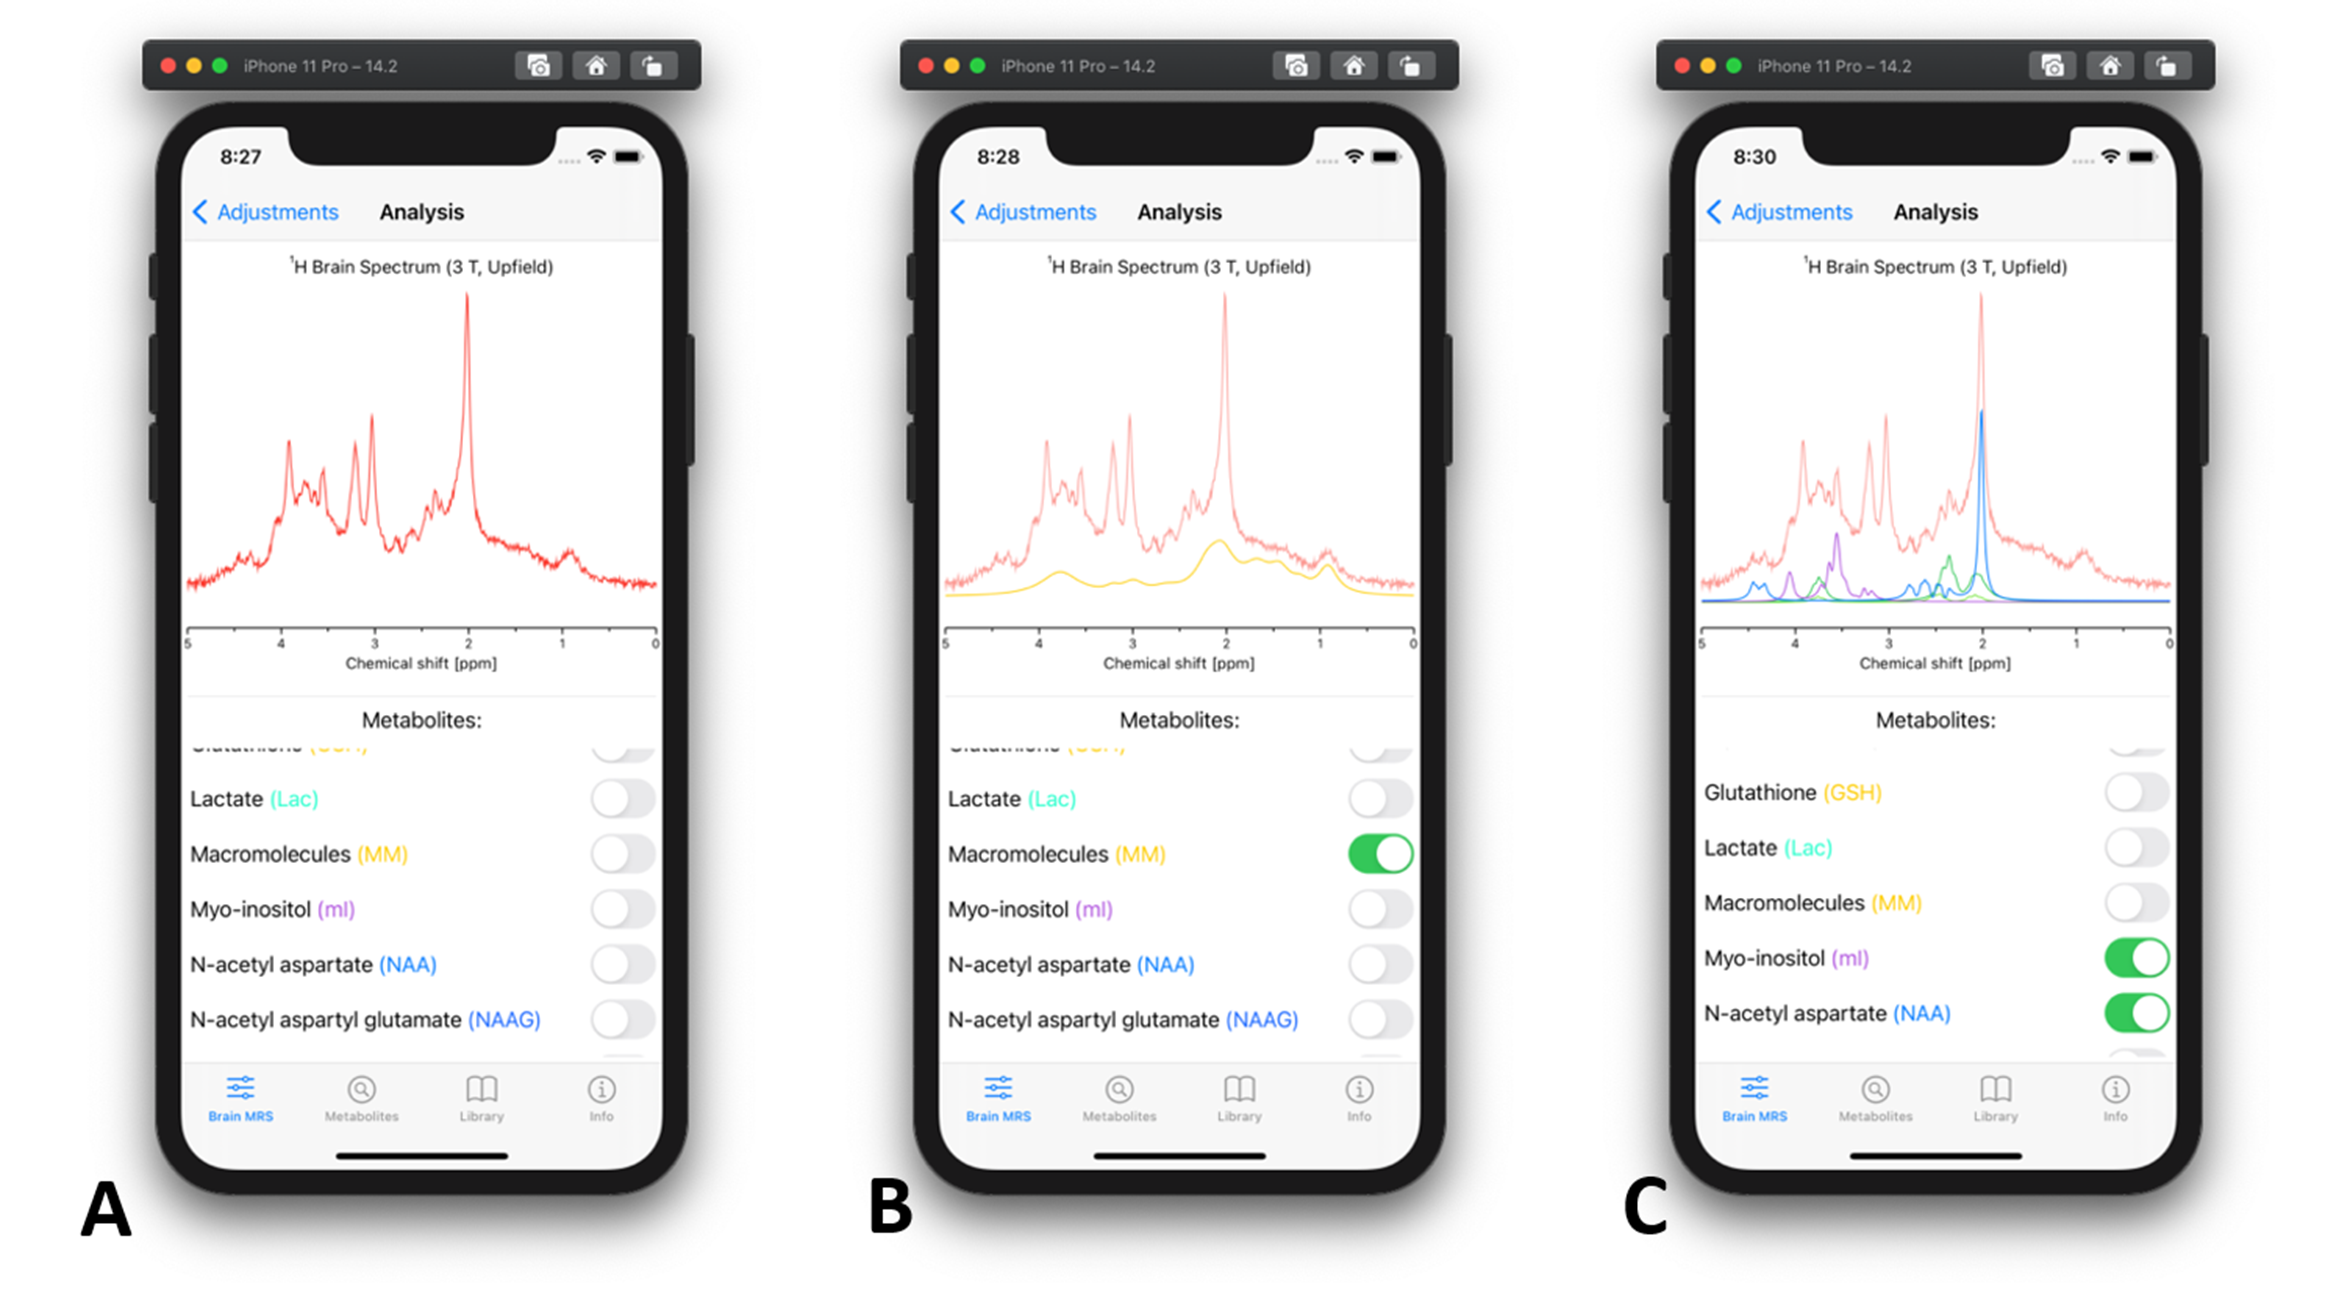
- Brain MRS – Analysis: After all parameters are set, for example reflecting short TE spectrum (Fig. 2A), the brain spectrum can be then analyzed by selective visualization of a metabolite (Fig. 2B) or group of metabolites (Fig. 2C). This could be used to identify an “unknown” peak by comparing the spectrum at hand to the particular spectrum with matched parameters in Pocket MRS.
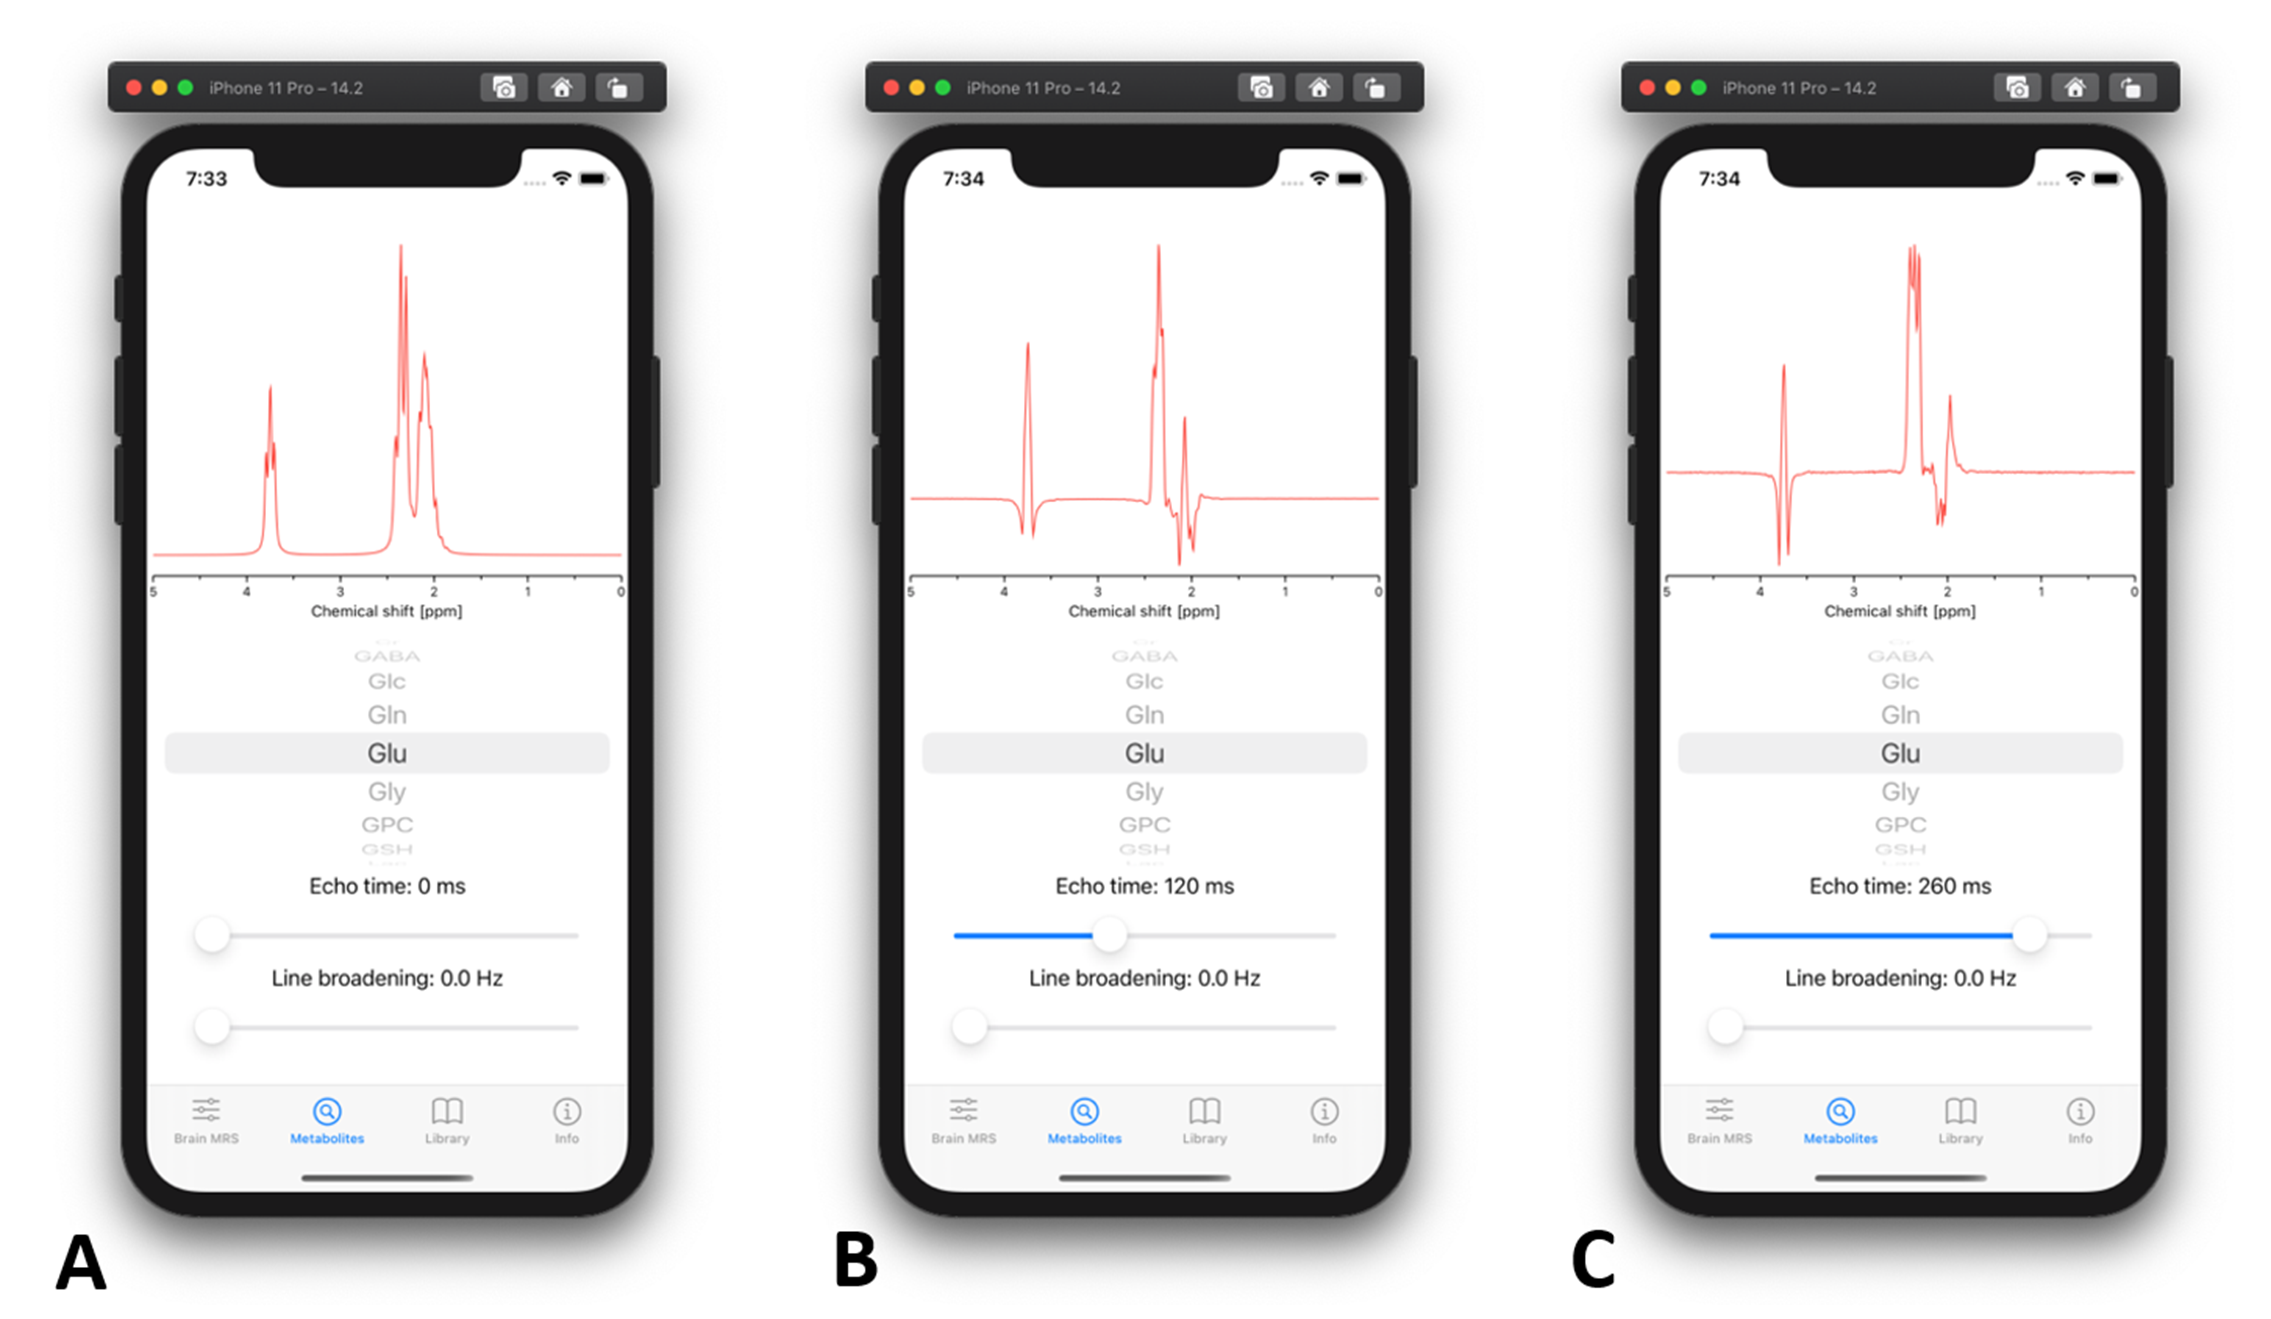
- Metabolites: All metabolites which are part of the brain MRS spectrum can be individually observed with this tool. User can adjust the TE (0 – 300 ms) and line broadening. This tool is especially useful for observing J-modulation of coupled spin systems (Fig. 3).
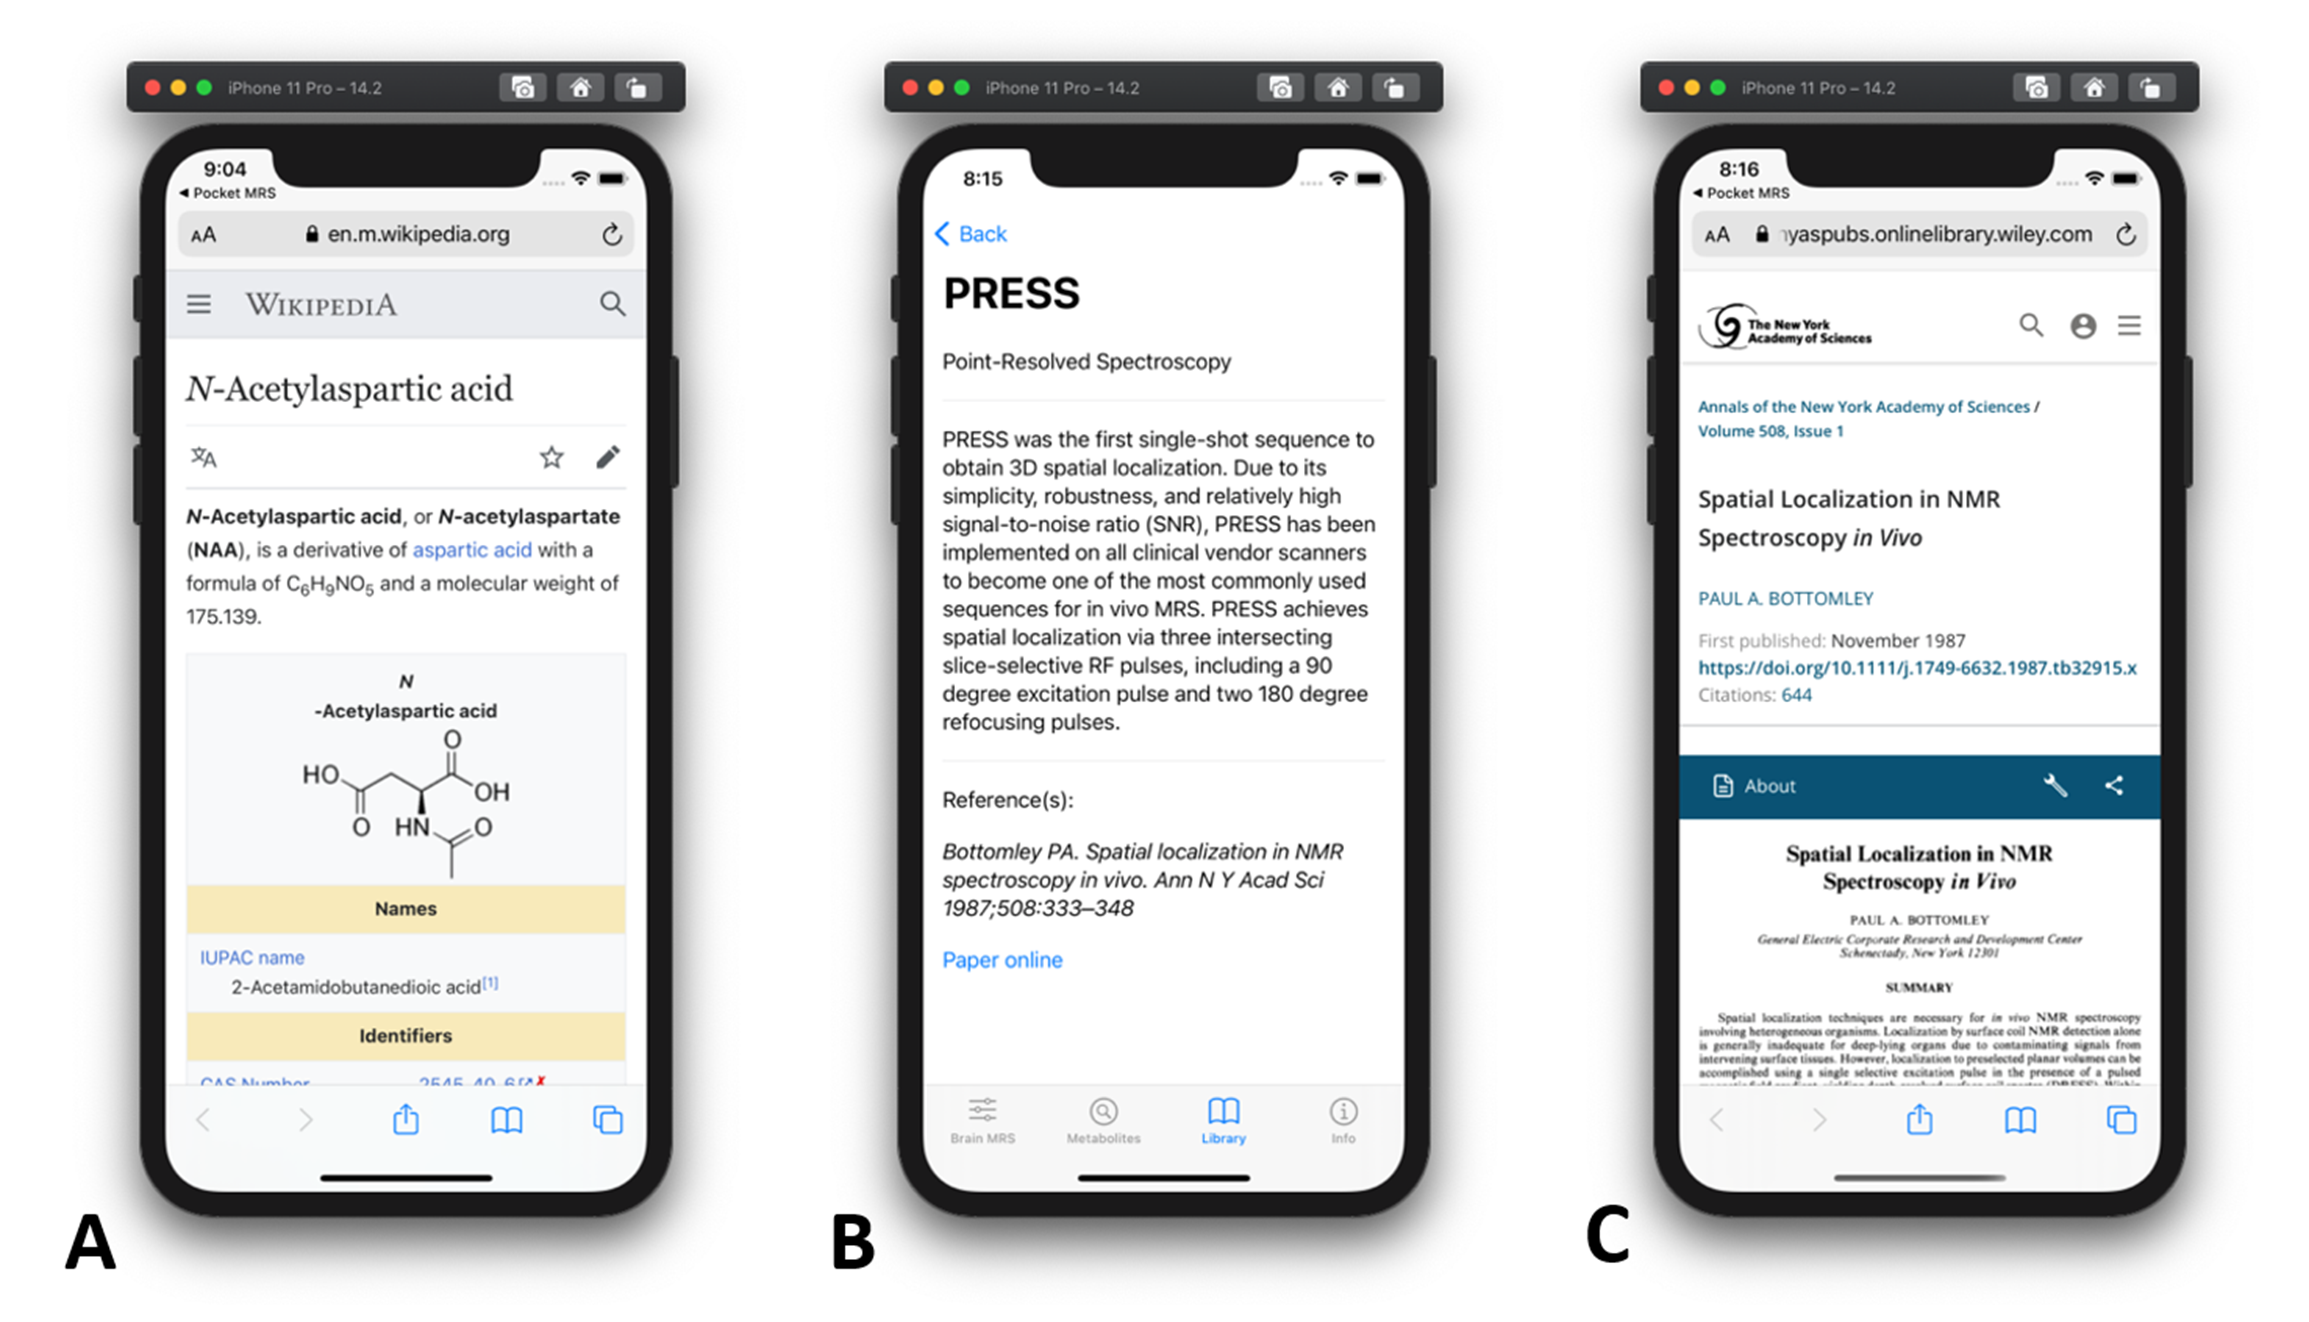
- Library: Information about each metabolite used in the simulations and most common MRS acquisition methods can be found here. The library contains information stored online or offline. Online information is linked via uniform resource locator (URL) and can be viewed in a web browser (Fig. 4A). Offline information is stored in the app and provides more MRS specific information (Fig. 4B). All off-line information is cited and the reference is linked via the publisher’s URL (Fig. 4C).
Discussion
The presented version of Pocket MRS offers data for analysis of proton spectra of the brain tissue at 3 T. Other field strengths (e.g., 1.5 and 7 T), nuclei (e.g., 13C, 31P) and tissues (e.g. liver, muscle, breast) will be included in future versions. Pocket MRS will be available for iOS devices in the beginning of 2021 on Apple App Store.Conclusion
Pocket MRS app is presented that provides fast, simple and easy access to simulated spectra from human tissues and its analysis. The app can be a quick digital reference and valuable help for the MRS community when desktop computers and extended MRS software tools are not available.Acknowledgements
The authors wish to thank Joan José Martínez from Columbia Technology Ventures and Ivan Lozuk from Columbia University Information Technology for their help with the project.References
1. Landheer K, Swanberg KM, Juchem C. Magnetic resonance Spectrum simulator (MARSS), a novel software package for fast and computationally efficient basis set simulation. NMR Biomed. 2019:1–13 doi: 10.1002/nbm.4129.
2. Landheer K, Juchem C. Magnetic Resonance Spectrum Simulator - MARSS. http://innovation.columbia.edu/technologies/CU19215_MARSS.
3. Wyss PO, Bianchini C, Scheidegger M, et al. In vivo estimation of transverse relaxation time constant (T 2 ) of 17 human brain metabolites at 3T. Magn. Reson. Med. 2018;80:452–461 doi: 10.1002/mrm.27067.
4. Landheer K, Gajdošík M, Treacy M, Juchem C. Concentration and effective T2 relaxation times of macromolecules at 3T. Magn. Reson. Med. 2020:mrm.28282 doi: 10.1002/mrm.28282.
5. Mlynárik V, Gruber S, Moser E. Proton T 1 and T 2 relaxation times of human brain metabolites at 3 Tesla. NMR Biomed. 2001;14:325–331 doi: 10.1002/nbm.713.
6. Landheer K, Sahgal A, Myrehaug S, Chen AP, Cunningham CH, Graham SJ. A rapid inversion technique for the measurement of longitudinal relaxation times of brain metabolites: application to lactate in high-grade gliomas at 3 T. NMR Biomed. 2016;29:1381–1390 doi: 10.1002/nbm.3580.
7. Xin L, Schaller B, Mlynarik V, Lu H, Gruetter R. Proton T1 relaxation times of metabolites in human occipital white and gray matter at 7 T. Magn Reson Med 2013;69:931–936 doi: 10.1002/mrm.24352.
8. Puts NAJ, Barker PB, Edden RAE. Measuring the longitudinal relaxation time of GABA in vivo at 3T. J Magn Reson Imag 2013;37:999–1003 doi: 10.1016/j.neuroimage.2013.08.045.The.
9. de Graaf RA. In Vivo NMR Spectroscopy. 2nd ed. Chichester, UK: John Wiley & Sons, Ltd; 2007. doi:10.1002/9780470512968.
10. Govindaraju V, Young K, Maudsley AA. Proton NMR chemical shifts and coupling constants for brain metabolites. NMR Biomed 2000;13:129–153 doi: 10.1002/1099-1492(200005)13:3<129::AID-NBM619>3.0.CO;2-V [pii].
11. Near J, Evans CJ, Puts NAJ, Barker PB, Edden RAE. J -difference editing of gamma-aminobutyric acid (GABA): Simulated and experimental multiplet patterns. Magn. Reson. Med. 2013;70:1183–1191 doi: 10.1002/mrm.24572.
12. Bottomley PA. Spatial localization in NMR spectroscopy in vivo. Ann. N. Y. Acad. Sci. 1987;508:333–48.
Figures