3721
Quantification of neurobiological responses in the hippocampus: Towards in vivo neurochemical profiling of cuprizone-induced demyelination1Department of Radiology, Asan Medical Center, University of Ulsan College of Medicine, Seoul, Korea, Republic of, 2Department of Convergence Medicine, Asan Medical Center, University of Ulsan College of Medicine, Seoul, Korea, Republic of, 3Convergence Medicine Research Center, Asan Institute for Life Sciences, Asan Medical Center, Seoul, Korea, Republic of, 4Department of Radiological Science, College of Health Sciences, Yonsei University, Wonju, Korea, Republic of
Synopsis
This study quantitatively measured the changes in metabolites in the hippocampal lesions of a rat model of cuprizone-induced demyelination as detected using in vivo proton magnetic resonance spectroscopy (1H-MRS) at 7-T. The principal findings of the present study were significantly altered concentrations of gamma-aminobutyric acid, glutamate, myo-Inositol, tCr (creatine + phosphocreatine), and Glx (glutamate + glutamine) in the hippocampus of the demyelination-induced rats relative to those in control rats. Our results showed that cuprizone-induced neuronal demyelination may influence the severe abnormal metabolism in hippocampal lesions, and these responses could be caused by microglial activation, mitochondrial dysfunction, and astrocytic necrosis.
INTRODUCTION
Multiple sclerosis (MS) is a chronic and progressive inflammatory disease of the central nervous system (CNS).1,2 The most significant characteristic features of MS are inflammatory lesions, primary demyelination, axonal damage, plaques, microglia activation, mitochondrial dysfunction, and abnormal metabolism.2-4 The aim of this study was to quantitatively examine the neurochemical alterations in hippocampal lesions in a rat model of cuprizone-induced demyelination, as detected using proton magnetic resonance spectroscopy (1H-MRS).METHODS
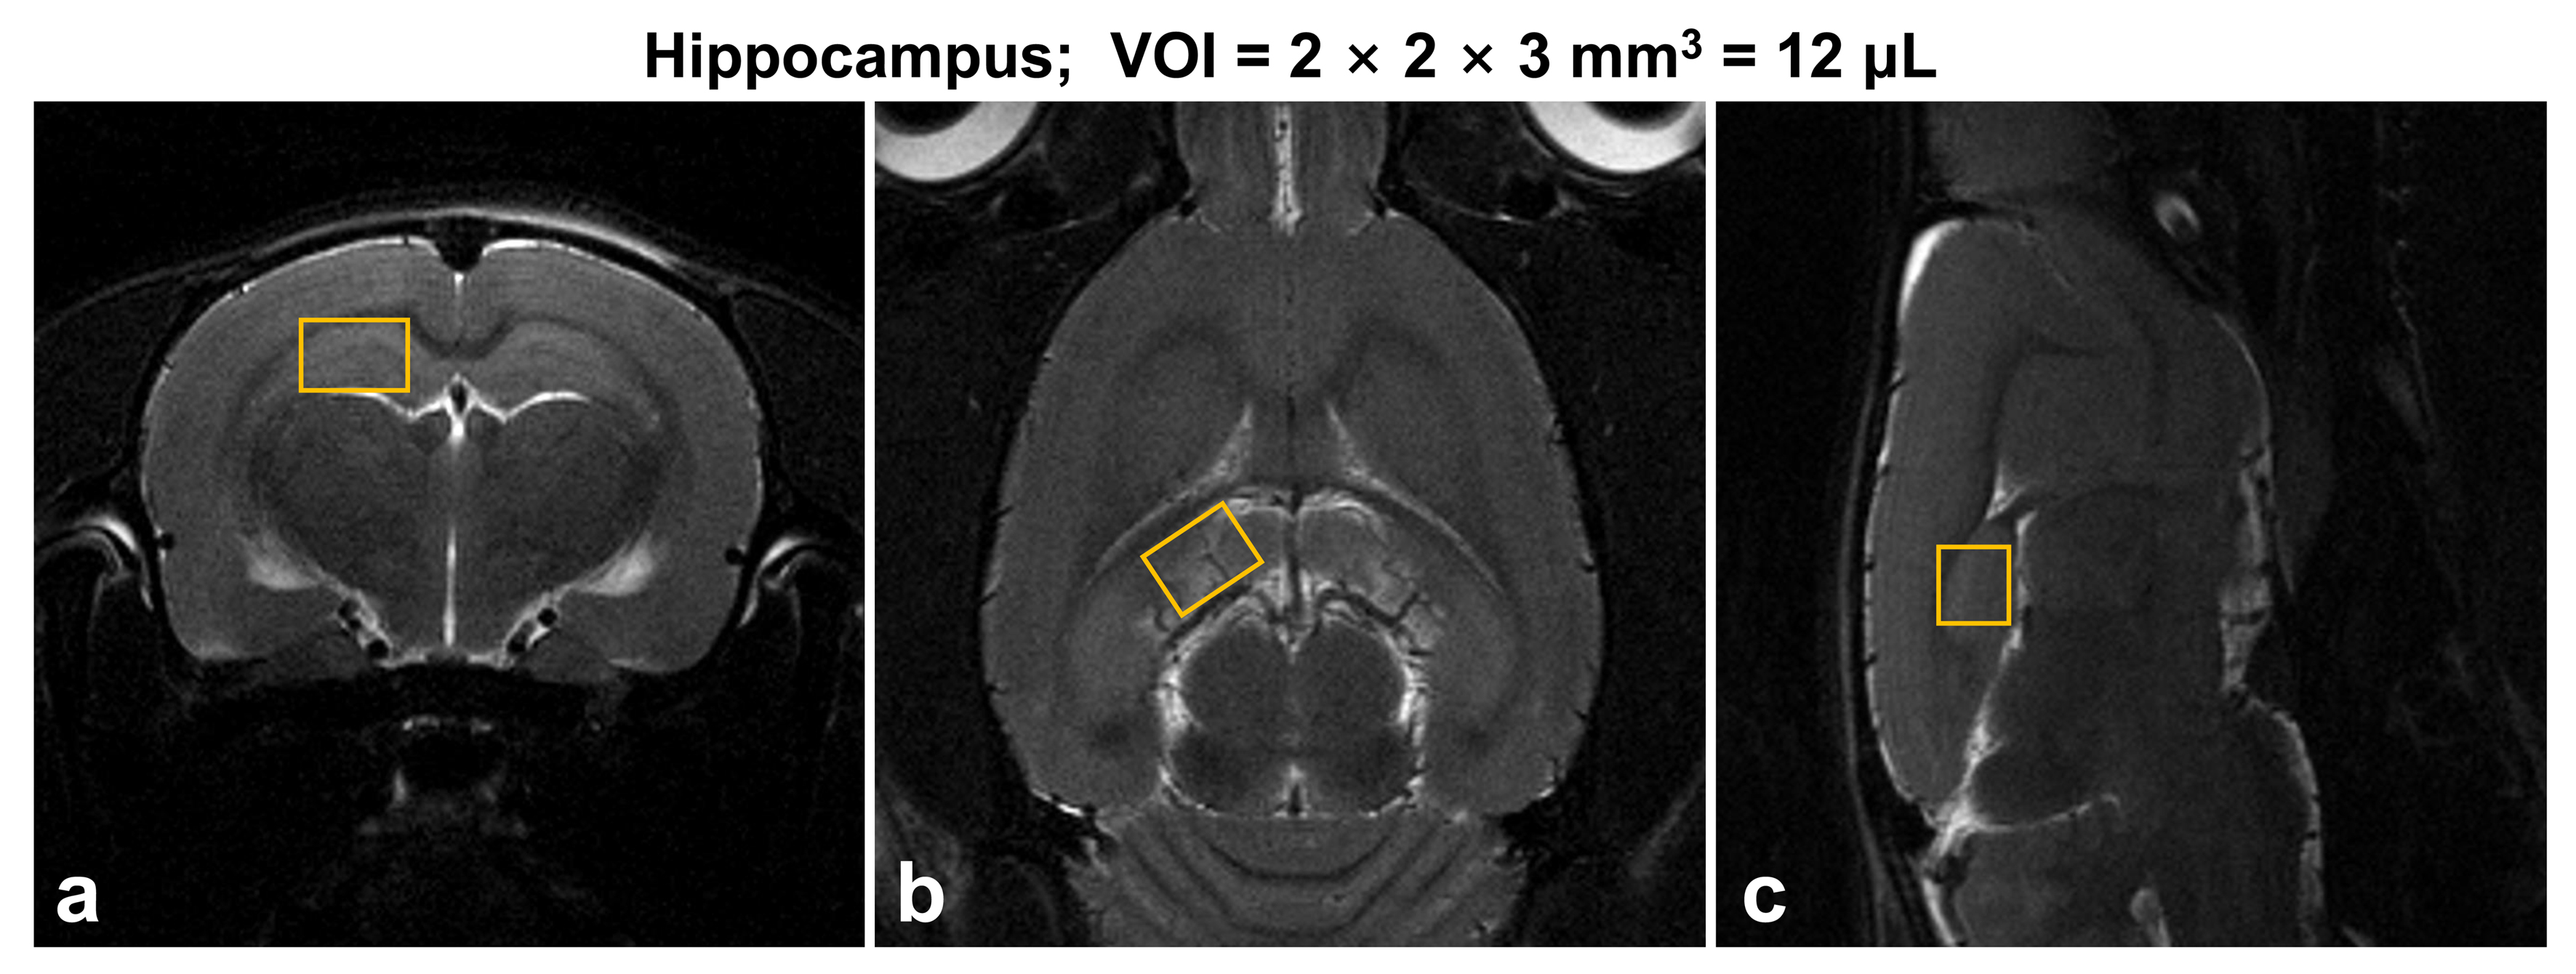
Animals: Nineteen Sprague-Dawley rats were divided into two groups (control [CTRL] group; n = 11, and cuprizone-induced [CPR] group; n = 8). To induce demyelination in the hippocampus, nine CPR rats were provided a diet of milled with 0.2% cuprizone (bis[cyclohexanone]oxaldihydrazone) for seven weeks, while CTRL rats were maintained on a regular chow diet.1H-MRS: Designs of in vivo 1H-MRS studies have been previously described.5 All in vivo MR experiments were carried out using a horizontal 7-T/160-mm MRI scanner. Water suppressed in vivo proton spectra were acquired from the hippocampal region (Fig.1). All parameters were as follows: spin-echo-based PRESS pulse sequence, VAPOR method, VOI = 2 × 2 × 3 mm3 (12.0-μL), TR/TE = 5000/16.3-ms, spectral width = 5,000 Hz, average = 256, and data points = 2,048.
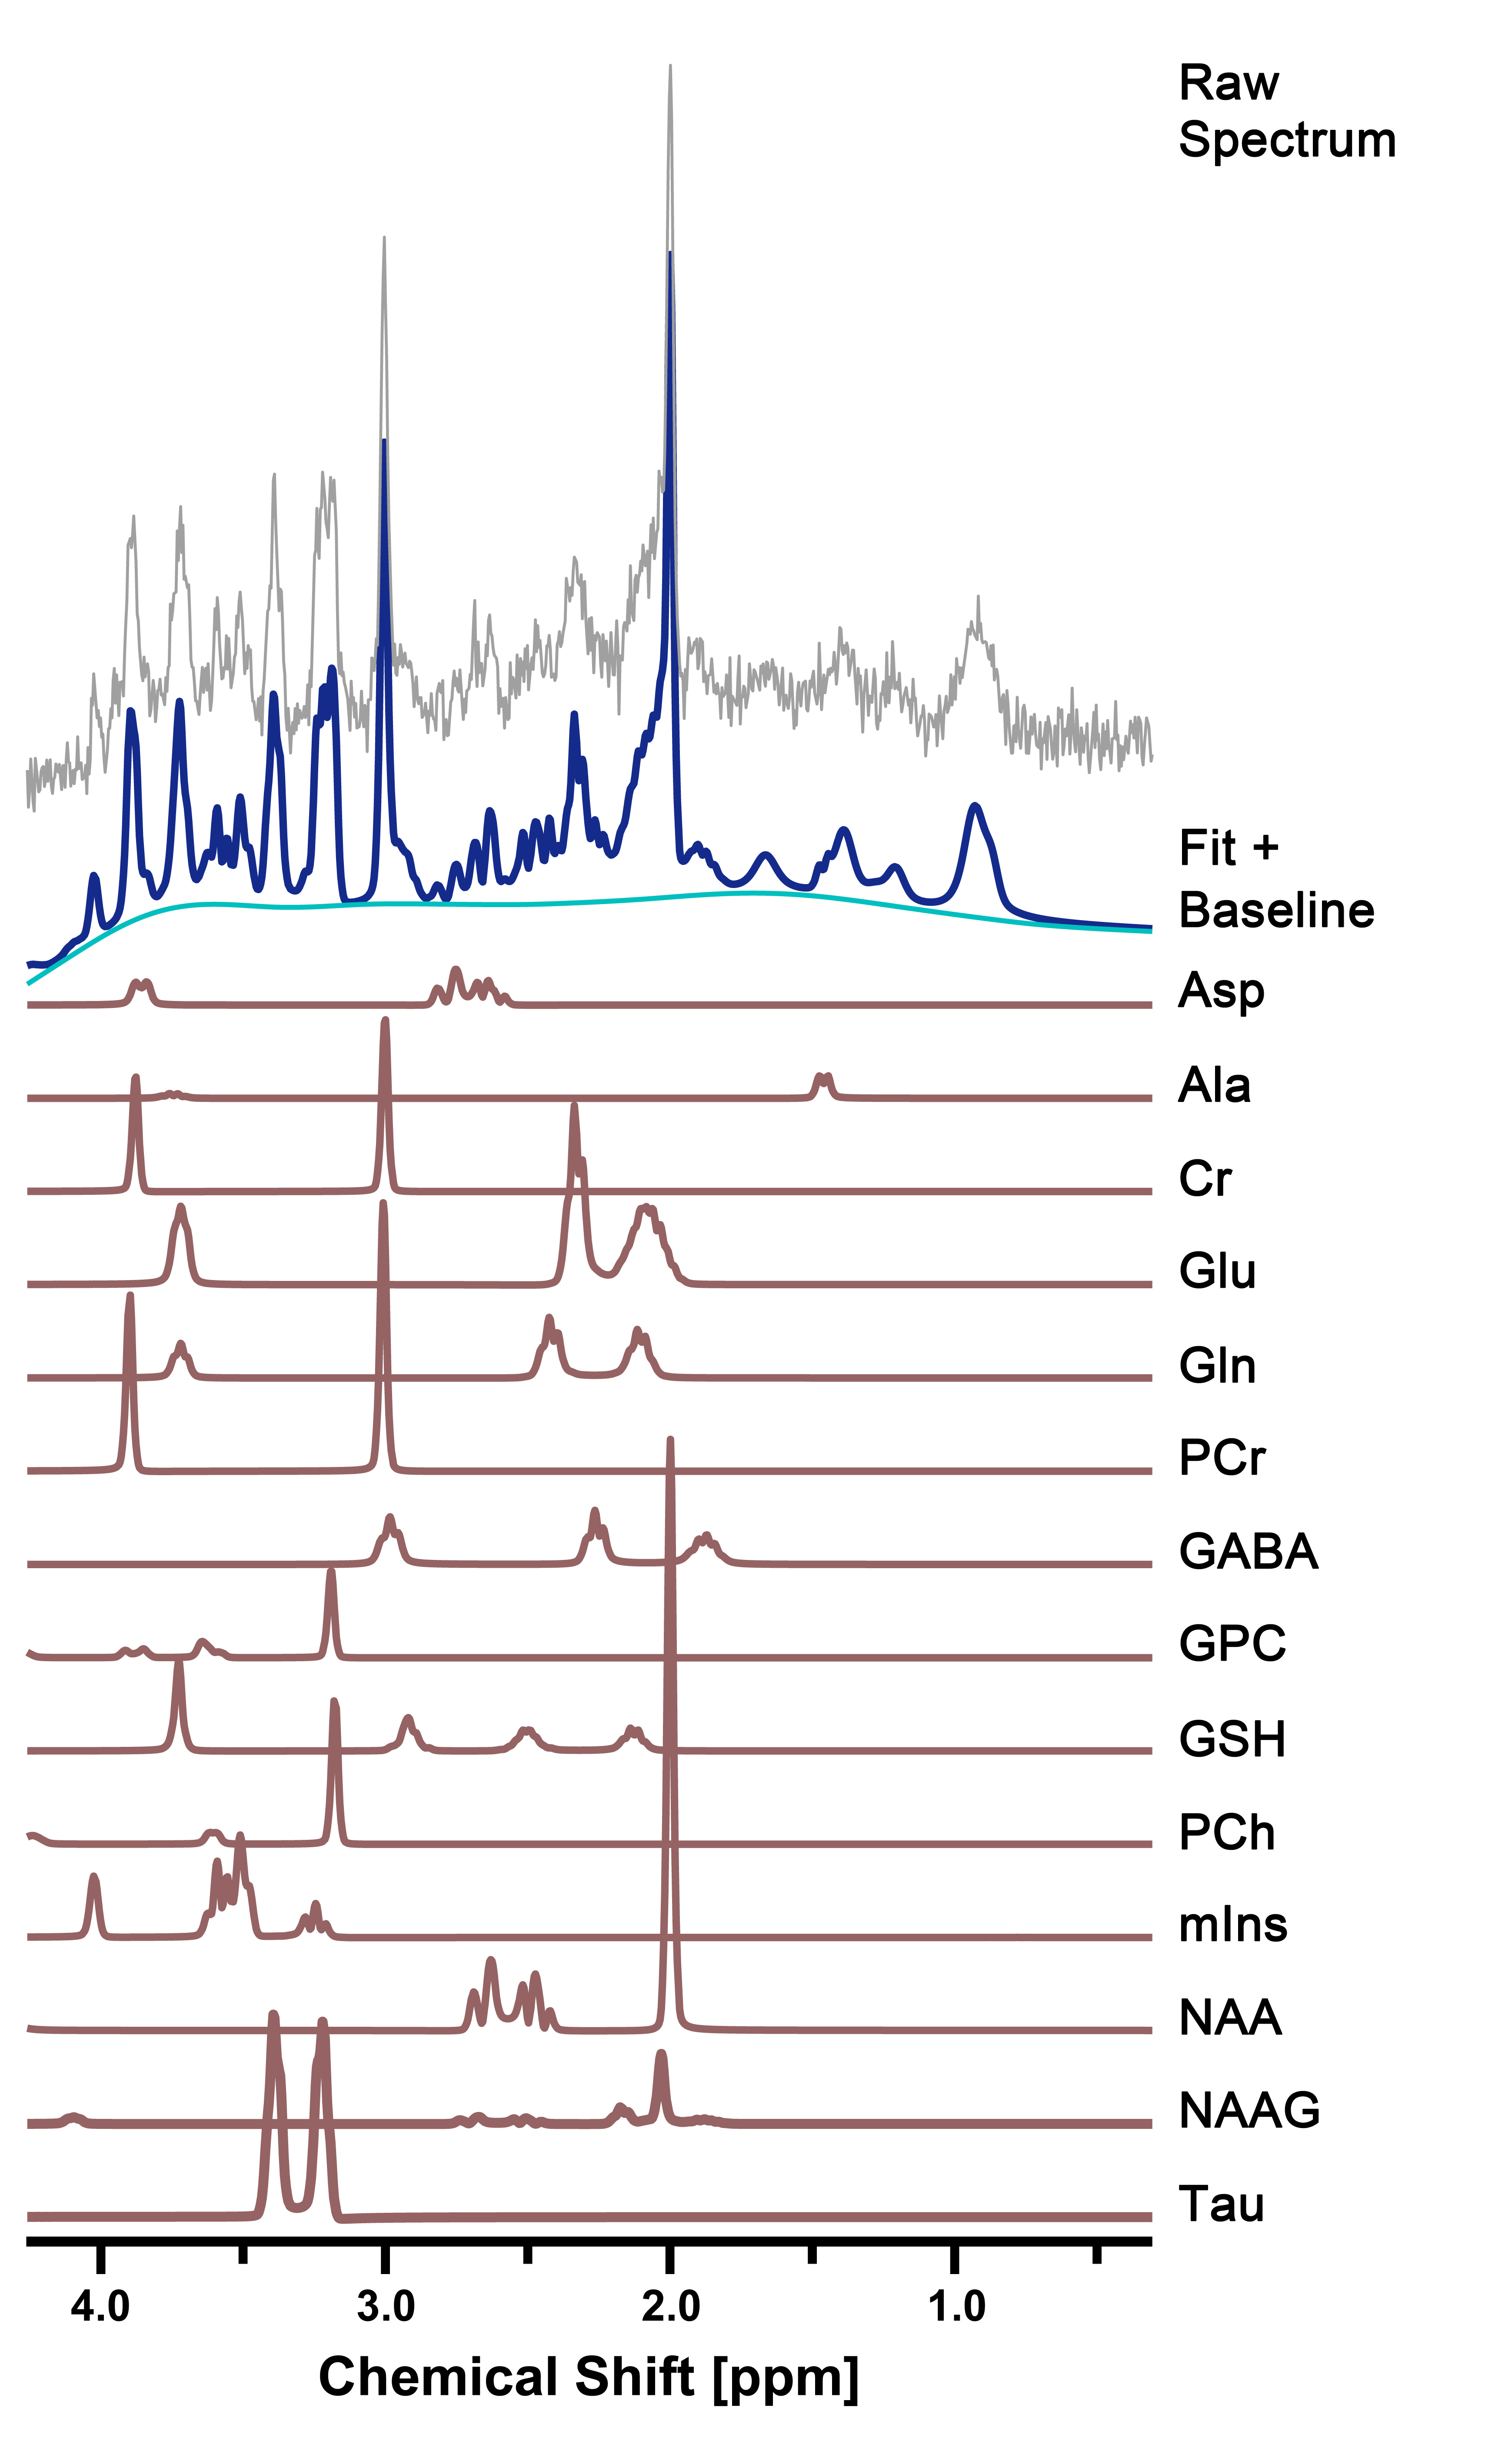
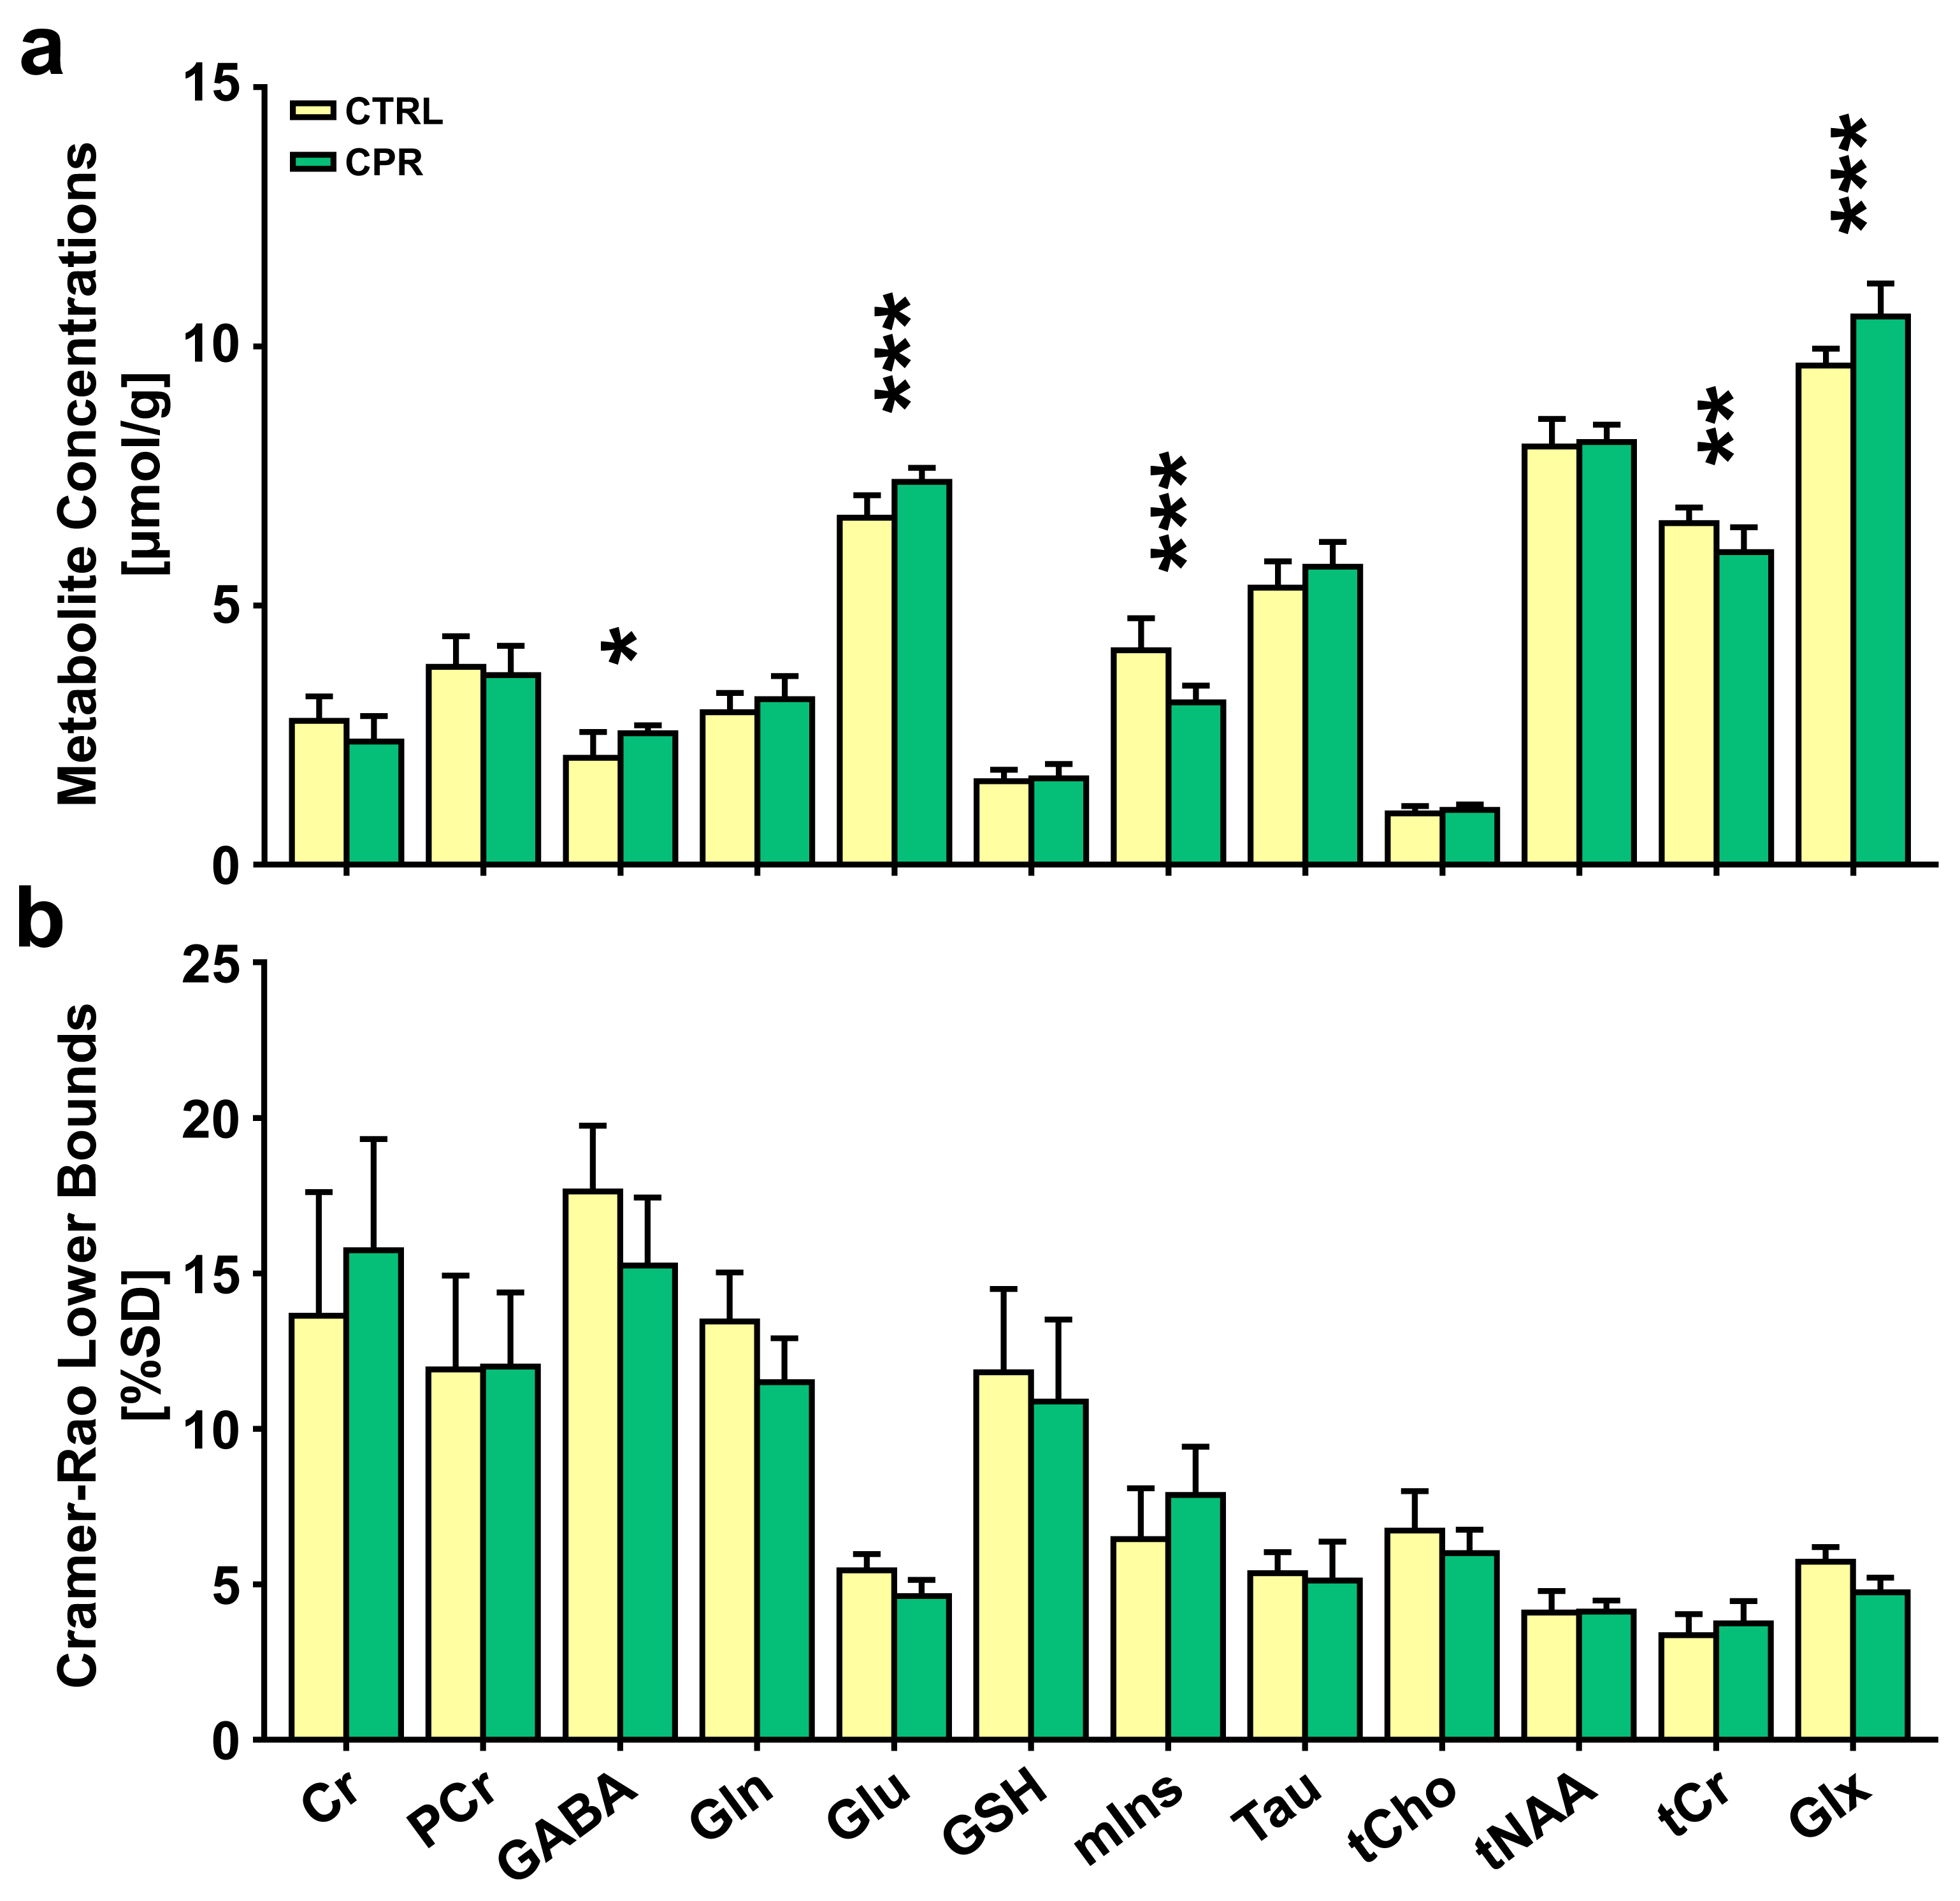
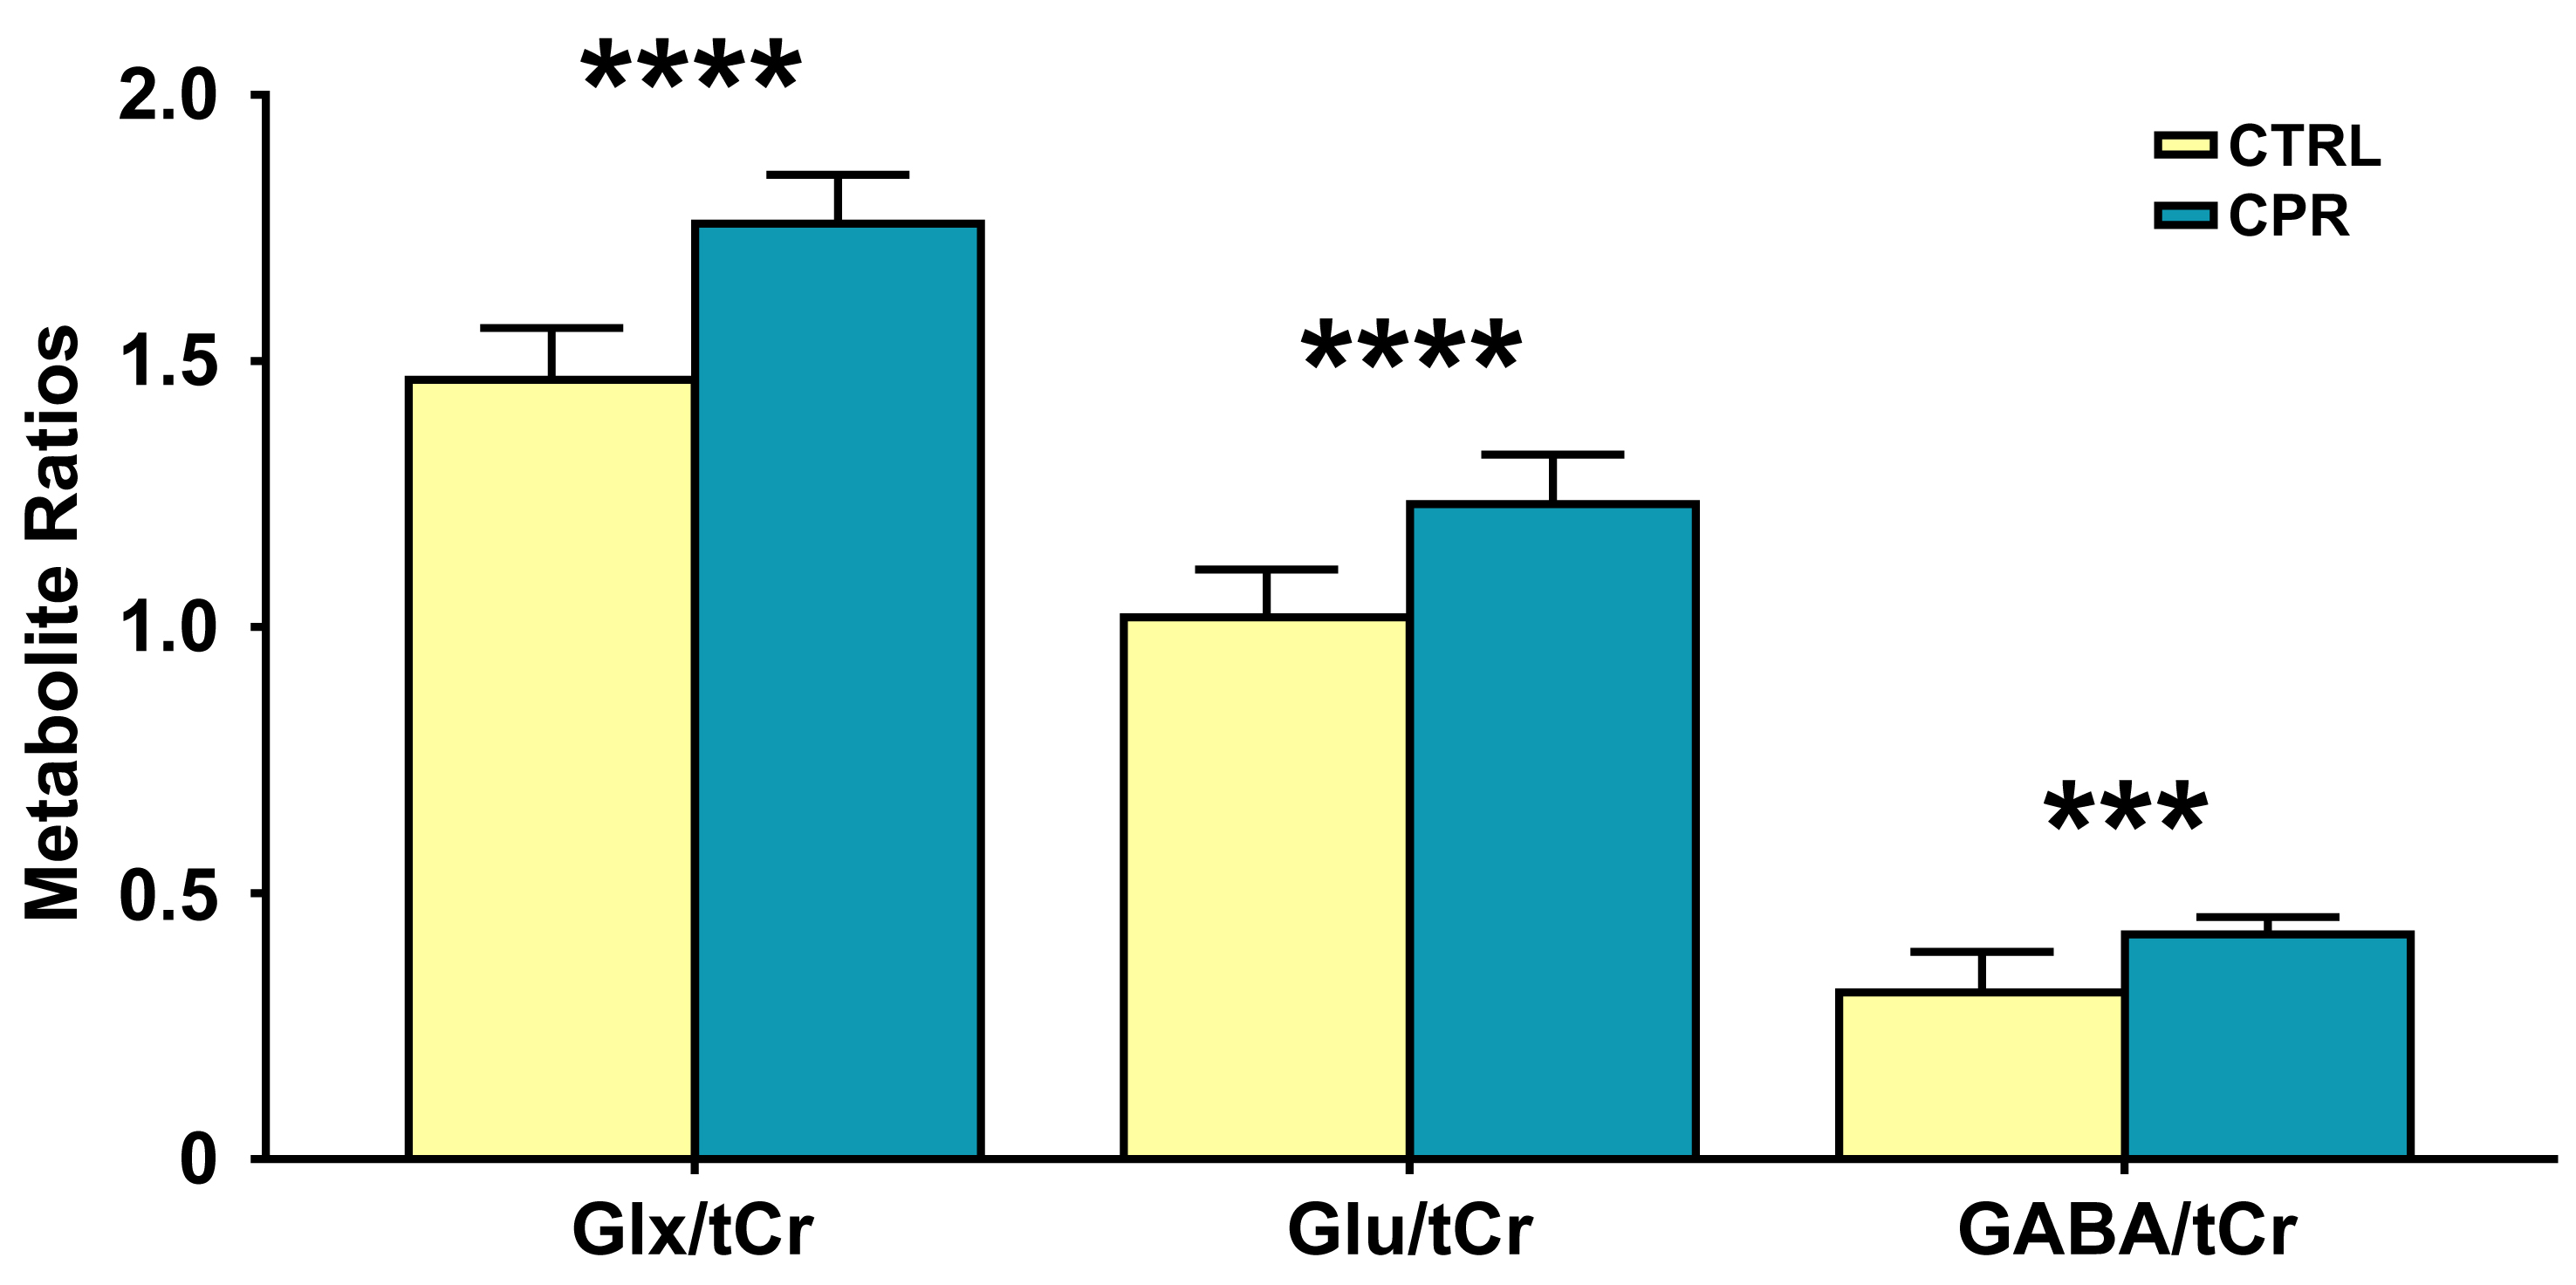
Spectral Quantification: Postprocessing of 1H-MRS raw data was quantified using a linear combination of models (LCModel) in a fully automated pipeline. In vivo proton spectra were analyzed using a set of simulated basis sets including 18 metabolites, as follows: Ala, alanine; Asp, aspartate; Cr, creatine; GABA, gamma-aminobutyric acid; Glc, glucose; Glu, glutamate; Gln, glutamine; GSH, glutathione; GPC, glycerophosphocholine; Gly, glycine; Lac, lactate; NAA, N-acetylaspartate; NAAG, N-acetylaspartylglutamate; mIns, myo-inositol; PCh, phosphocholine; PCr, phosphocreatine; sIns, scyllo-inositol; Tau, taurine; tNAA, total NAA = NAA + NAAG; Glx, glutamine and glutamate complex = Glu + Gln; tCr, total Cr = Cr + PCr; and tCho, total Cho = GPC + PCh. Eddy current correction in all proton spectra was applied and fitted in the chemical shift range from 4.0 to 0.3 ppm. The unsuppressed water signal was used as an internal reference for water scaling, and metabolite concentrations were acquired (μmol/g). Additionally, the relative metabolite levels of Glx, Glu, and GABA were calculated by dividing the tCr signals and expressed as Glx/tCr, Glu/tCr, and GABA/tCr ratios. An estimate of the uncertainty (Cramer-Rao lower bounds [CRLBs]; %SD) was provided by the LCModel. Individual metabolite signals were used to determine the reliability of the fitting; less than 10%SD was considered acceptable for Glu, mIns, Tau, tCho, tNAA, tCr, and Glx; less than 20%SD was acceptable for Cr, PCr, GABA, Gln, and GSH.
Statistical Analysis: The metabolite quantification (absolute concentrations and peak ratio values), spectral quality measurements (signal-to-noise ratio [SNR], and full-width at half-maximum [FWHM]) were normally distributed for all data (Kolmogorov-Smirnov test of normality, all p > 0.05), and independent independent t-tests were used. Statistical differences were assumed to be significant for p-values below 0.05.
RESULTS AND DISCUSSION
Representative high-resolution 7-T spectra with narrow linewidths from a single voxel of the hippocampal region were obtained throughout the study. In all proton spectra (Fig.2), the average FWHM and SNR levels estimated using the LCModel were 7.8±1.0 vs. 7.5±0.8, p = 0.552 for FWHM (Hz), and 13.5±1.0 vs. 14.0±1.2, p = 0.388 for SNR in the CTRL and CPR groups, respectively. All spectral quality values showed no significant difference between the two groups. Figure 3 illustrates the assessed cerebral metabolite concentrations and spectral CRLB values obtained from the hippocampal region of both groups. An independent t-test revealed significant differences in the cerebral metabolite concentrations between the two groups. The concentrations of GABA (2.064±0.496 vs. 2.538±0.153 μmol/g; p = 0.019), Glu (6.693±0.436 vs. 7.387±0.269 μmol/g; p = 0.001), and Glx (9.632±0.323 vs. 10.578±0.632 μmol/g; p = 0.001) were significantly higher in CPR rats than in CTRL rats. The concentrations of mIns (4.138±0.616 vs. 3.132±0.324 μmol/g; p = 0.001) and tCr (6.590±0.298 vs. 6.030±0.478 μmol/g; p = 0.006) were significantly lower in CPR rats than in CTRL rats. Figure 4 illustrates the selected metabolite ratios of interest that were obtained from the hippocampal region in both groups. The Glx/tCr (1.465±0.097 vs. 1.758±0.091; p < 0.001), Glu/tCr (1.018±0.090 vs. 1.231±0.094; p < 0.001), and GABA/tCr (0.314±0.076 vs. 0.422±0.033; p = 0.002) ratios in CPR rats were significantly higher than those in CTRL rats. To date, numerous studies have investigated the extensive hippocampal demyelination seen in MS patients and animal models, in parallel with inflammation, microglia, and macrophage activation, which are strongly related to hippocampal metabolism.6-8 The principal findings of the present study were significantly altered concentrations of GABA, Glu, mIns, tCr, and Glx in the hippocampus of the CPR rats relative to those in CTRL rats. In addition, the Glx/tCr, Glu/tCr, and GABA/tCr ratios were also statistically higher in the CPR rats than those in the CTRL rats. These findings suggest that neurochemical abnormalities are present in the hippocampal region of cuprizone-treated rats.CONCLUSION
To explore the neurochemical profile of cuprizone-induced demyelination in the hippocampus, we conducted an in vivo 1H-MRS study at 7-T. Significantly altered several metabolites possibly utilized as a neuronal marker in cuprizone-induced demyelination, and these findings might have cardinal importance in the progression of MS.Acknowledgements
This work was supported by the National Research Foundation of Korea (NRF) grant funded by the Korean Government (Ministry of Science and ICT, MSIT; NRF-2018R1C1B6004521 and NRF-2020R1A2C1103133).References
1. Koutsoudaki PN, Skripuletz T, Gudi V, et al. Demyelination of the hippocampus is prominent in the cuprizone model. Neurosci Lett. 2009;451(1):83–88.
2. Papadopoulos D, Dukes S, Patel R, et al. Substantial archaeocortical atrophy and neuronal loss in multiple sclerosis. Brain Pathol. 2009;19:238–253.
3. Varga E, Pandur E, Abrahám H, et al. Cuprizone Administration Alters the Iron Metabolism in the Mouse Model of Multiple Sclerosis. Cell Mol Neurobiol. 2018;38:1081–1097.
4. Mahad DH, Trapp BD, Lassmann H. Pathological mechanisms in progressive multiple sclerosis. Lancet Neurol. 2015;14:183–193.
5. Lee DH, Woo CW, Kwon JI et al. Cerebral mapping of glutamate using chemical exchange saturation transfer imaging in a rat model of stress-induced sleep disturbance at 7.0T. J Magn Reson Imaging. 2019;50:1866–1872.
6. Liu C, Zhang N, Zhang R, et al. Cuprizone-Induced Demyelination in Mouse Hippocampus Is Alleviated by Ketogenic Diet. J Agric Food Chem. 2020;68:11215–11228.
7. Geurts JJG, Bö L, Roosendaal SD, et al. Extensive hippocampal demyelination in multiple sclerosis. J Neuropathol Exp Neurol. 2007;66:819–827.
8. Norkute A, Hieble A, Braun A, et al. Cuprizone treatment induces demyelination and astrocytosis in the mouse hippocampus. J Neurosci Res. 2009;87:1343–1355.
Figures