3677
Effect of encoding time on diffusion data in porous media1Sir Peter Mansfield Imaging Centre, University of Nottingham, Nottingham, United Kingdom
Synopsis
Diffusion weighted imaging can be used as a marker of altered blood flow through the compromised placenta as the structure of villi is known to change. Probing the size of the intervillous space could provide a useful clinical marker of abnormal development. Here we investigate and demonstrate the effect of changing the encoding time of flow measurements through a porous media, and its ability to provide more information about villous structure.
Introduction
Diffusion weighted imaging is increasingly used as a marker of altered blood flow through the compromised placenta[1] and this has recently been combined with phase contrast flow measurements [2]. The structure of the villi is known to change in compromised pregnancy and so a method of probing the size of the intervillous space could provide a useful clinical marker of abnormal placental development. Restricted diffusion measurements provide a method of probing pore sizes and here we investigate whether changing the encoding time in velocity measurements can provide additional information. This abstract aims to demonstrate the effect of encoding time on both diffusion and flow measurements using flow through a porous sample, with a pulse gradient spin echo sequence of varying encoding time.Method
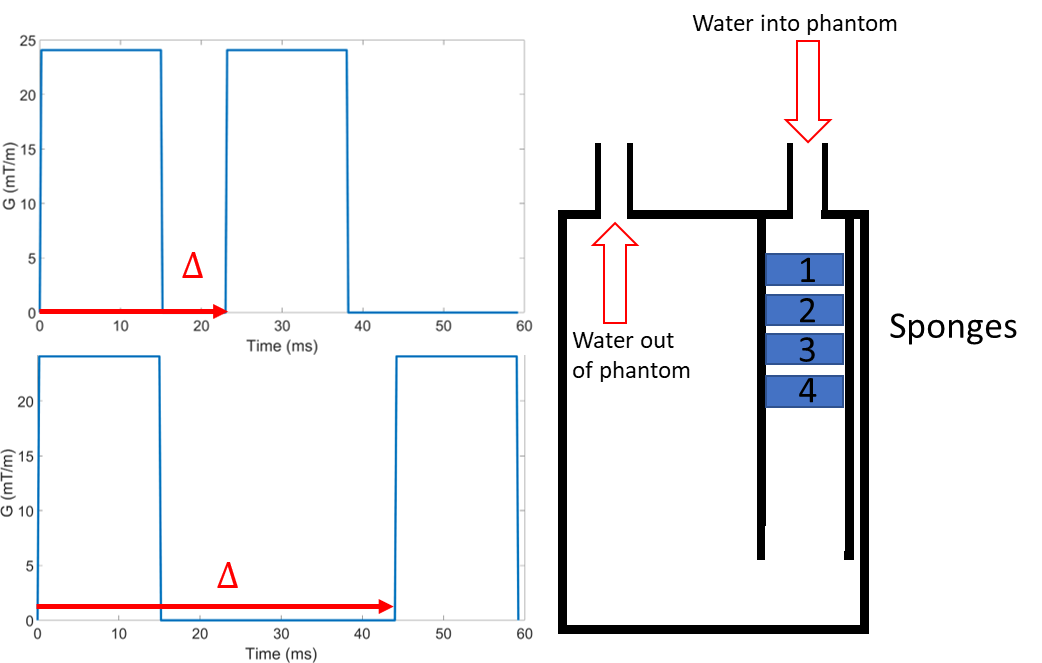
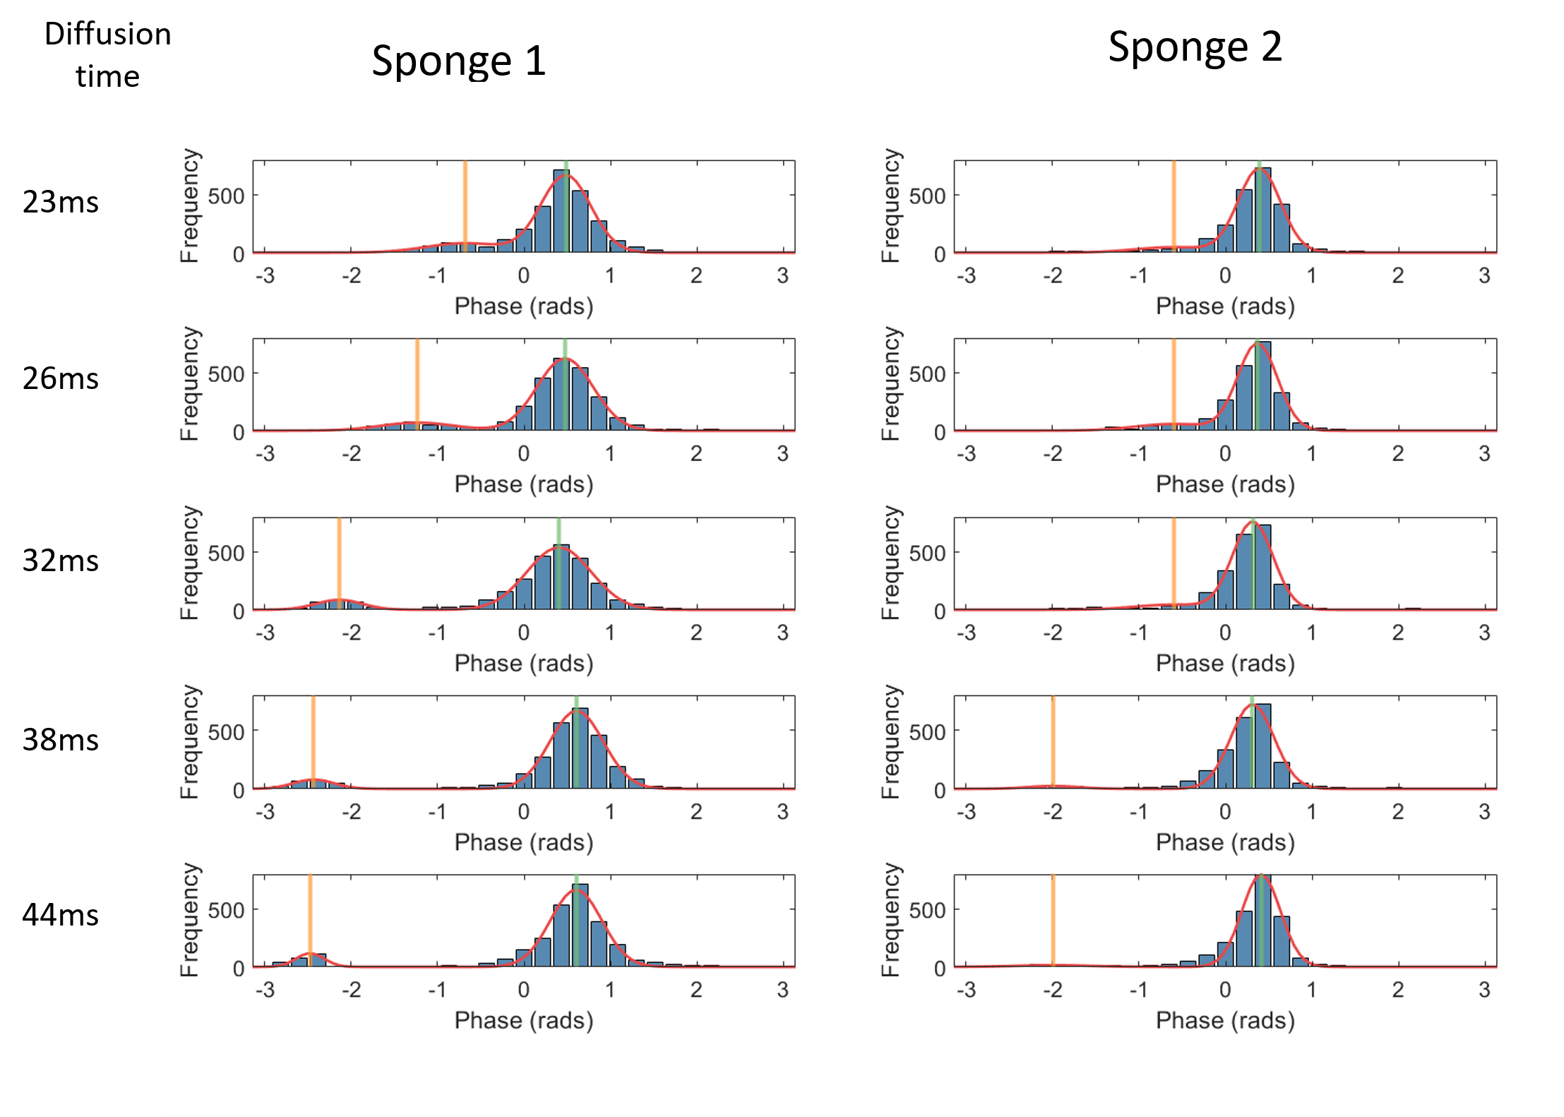
A pulse gradient spin echo (PGSE) EPI sequence (as typically used for diffusion encoding) was used to acquired data on a 3T Philips Achieva system using TE= 90ms, voxel size 1.08x1.08x4 mm, FOV 138x138mm and two slices. The diffusion time and amplitude of the gradients were under user control (to enable constant b values and velocity encoding (VENC) to be achieved for different encoding times ($$$\Delta$$$, Figure 1), and the phase data was saved. The phantom consisted of a pump which pushed water through an inlet into a cylindrical chamber (O.D. 70mm and length 160mm) containing 4 sponges cut to fill the cross section (Figure 1). Slices through sponges 1 (larger pores) and sponge 2 (smaller pores) were imaged for flow encoding (lower gradients) and diffusion encoding (higher gradients).Flow encoding scans were set up to achieve a constant VENC of ± 0.70 mm/s for 5 values of $$$\Delta$$$ (23-44ms). The resulting phase data was corrected for eddy current effects by subtracting data acquired with the pump switched off. The resulting phase data were masked around the sponges on an unencoded image, and a histogram of the phase within the mask was created. This showed two peaks and so was fitted to the sum of two Gaussian functions. These Gaussians were then used to split the voxels into two groups; voxels within 2 standard deviations of the position of the smaller peak were taken as belonging to peak 2 unless this overlapped with the larger peak 1 (Figure 2), in which case the point of inflection between the two gaussians was taken as the limit.
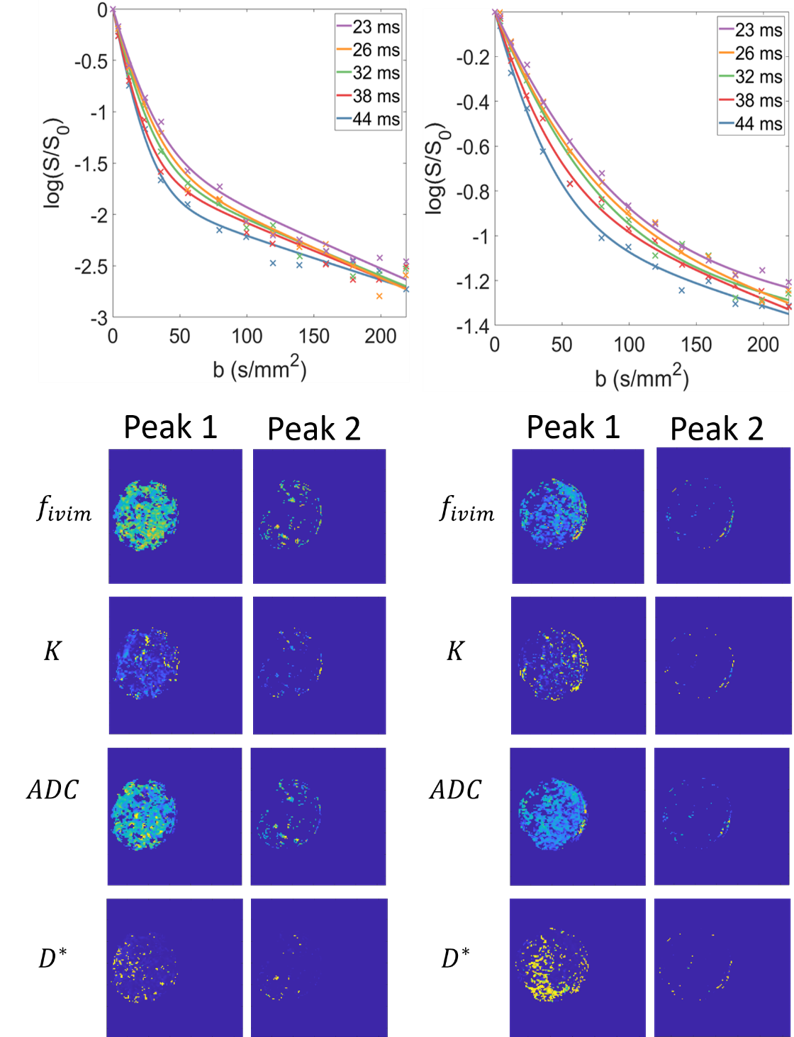
Diffusion encoding scans were acquired for 14 b-values from 0-219 s/mm2, repeated for the same 5 different values of $$$\Delta$$$ (23-44ms). The voxelwise data acquired at each value of Delta was fitted to a biexponential Intra-Voxel Incoherent Motion (IVIM) model with kurtosis (K) to produce maps of D, D*, K and $$$f_{ivim}$$$. $$$S=S_0[(1-f_{ivim})e^{-bD+(1/6)b^2D^2K}+f_{ivim}e^{-bD^*}$$$
These maps were then masked according to the 2 peaks found in the flow encoding data.
Results
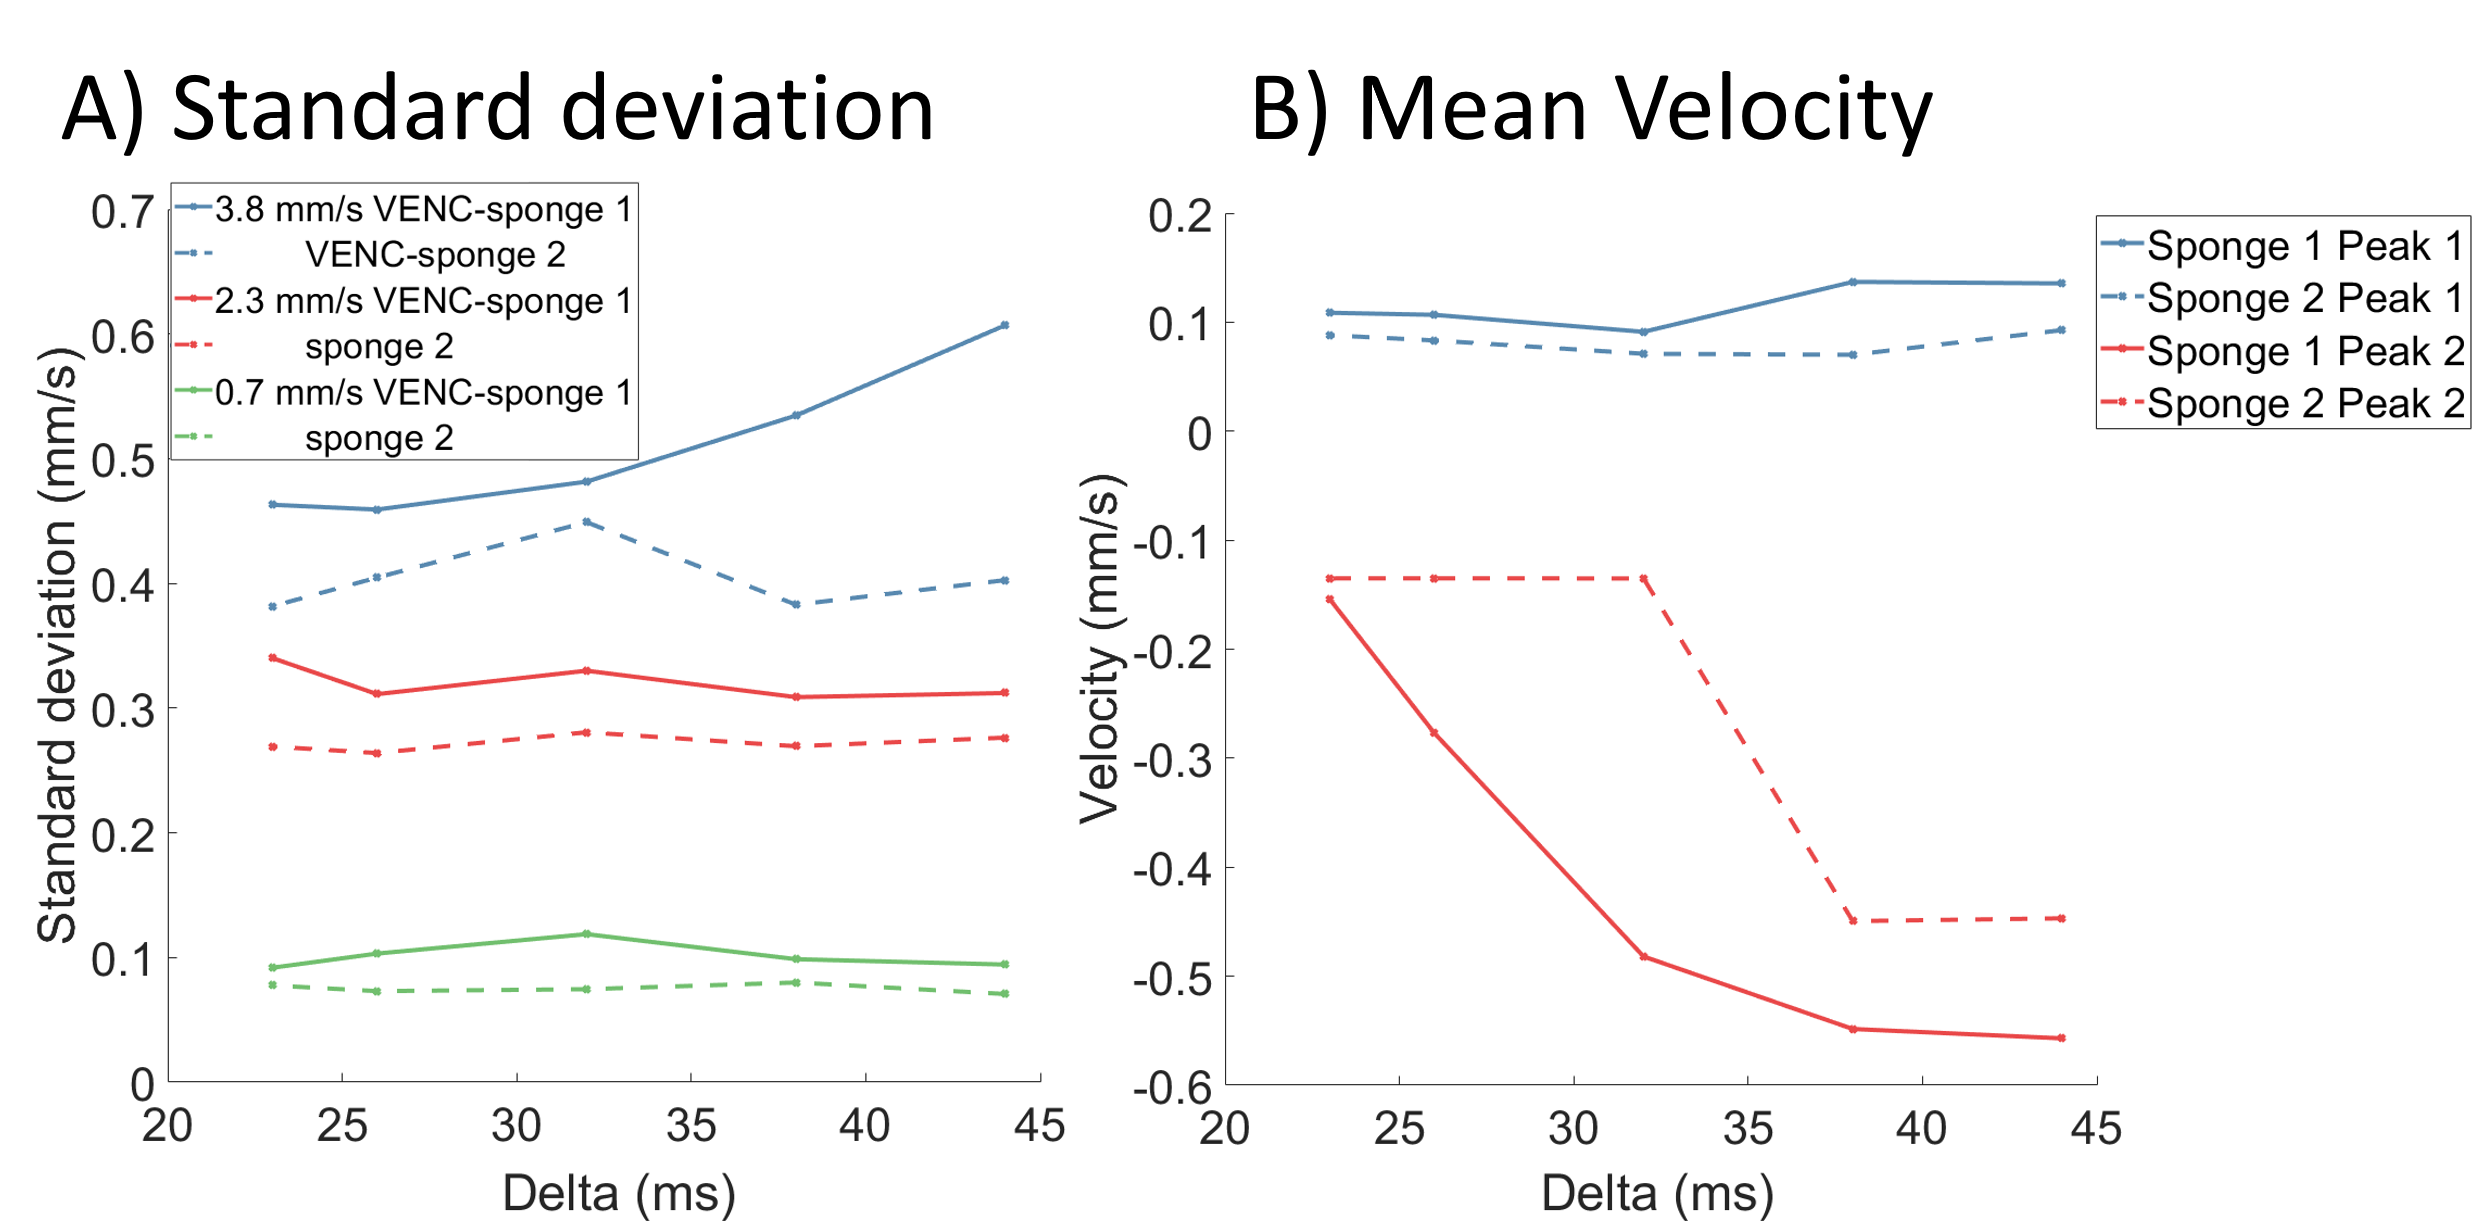
Flow encoding The peaks in the phase data histograms (Figure 2) demonstrated pixels with two types of water motion in the sponge. The width of Peak 1 (most voxels) increased with VENC (Figure 3a) indicating voxels with low net velocity and varying direction between voxels (probably percolation through sponge). The result was largely independent of Delta (figure 3a) suggesting that the slow net movement was not restricted over that period. Faster apparent velocities were measured in peak 2 (phase wrapping around in histogram as shown in Figure 2) and these were dependent on Delta (Figure 3b) indicating that movement was restricted over the encoding time.Diffusion encoding Figure 4a shows the fit to the IVIM model averaged over all voxels demonstrating changes in the curves with $$$\Delta$$$. Figure 4b shows maps of the pixelwise fits (masked according to peak 1 and peak 2 of the flow encoded data) for $$$\Delta$$$ = 23ms.
Disucssion
The voxels showing faster flow tended to be grouped together indicating channels of preferred movement through and around the sponge. For voxels showing slower flow the velocity measured was independent of encoding time but for voxels showing faster flow the velocity measured depended on encoding time, apparently plateauing at higher delta suggesting a mean free path of order 0.05mm. This suggests encoding time dependent flow measurements could be used to study pore sizes in the placenta.Figure 4a shows that the IVIM data is also sensitive to $$$\Delta$$$, indicating an increase in D* and $$$f_{ivim}$$$ with $$$\Delta$$$. Future work will determine how best to analyse this, but ultimately this multidimensional PGSE data will best be analysed by direct comparison to a fluid mechanical model of flow through the tissue.
We are awaiting the chance to test these methods in the human placenta when scanning of pregnant women recommences.
Acknowledgements
This work was funded by the National Institute of Health and the EPSRC/MRC Oxford Nottingham Biomedical Imaging CDT.References
[1] - Dellschaft, Neele S et al. “The haemodynamics of the human placenta in utero.” PLoS biology vol. 18,5 e3000676. 28 May. 2020, doi:10.1371/journal.pbio.3000676
[2] - Moore RJ et al. In utero perfusing fraction maps in normal and growth restricted pregnancy measured using IVIM echo-planar MRI. Placenta. 2000 Sep;21(7):726-32. doi: 10.1053/plac.2000.0567. PMID: 10985977.
Figures