3461
High-resolution anatomical and diffusion-weighted imaging in peripheral nerves at 7 Tesla using quantitative Double-Echo in Steady-State
Bragi Sveinsson1,2, Robert L Barry1,2,3, Olivia Rowe1,2, Jason Stockmann1,2, Daniel J Park1, Peter J Lally4, Matthew S Rosen1,2,5, and Reza Sadjadi6
1Athinoula A. Martinos Center for Biomedical Imaging, Massachusetts General Hospital, Boston, MA, United States, 2Radiology, Harvard Medical School, Boston, MA, United States, 3Harvard-Massachusetts Institute of Technology Health Sciences and Technology, Cambridge, MA, United States, 4Brain Sciences, Imperial College London, London, United Kingdom, 5Physics, Harvard University, Cambridge, MA, United States, 6Neurology, Massachusetts General Hospital, Boston, MA, United States
1Athinoula A. Martinos Center for Biomedical Imaging, Massachusetts General Hospital, Boston, MA, United States, 2Radiology, Harvard Medical School, Boston, MA, United States, 3Harvard-Massachusetts Institute of Technology Health Sciences and Technology, Cambridge, MA, United States, 4Brain Sciences, Imperial College London, London, United Kingdom, 5Physics, Harvard University, Cambridge, MA, United States, 6Neurology, Massachusetts General Hospital, Boston, MA, United States
Synopsis
Research has suggested elevated diffusivity in nerves of subjects with peripheral nerve disease. Obtaining quantitative estimates of diffusivity at small scales within peripheral nerves could therefore provide important information about disease progression. However, diffusion weighted imaging at such small scales is challenging due to low signal to noise ratio (SNR) and distortion. Here, we demonstrate the feasibility of obtaining high-SNR, high-resolution, low-distortion anatomical images and quantitative diffusivity estimates in individual nerve fascicles with the quantitative Double-Echo in Steady-State sequence at 7 Tesla.
Introduction
In recent years, quantitative MRI measurements, providing estimates of such parameters as T2, diffusivity, and fat fraction, have proven to be a valuable complement to anatomical MRI scans for providing a more detailed picture of tissue pathology. For instance, studies have indicated that subjects with peripheral nerve disease, such as Charcot-Marie-Tooth (CMT) syndrome, exhibit elevated values of the apparent diffusion coefficient (ADC) in peripheral nerves1. Acquiring a combination of anatomical images and maps of ADC in peripheral nerves at high resolution could therefore provide an important biomarker for peripheral nerve disease severity. However, such acquisitions are challenging as they suffer from low signal to noise ratio (SNR) and distortion. High-resolution nerve imaging has been performed in the ankle, foot, and finger using surface coils, but not with diffusion weighting2. We demonstrate the feasibility of acquiring low-distortion anatomical images and ADC maps in the sciatic nerve at a resolution of less than 150 μm, enough to distinguish measurements within individual nerve fascicles, using the Double-Echo in Steady-State (DESS) sequence at 7T.Methods
To investigate the achievable anatomical image quality in the sciatic nerve at 7T compared to 3T, axial 3D DESS scans were acquired in the lower thigh of a healthy volunteer in a 7 Tesla scanner (Terra, Siemens Healthineers USA) with a 28-channel coil (QED) and at 3 Tesla with a 4-channel wrap-around coil. DESS is a gradient-spoiled steady-state sequence that acquires two echoes every repetition time, one before the spoiler gradient, having mostly a T1/T2 contrast, and the other after the spoiler gradient, having a predominantly T2-weighted contrast as well as diffusion contrast if the spoiler gradient is large (Figure 1)3,4. We used a variant of the sequence for quantitative analysis (qDESS), where the two echoes are reconstructed into separate images. Comparing the images has been demonstrated to enable quantitative tissue estimates5,6. The parameters of the 7T and 3T scans were as shown in Figure 2. Fat was suppressed using a water-selective 1-2-1- binomial pulse.To investigate the ability to obtain quantitative ADC maps at 7T, the sequence was next run twice in a patient with peripheral neuropathy, once with a small spoiler gradient moment of 23 mT/m · ms, giving low diffusion weighting, and once with a large gradient moment of 157 mT/m · ms, giving high diffusion weighting. By comparing the relative amplitudes of the resulting echoes to that predicted computationally using Extended Phase Graph (EPG) modeling, an estimate of the ADC was obtained. For a baseline comparison for the diffusion values, a standard 2D EPI scan with a b-value of 1000 s/mm2 and 20 diffusion directions was acquired with a pixel size of 1.4×1.4 mm2 and a scan time of 4:49 minutes. A slice displaying the sciatic nerve was investigated in the patient by drawing ROIs covering some of the larger individual sciatic nerve fascicles, plotting the qDESS ADC values on the y-axis and the EPI DWI values on the x-axis and performing regression analysis.
Results
Sample images, from the first DESS echo, showing the comparison between 3T and 7T in the healthy volunteer are shown in Figure 3. The sciatic nerve fascicles are clearly visible in the 7T image but are difficult to distinguish in the 3T image. In spite of the larger voxel size, the 3T data are noisier. The 7T image displays pulsation artifacts in the femoral artery, but this does not affect the nerve structure visualization due to the A/P phase-encoding direction used. Figure 4 shows sample maps from the two ADC estimation methods of qDESS and EPI DWI. The EPI DWI map clearly suffers from low resolution and distortion, resulting in less image detail, but nonetheless large-scale structural similarities can be observed. Figure 5 shows that the qDESS ADC estimates, plotted as a function of the DWI EPI ADC estimates, broadly follow a linear curve, although some outliers are present. The best fit line had the form y = 0.82x + 0.28 with R2 = 0.49.Discussion
The results in Figure 3 demonstrate that using steady-state imaging at 7 Tesla with a 28-channel QED coil can yield sharp images of peripheral nerve structures with less than 150 μm resolution, allowing differentiation of individual nerve fascicles. Figures 4-5 show that the qDESS sequence can provide ADC maps in good agreement with conventional maps. Additionally, the 150 μm resolution of the qDESS sequence gives higher detail, enabling investigation of ADC in small fascicles. Unlike the EPI DWI map, these have low distortion, a highly desirable trait at 7T. Future research could investigate using qDESS for obtaining other quantitative map types at 7T using the same scan protocol, such as fat-water fraction and T2 relaxation7.Conclusion
Low-distortion anatomical images and ADC maps of individual sciatic nerve fascicles can be obtained at 7 Tesla using the qDESS sequence and a 28-channel QED coil.Acknowledgements
Imaging was performed at the Athinoula A. Martinos Center for Biomedical Imaging at the Massachusetts General Hospital using resources provided by the Center for Functional Neuroimaging Technologies (P41EB015896) and the Center for Mesoscale Mapping (P41EB030006), Biotechnology Resource Grants supported by the National Institute of Biomedical Imaging and Bioengineering, National Institutes of Health (NIH). The NIH also provided support through grants R01EB027779 and R01EB028797. Support was also provided by the Advanced Research Projects Agency-Energy (ARPA-E), U.S. Department of Energy, under Award Number DE-AR0000823 and by the American Academy of Neurology. This research was also supported in part by the MGH/HST Athinoula A. Martinos Center for Biomedical Imaging.References
[1] Vaeggemose Muscle and Nerve 2017; [2] Yoon Muscle Nerve 2017; [3] Bruder MRM 1988; [4] Redpath MRM 1988; [5] Staroswiecki MRM 2012; [6] Bieri MRM 2012; [7] Chaudhari JMRI 2018;Figures
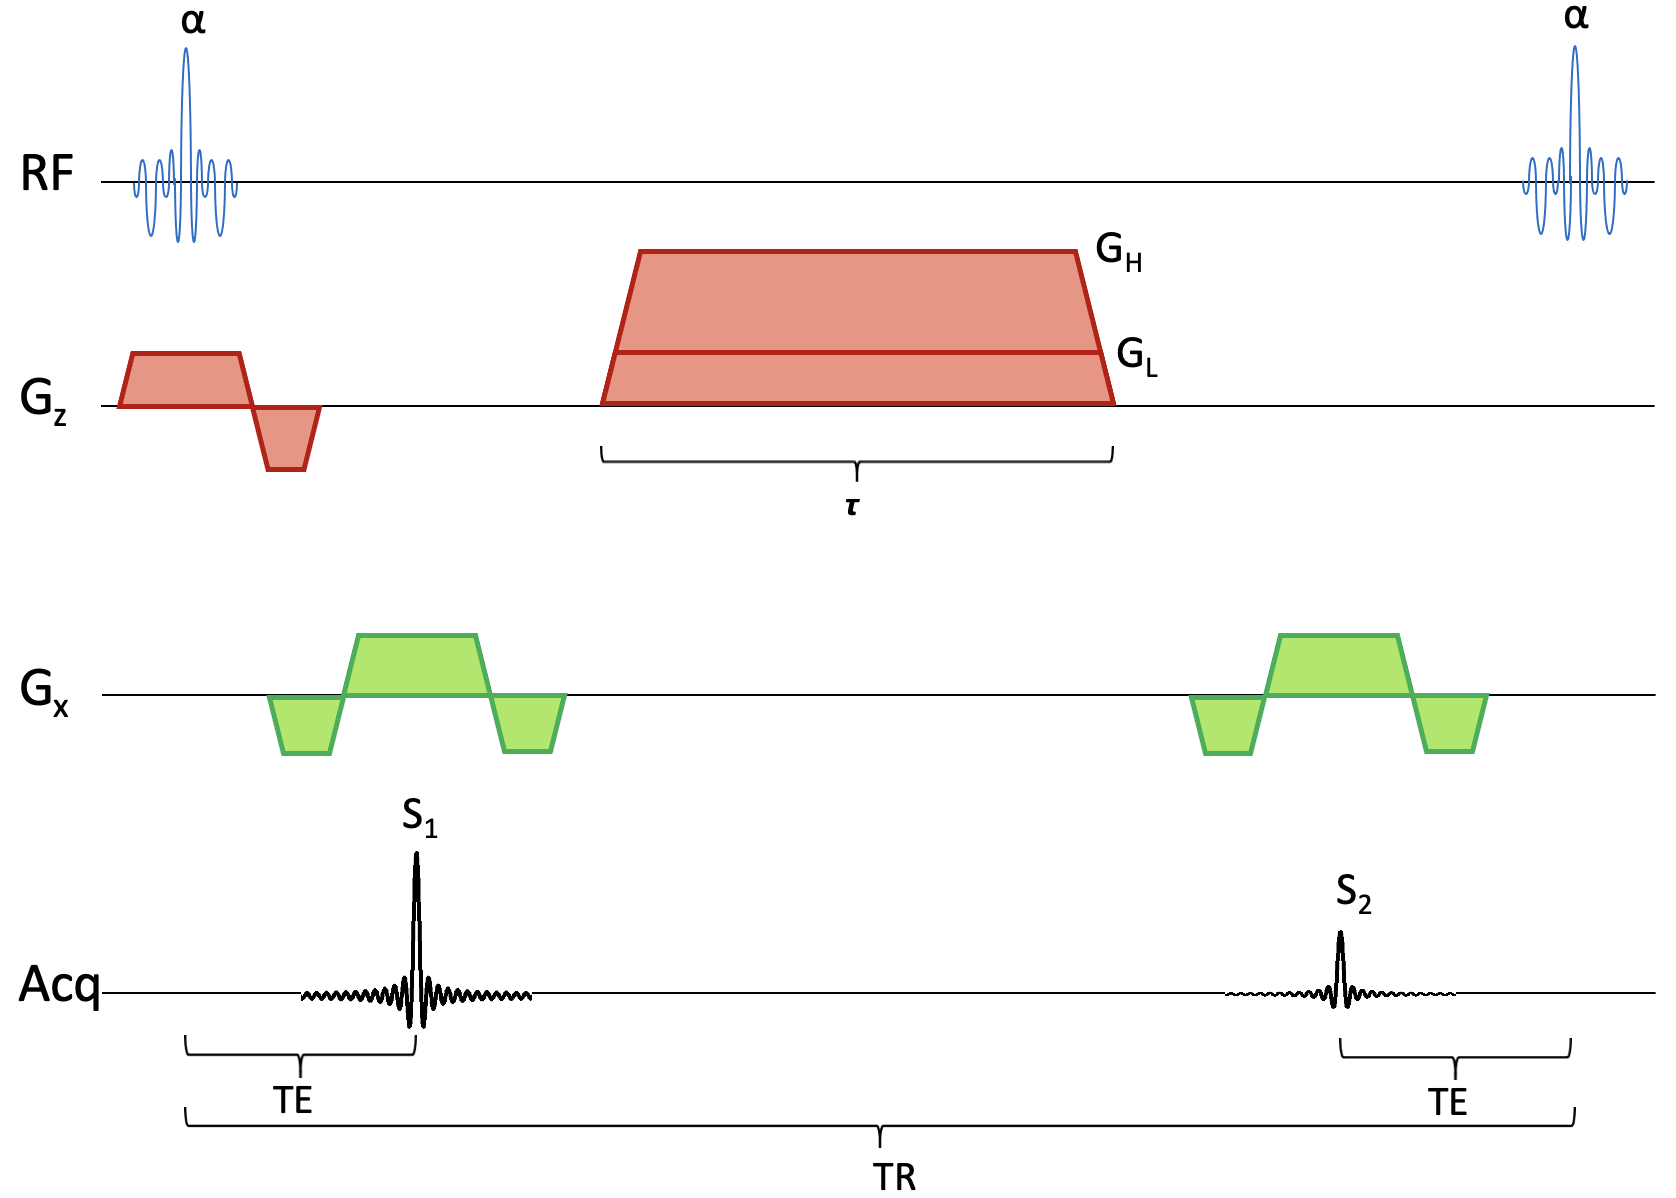
Sequence diagram for the qDESS sequence. The sequence has a spoiler gradient with duration τ. During each repetition time, a signal S1 is collected before a spoiler gradient and another signal S2 collected after the gradient. If the gradient has a large amplitude GH then S2 will have diffusion weighting, if it has a small amplitude GL, S2 will primarily have T2 weighting. The radiofrequency pulses, giving a flip angle of α, use a spectral-spatial water-selective excitation.
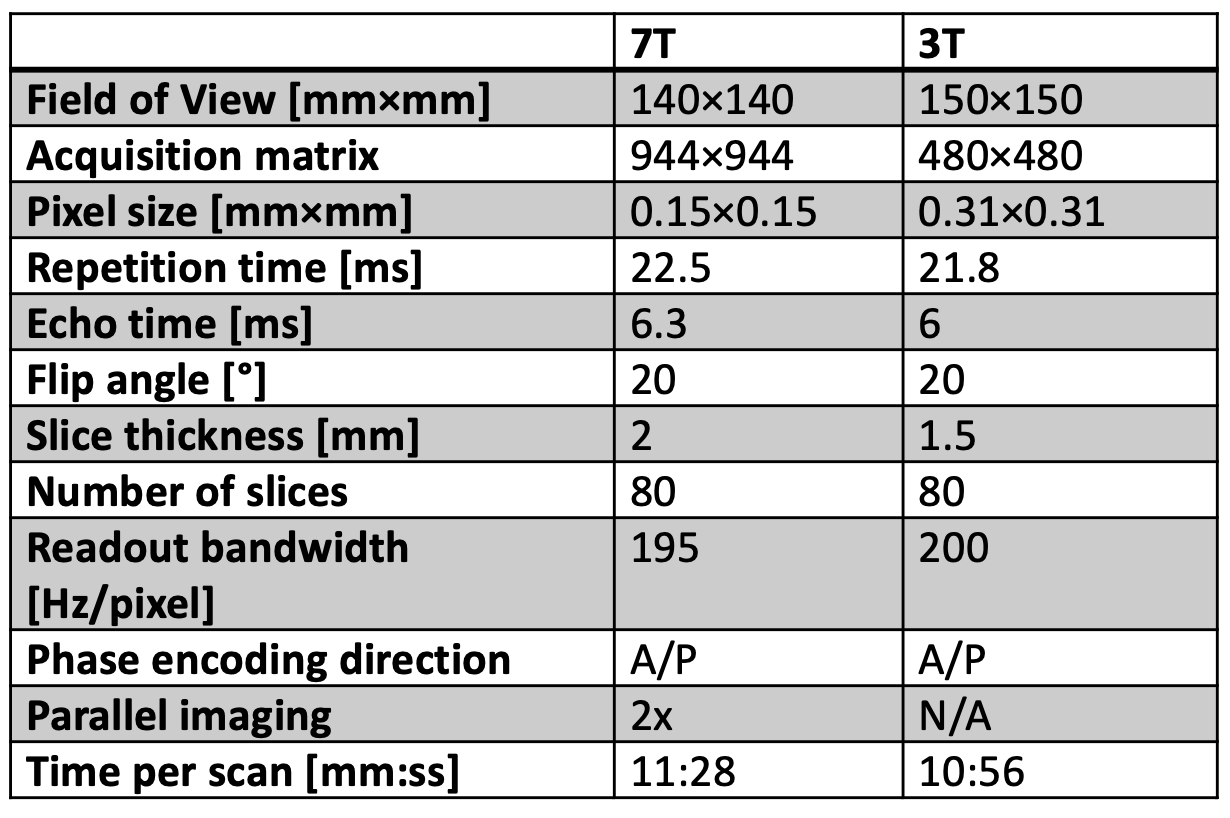
Figure 2: Table showing DESS scan parameters.
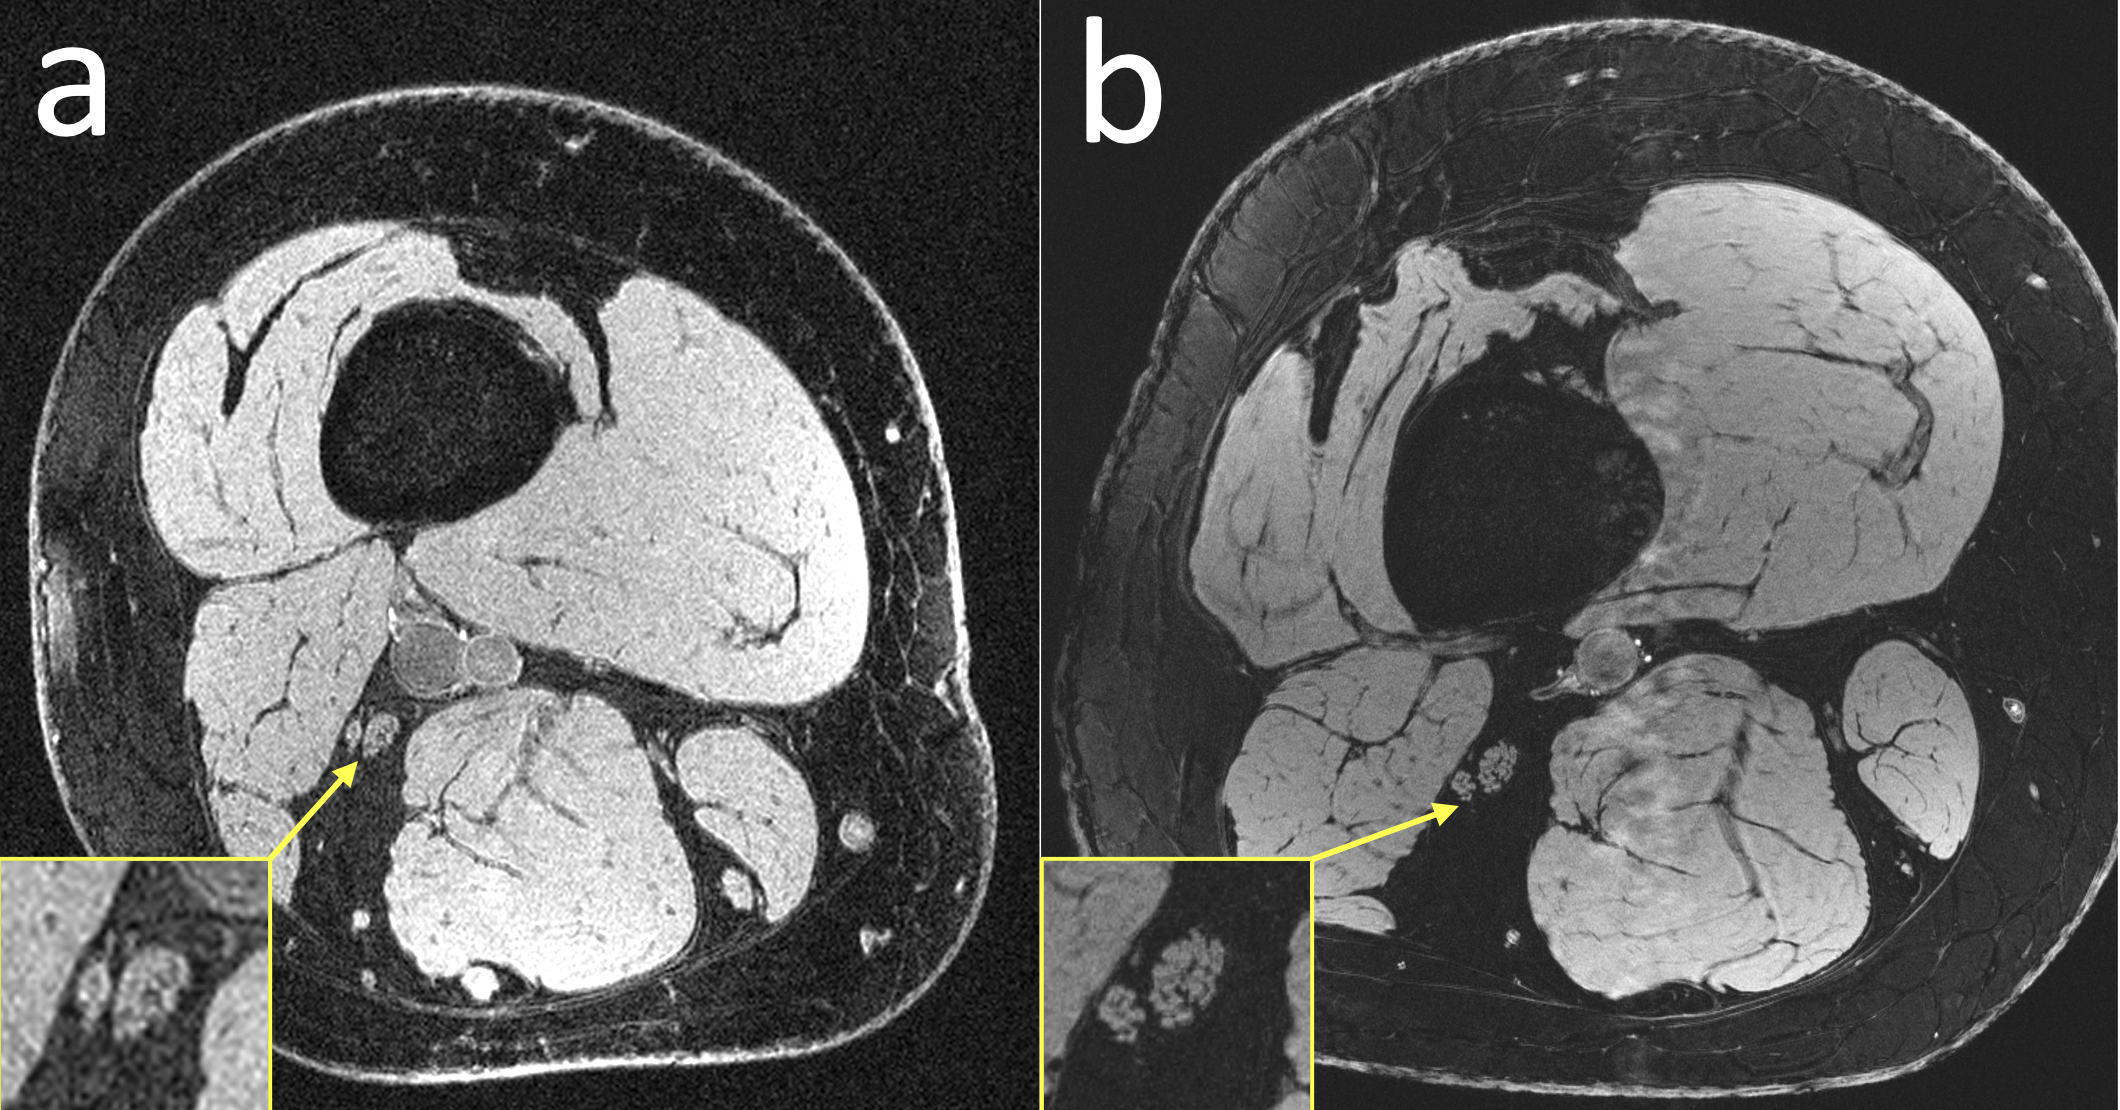
Figure 3: Anatomical comparison of a healthy subject scanned (a) at 3T with a 4-channel coil that wrapped around the thigh and (b) at 7T with a 28-channel QED coil. The individual fascicles of the sciatic nerves are clearly visible in the 7T image, but are more difficult to make out in the 3T image.
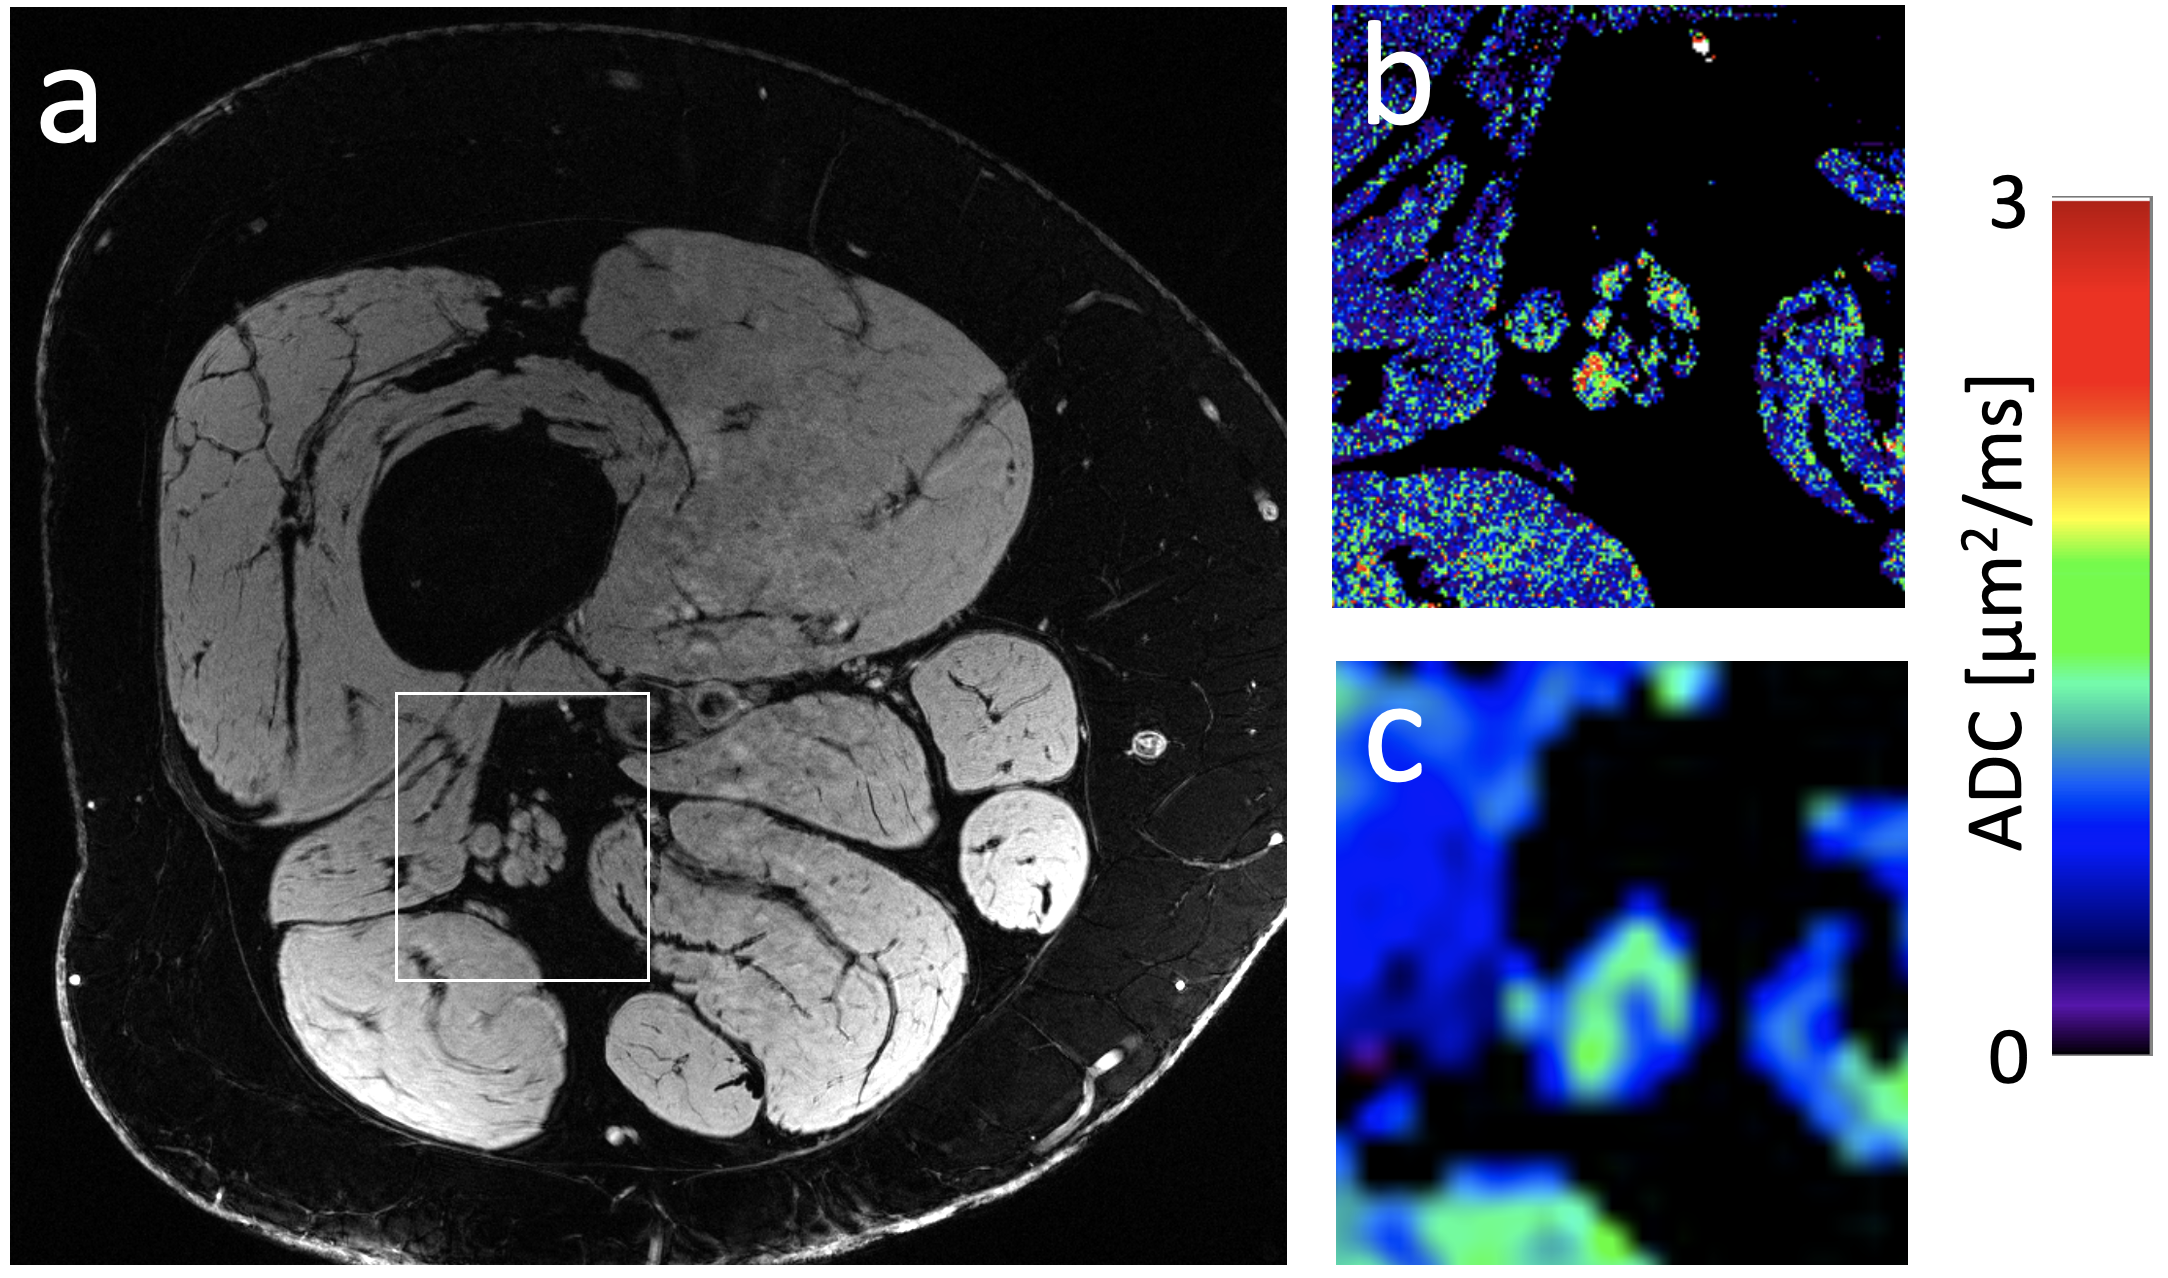
Figure 4: (a) A 7T image of a subject with peripheral neuropathy and (b) a DESS ADC map computed in the framed section of panel a. (c) A conventional EPI DWI diffusion map for comparison. The EPI map not only has worse resolution but also has severe distortion.
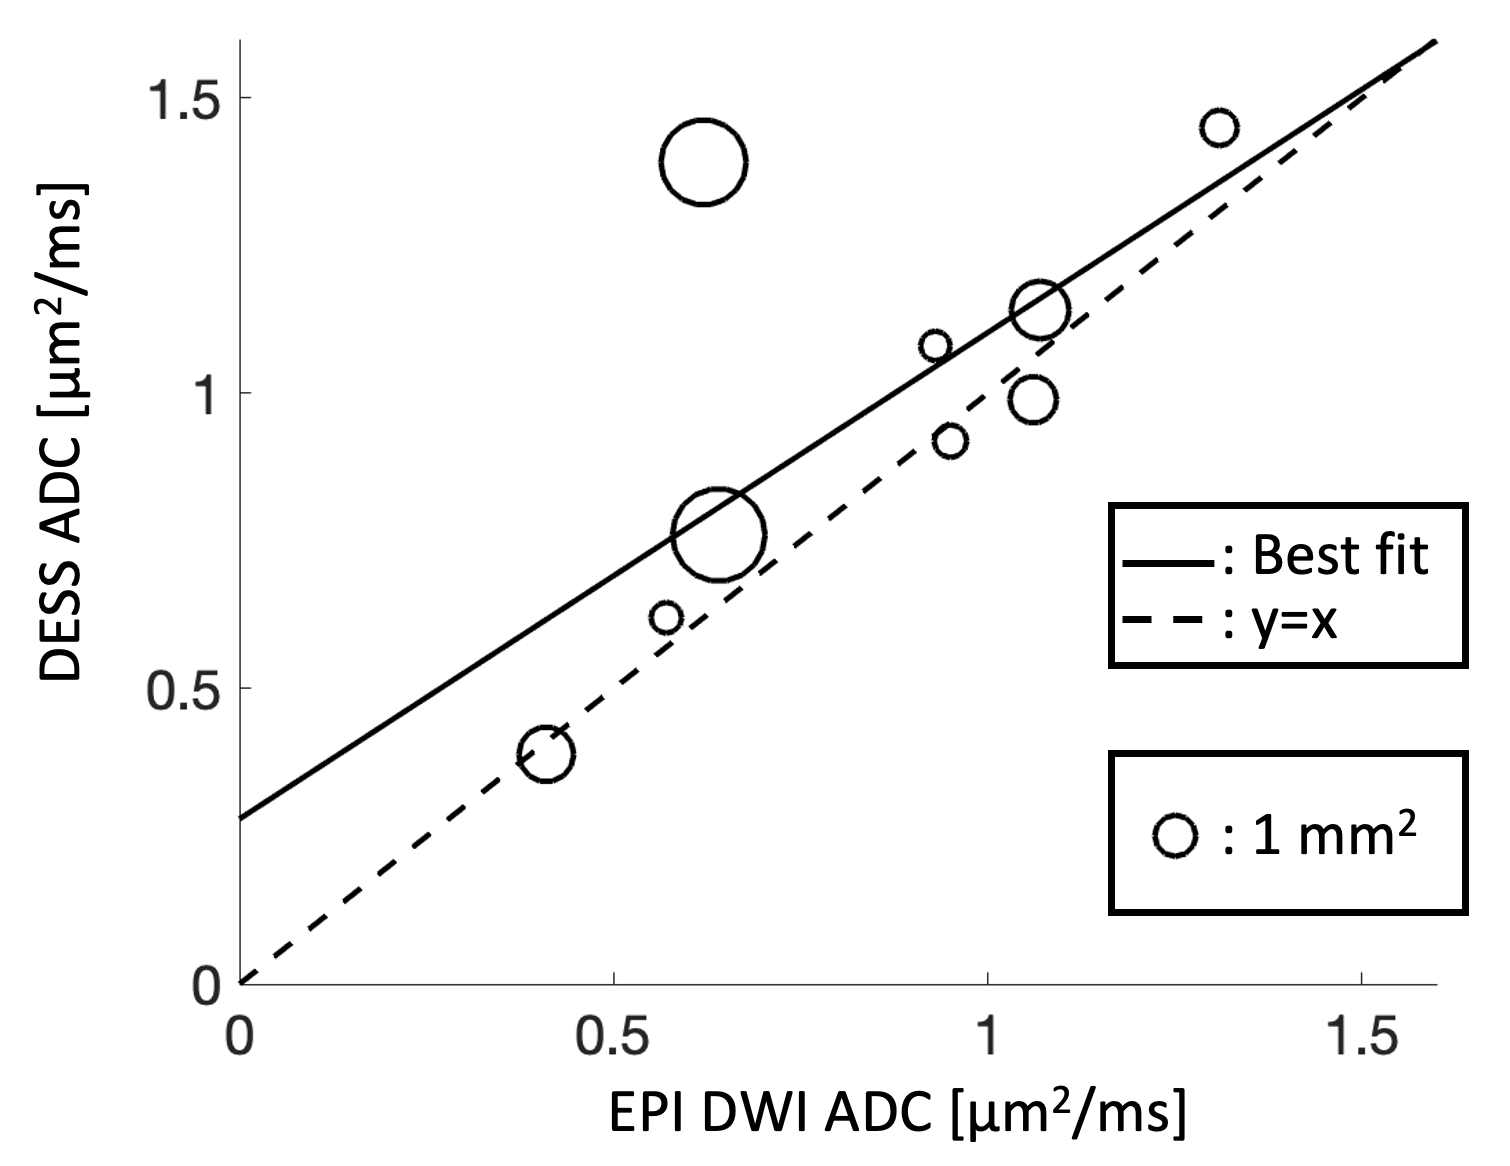
Figure 5: The diffusion estimates of individual sciatic nerve fascicles, with the conventional EPI DWI estimate on the x-axis and the DESS estimate on the y-axis. The size of each datapoint represents the cross-sectional area of the fascicle. The best fit line (solid) had the form y=0.82x + 0.28 with R2 = 0.49.