3399
Numerical simulations to investigate the contribution of arteries and veins to the relative BOLD-fMRI signal change by means of SO2 and CBV changes
Mario Gilberto Baez-Yanez1, Alex Bhogal1, Wouter Schellekens1, Jeroen C.W. Siero1,2, and Natalia Petridou1
1Department of Radiology, Center for Image Sciences, University Medical Center Utrecht, Utrecht, Netherlands, 2Spinoza Centre for Neuroimaging Amsterdam, Amsterdam, Netherlands
1Department of Radiology, Center for Image Sciences, University Medical Center Utrecht, Utrecht, Netherlands, 2Spinoza Centre for Neuroimaging Amsterdam, Amsterdam, Netherlands
Synopsis
The administration of CO2/O2 gas-challenges during BOLD-fMRI is appealing due to the hemodynamic impact these stimuli have. With the support of computational modeling, arterial gas manipulations can provide a means to separate neuro-vascular signal contributions. Hence, we performed simulations in virtual vascular architectures for different blood volumes and oxygen saturation levels. The effect that these states have on the magnetic field was simulated, separately, for arteries and veins. We present look-up tables to derive the possible vascular contribution responsible for measured BOLD signals in clinical or research fMRI settings including changes in local blood volume, oxygen metabolism or cereberovascular diseases.
Introduction
Blood-oxygenation-level-dependent (BOLD) fMRI is widely used to study brain function. However, the BOLD-fMRI signal represents an integration of several hemodynamic parameters and therefore provides only indirect information on neuronal functioning[1]. To disentangle hemodynamic parameters -cerebral blood volume(CBV) and oxygen saturation(SO2)-, studies have explored the use of gas-challenges to manipulate vessel caliber(CBV, modulated by CO2) and hemoglobin saturation state(O2)[2,9,10]. Nonetheless, arterial gas manipulations alone are insufficient to understand the relationship between vascular properties and the resulting hemodynamic signals. For this, computational modeling is necessary. This work aims to simulate the BOLD-fMRI signal change for different CBV and SO2 changes based on virtual vascular networks. We present look-up tables that determine the possible arterial/venous contributions to CO2/O2-inspired BOLD-fMRI signal changes for gradient-echo(GE) and spin-echo(SE) at 7T.Methods
We computed the relative BOLD-fMRI signal change in two vascular models. (1) We simulated susceptibility and diffusion effects in an artificial vascular network(AVN) to validate our computational method. (2) We created a representative realistic vascular network(RVN) to simulate susceptibility effects for arteries and veins. Randomly oriented cylinders represent the AVN for vessel sizes ranging from 1µm-100µm fulfilling a specific volume fraction in an isotropic voxel of 1mm3. Levels of SO2 ranging from 60-90% were separately imposed with a hematocrit level of 45%. Diffusion motion was simulated with a Monte Carlo method(1µm2/ms) and induced-dephasing was recorded for an ensemble of spins(1E9 spins) for GE-BOLD(TE=27ms) and SE-BOLD(TE=45ms) at 7T[3,4]. We adopted an SO2 of 60% as basal-state. To study vessel dilation effects, we use a basal CBV of 3%, and simulated CBV changes ranging from -33%(constriction) to 100%(dilation). Only extravascular effects were considered since intravascular contributions are assumed to be negligible at 7T[5]. An RVN was generated based on a modified mouse vascular network[6]; an artery-to-vein ratio of 3:1 was applied simulating the human cerebrovasculature[7]. Vectorial description of the RVN provides detailed information regarding the spatial distribution and vessel properties in an isotropic 1mm3 simulation voxel. The susceptibility-induced inhomogeneous magnetic field was computed assuming a separate contribution of arteries and veins. Variable SO2 levels for arteries and veins were simulated to examine the impact of each compartment to the BOLD-fMRI signal change. CBV changes in arteries and veins were investigated considering only an increase (dilation) in vessel radius. Based on the Fourier transform of the inhomogeneous magnetic field, we calculated the signal decay for GE-BOLD(TE=27ms) at 7T[8]. Since the Fourier method assumes a static dephasing regime, the contribution of capillaries can be superimposed assuming a weighted-microvascular contribution to the computed BOLD signal change. However, we only considered the contribution of the arterial and venous compartments.Results
Figure1 shows the simulation obtained with an AVN model for GE (top row) and SE (bottom row). Our computational method reproduces the well-known sensitivities of GE and SE to all and small vessels respectively, as reported in[3,4](Figure1.a;1.d). Simulation of changes in SO2 for different vessel sizes shows that about 10% or larger SO2 changes are necessary to saturate the BOLD-fMRI signal change for GE(Figure1.b). For SE, small vessel contribution to the BOLD-fMRI signal is relatively larger due to the refocusing pulse. Hence, larger SO2 changes are required to obtain a comparable GE-like BOLD-fMRI signal change(Figure1.e). GE has a high sensitivity to CBV changes(Figure1.c) in contrast to SE(Figure1.f). Figure2 displays the look-up tables of the BOLD-fMRI signal change in which several SO2 levels and CBV changes are simulated for arteries and veins (RVN model). A characteristic non-linear BOLD-fMRI signal behavior is displayed in Figure2.a which can be attributed to the arterial-to-venous ratio. Hence, reduction in arterial SO2 sets the negative BOLD-fMRI signal change; only with this condition set, the venous SO2 change also starts to play a role in showing negative BOLD responses. For null or increases in arterial SO2, the BOLD signal is positive for most of the venous SO2 changes. Figure2.b displays the impact of the SO2 and CBV change in the venous compartment while arterial SO2 and CBV is maintained. Figure2.c shows the absolute difference between the arterial basal-state(Figure2.b) and the dilated arterial compartment(dilation of 12.5%, 25%, 37.5% and 50%), while keeping constant the SO2(98%), for different CBV and SO2 changes in the venous compartment. Arterial dilation affects the BOLD signal only when the degree of dilation is considerable, i.e. dilation larger than 25% the intrinsic vessel size.Discussion / Conclusion
We present look-up tables for the relative BOLD-fMRI signal change for different hemodynamic parameters (i.e. CBV and SO2) to investigate the arterial and venous contribution in CO2/O2 gas-challenge fMRI experiment. Thus, we have performed simulations in artificial and realistic vascular models for several SO2 levels and CBV changes. Notably a non-linear relation between the contribution of arteries and veins is displayed by the RVN model. Larger contributions are obtained from the venous side for small SO2 and CBV changes. Arterial dilation affects the BOLD signal only when the degree of dilation is considerable, i.e. dilation larger than 25% the intrinsic vessel size. Relative BOLD signal changes (±5-10%) are reported [9,10] under controlled CO2/O2-gas stimulus in fMRI measurements. Given the presented look-up tables it may be possible to infer the vascular contributions to the measured BOLD signals and/or particular hemodynamic basal statesAcknowledgements
This work was supported by the National Institute of Mental Health of the National Institutes of Health under the Award Number R01MH111417References
[1] Ogawa, S. et al. Functional brain mapping by blood oxygenation level-dependent contrast magnetic resonance imaging. A comparison of signal characteristics with a biophysical model. Biophys. J. 1993; 64:803–812. [2] Faraco CC. et al. The cumulative influence of hyperoxia and hypercapnia on blood oxygenation and R*₂. J Cereb Blood Flow Metab. 2015; 35:2032-42. [3] Kiselev V.G., Posse S. Analytical model of susceptibility-induced MR signal dephasing: effect of diffusion in a microvascular network. Magn Reson Med 1999; 41:499-509. [4] Weisskoff, R., et al. Microscopic susceptibility variation and transverse relaxation: Theory and experiment. Magn. Reson. Med 1994; 31:601–610. [5] Uludag K. et al. An integrative model for neuronal activity-induced signal changes for gradient and spin echo functional imaging. Neuroimage 2009; 48:150-165. [6] Báez-Yáñez M.G. et al. A statistical 3D model of the human cortical vasculature to compute the hemodynamic fingerprint of the BOLD fMRI signal. bioRxiv 2020.10.05.326512 [7] Duvernoy, H.M. et al. Cortical blood vessels of the human brain. Brain Res. Bull. 1981; 7:519–579 [8] Ziener C. et al. Frequency distribution and signal formation around a vessel. Magn Res Mat in Phys, Bio and Med 2005; 225-230 [9] Bhogal A. et al. Investigating the non-linearity of the BOLD cerebrovascular reactivity response to targeted hypo/hypercapnia at 7T. Neuroimage 2014; 98:296-305 [10] Schellekens W. et al. Vascular and neurovascular effects on micro- and macro-vascular compartments in human visual cortex. Proceedings of the ISMRM 2020. Abstract 3831.Figures
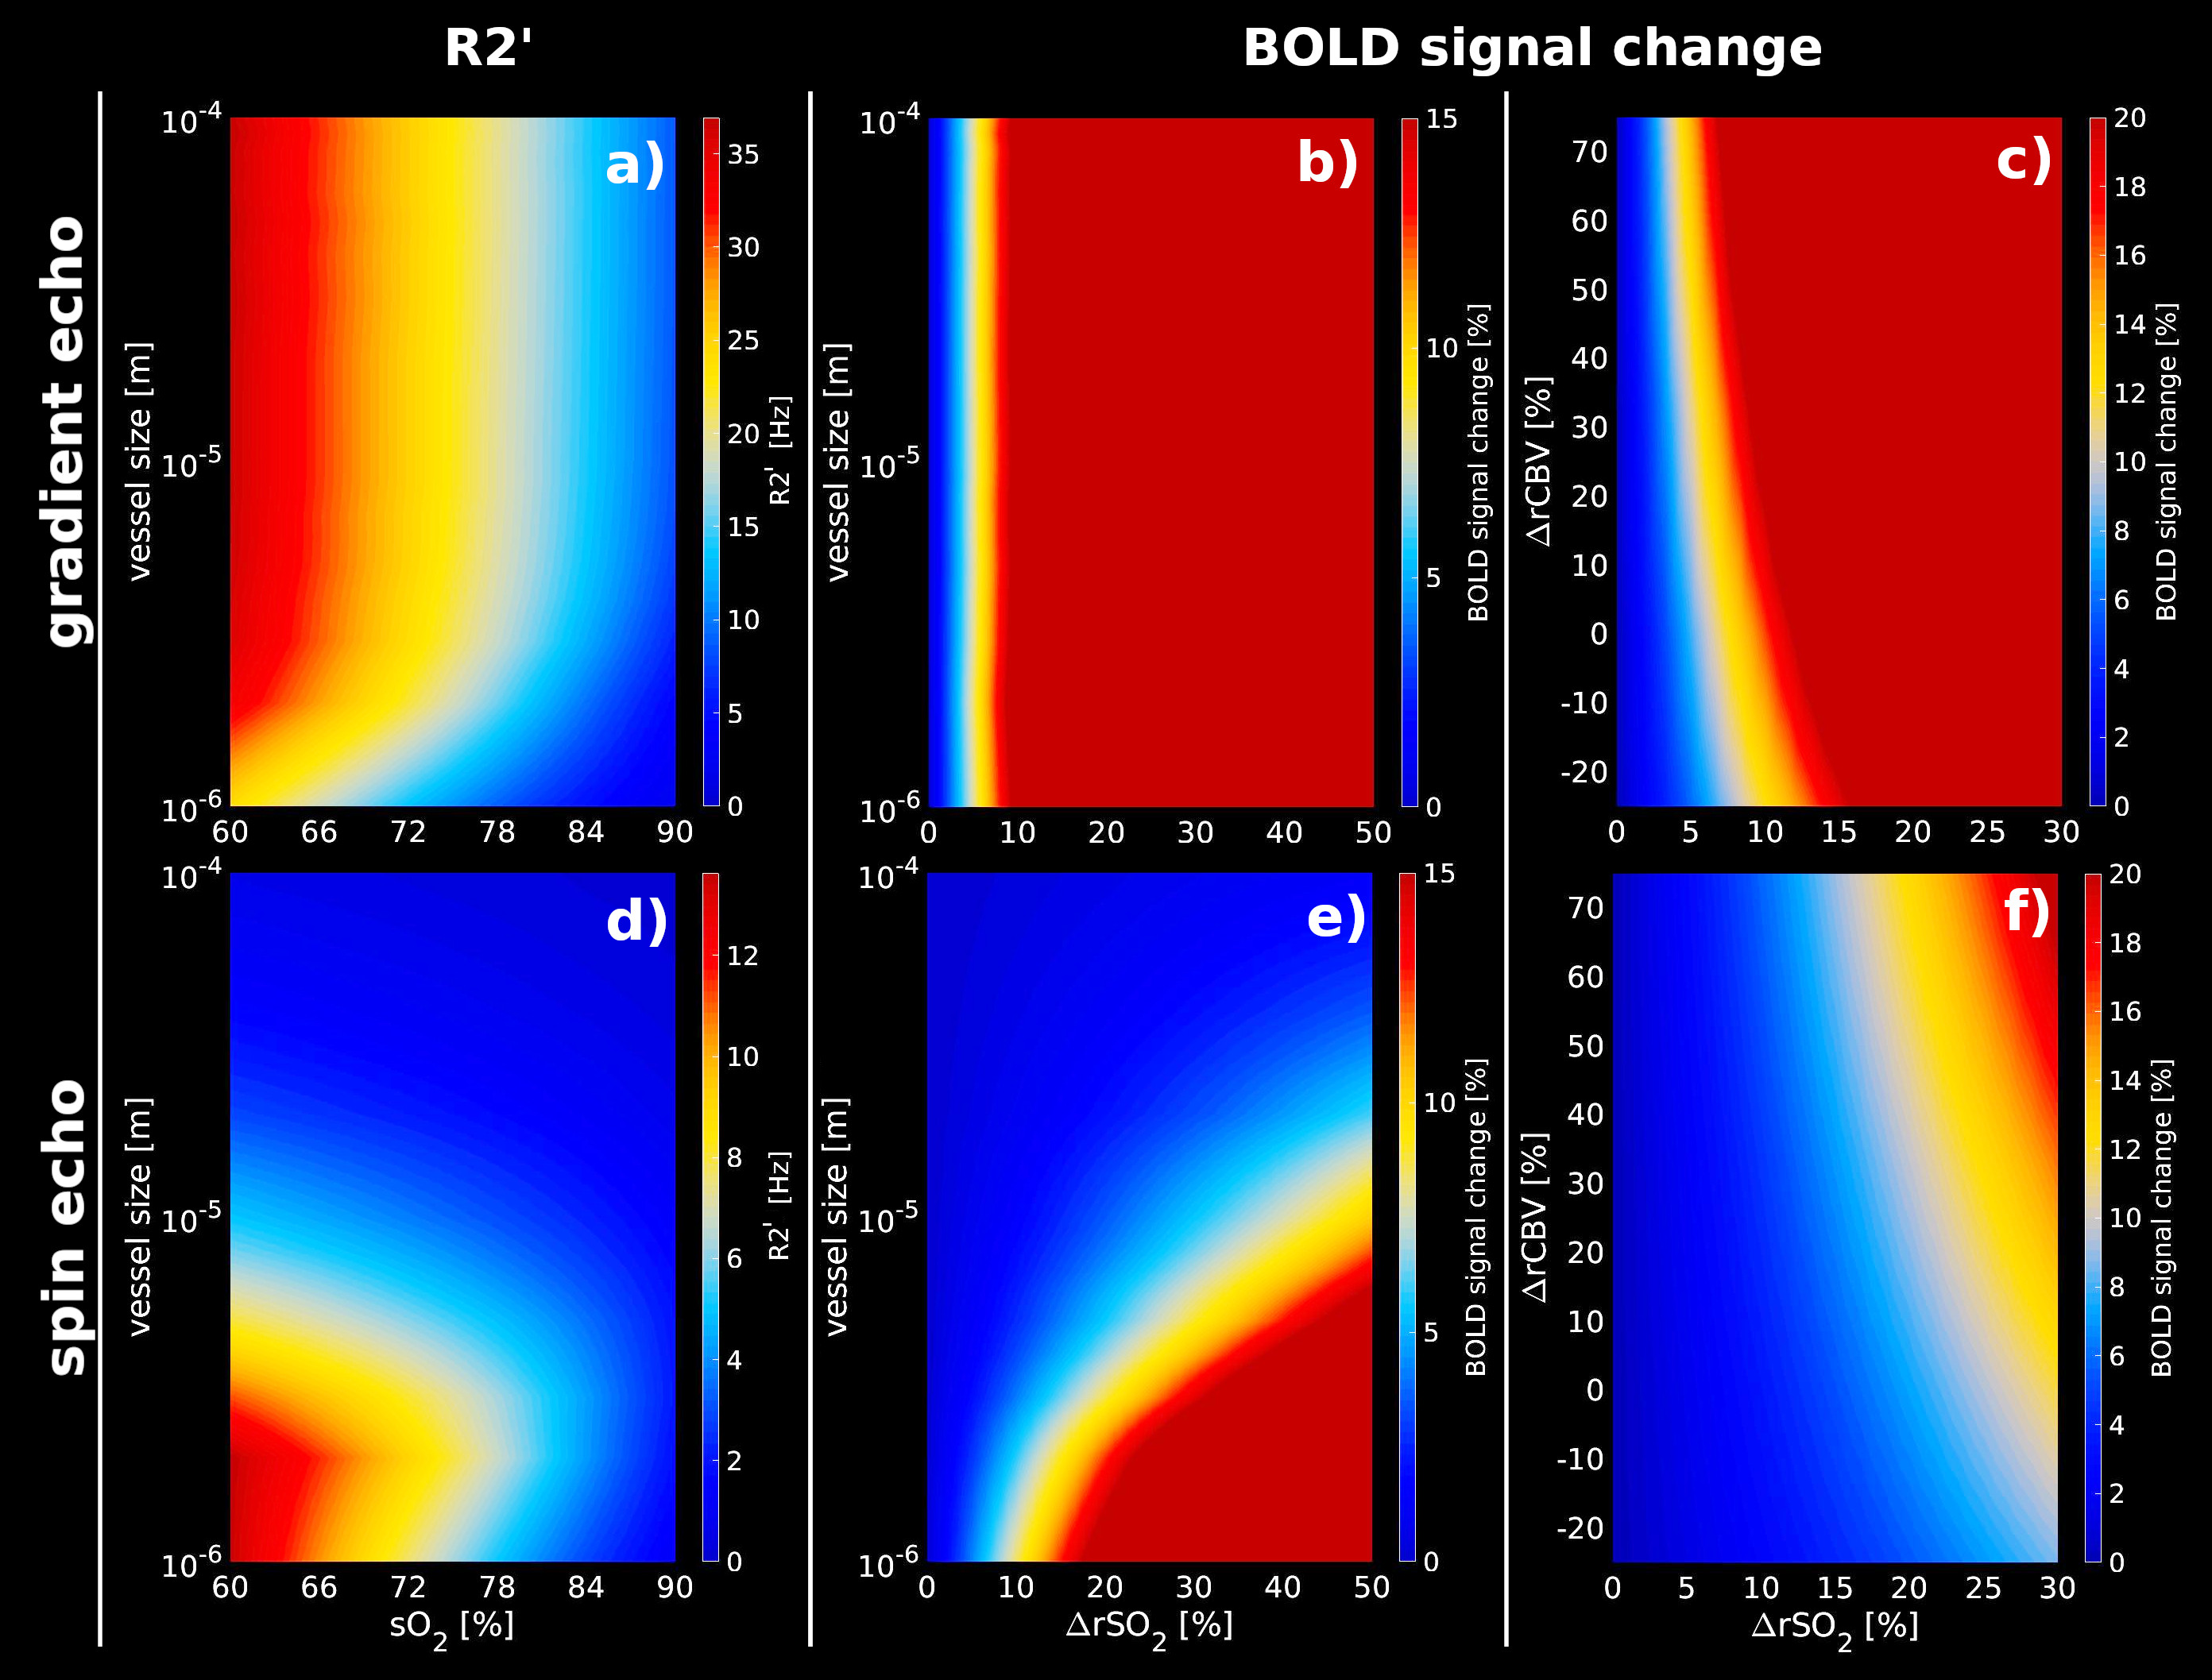
R2’
and relative BOLD-fMRI signal changes obtained from an artificial
vascular network for GE and SE at 7T assuming different SO2
and CBV changes. (a, d)R2’ calculated for different vessel sizes
–ranging from 1µm to 100µm- for GE(TE=27ms) and SE(TE=45ms).
(b, e)relative BOLD-fMRI signal change for different vessel sizes
and increments of SO2
levels for GE and SE. (c, f) relative BOLD-fMRI signal change
assuming CBV changes for GE and SE, respectively. GE shows a higher
sensitivity to small volume changes with respect to small SO2
changes in contrast to SE.
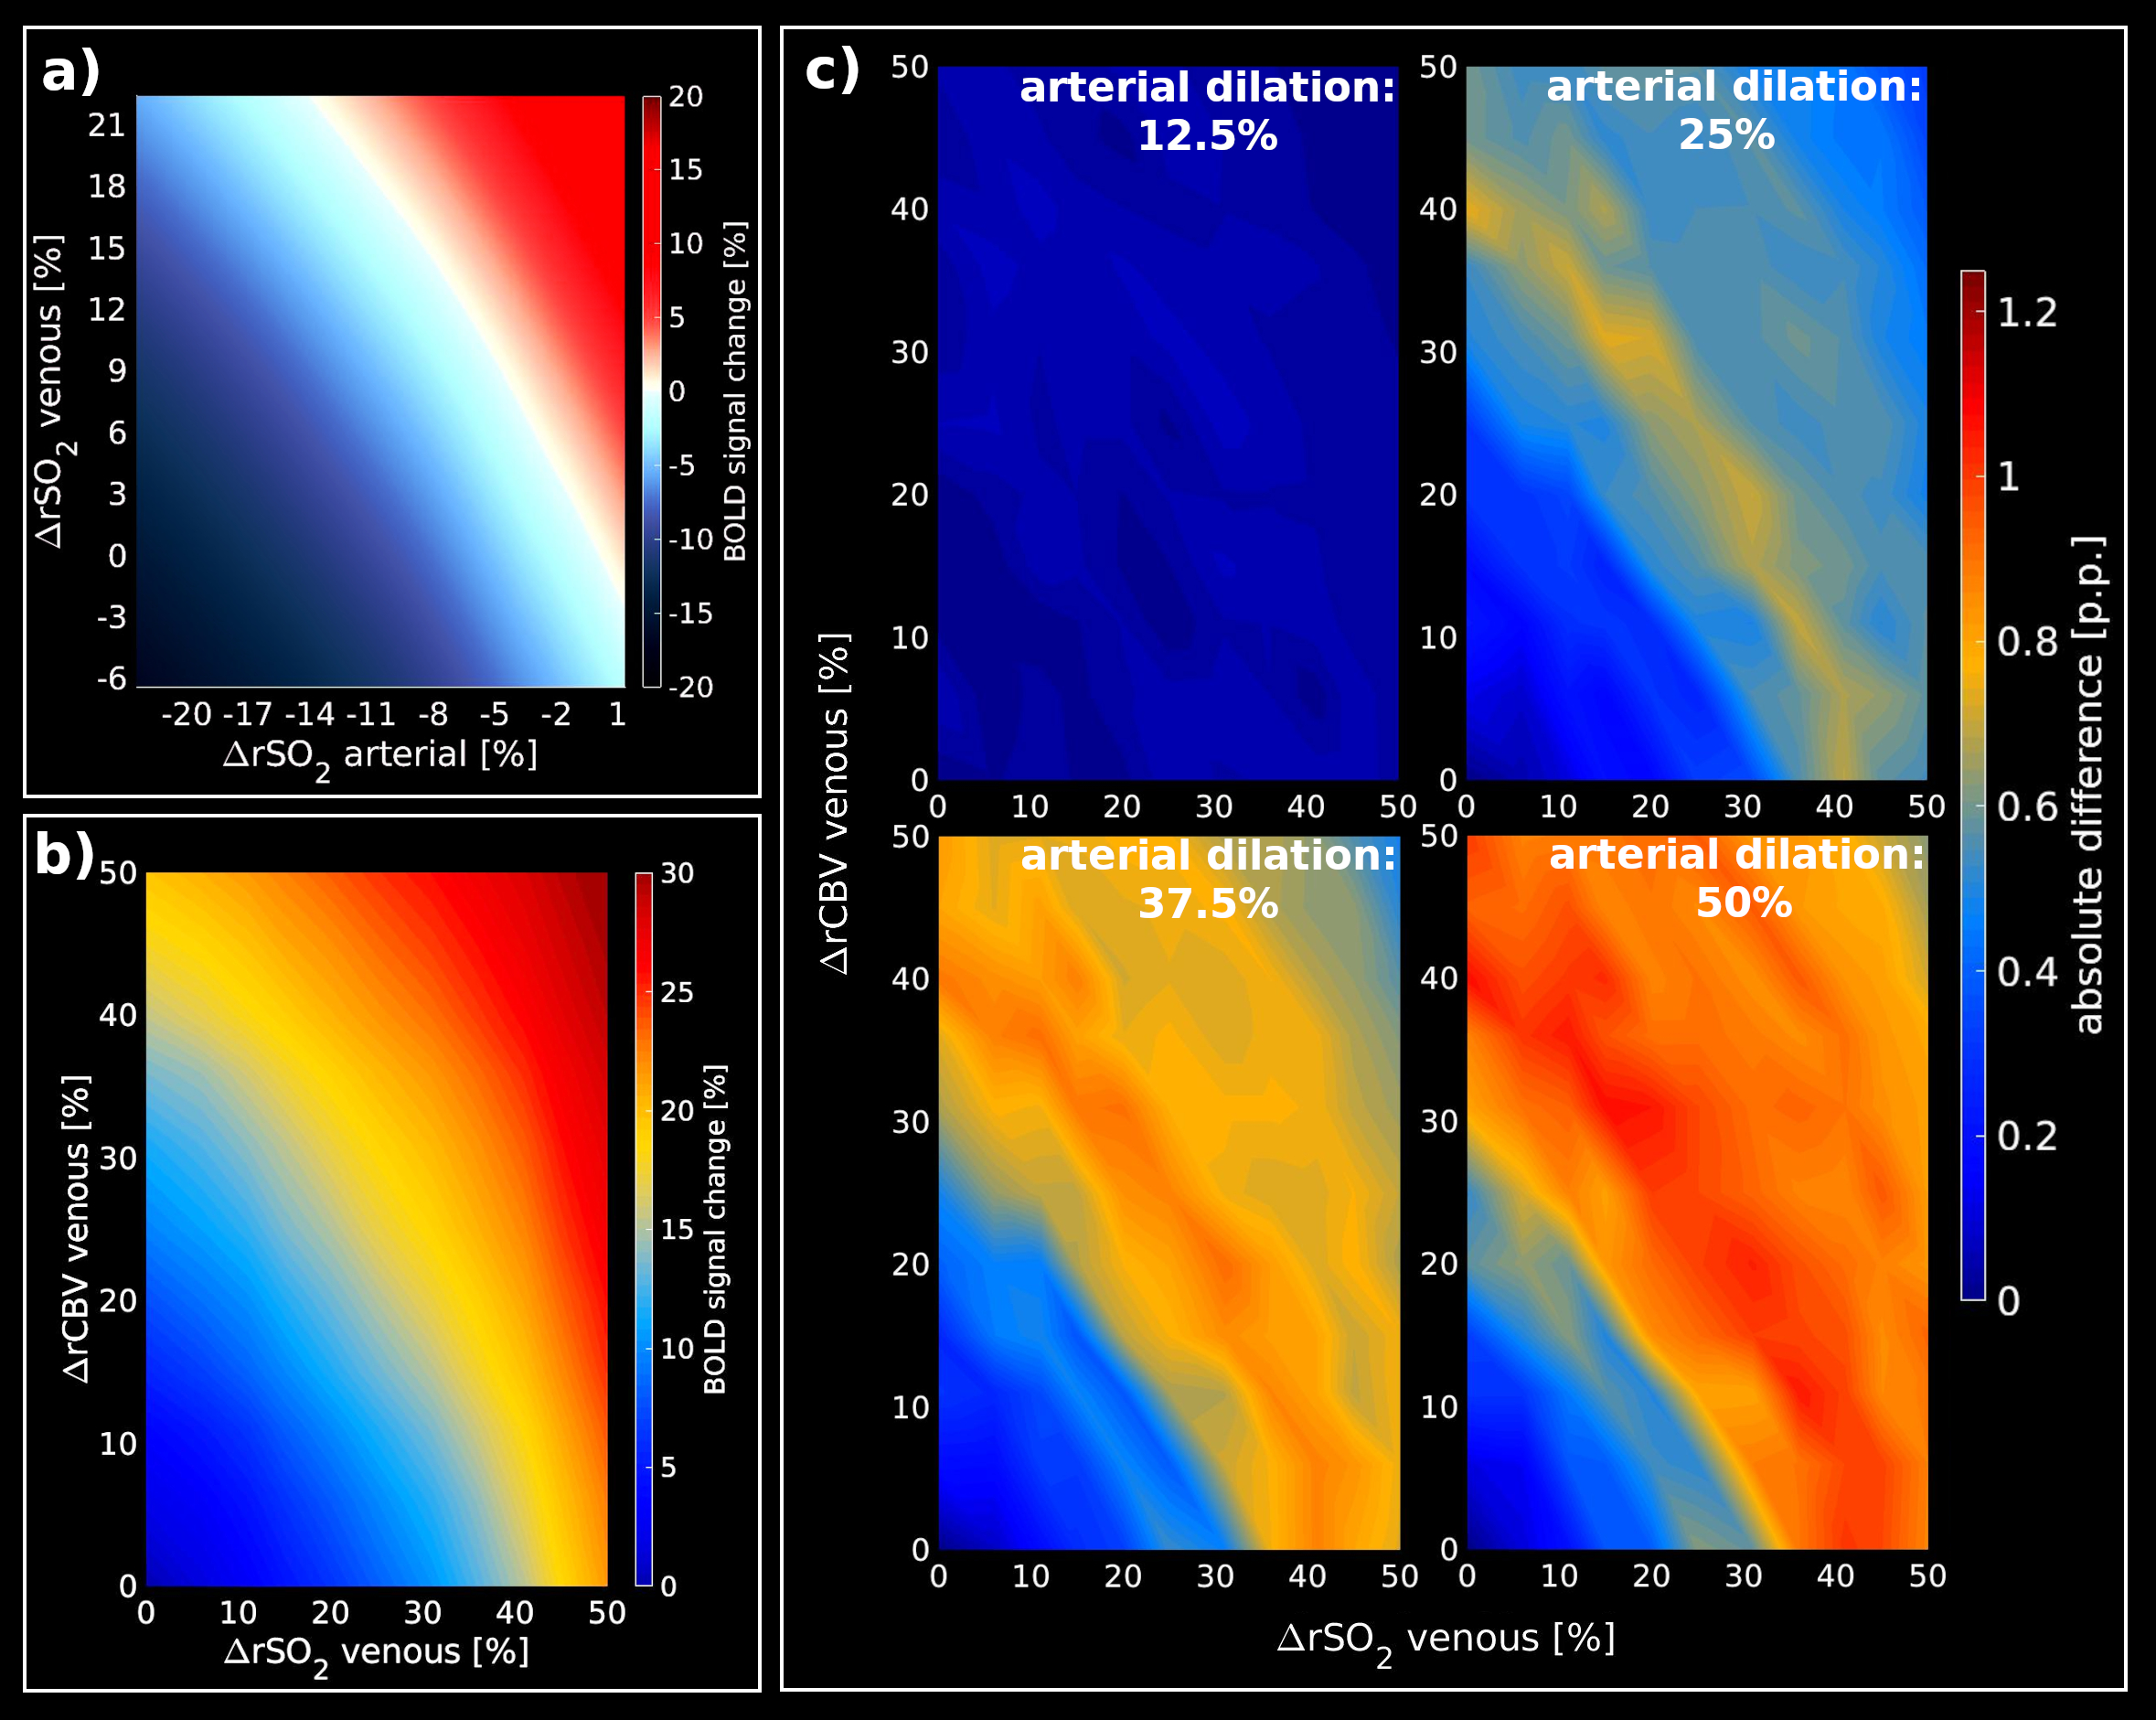
Look-up
tables obtained from a representative RVN model. (a)
shows the relative BOLD-fMRI signal change assuming SO2
changes for arteries and veins, separately, while CBV is kept constant (arterial basal SO2=98%;
venous basal SO2=60%).
(b) Look-up table for different SO2/CBV
changes in the venous compartment assuming an arterial basal-state
(arterial SO2=98%,
arterial dilation=0%). (c) show the absolute difference between the
basal-state (b) and different percentages of arterial dilation states
(12.5%, 25%, 37.5%, 50%) while the arterial SO2
is constant at 98%.