3315
In vivo $$$T_1$$$ quantification at 0.1 T using a fast, interleaved Look-Locker based $$$T_1$$$ mapping sequence.1Center for Adapatable MRI Technology (AMT center), Department of Biomedical Engineering, University of Basel, Allschwil, Switzerland, 2Department of Physics, University of Pavia, Pavia, Italy
Synopsis
$$$T_1$$$ mapping in MRI can be employed in a variety of techniques for diagnosis and treatment follow-up, but generally suffers from long acquisition times. Little effort has been put in low magnetic field regimes, where sensitivity is further impeded. Nevertheless, low field provides higher $$$T_1$$$ dispersion and favours adaptable scanner designs, suitable for dedicated applications such as MRI of body extremities. Here, we assess our newly developed interleaved, Look-Locker based $$$T_1$$$ mapping sequence in calibrated samples, and we present a first in vivo $$$T_1$$$ map of a volunteer’s hand at 0.1 T.
Introduction
Low field is gaining popularity within the MRI community, with potential to provide lower costs, simpler installation and maintenance1,2,3. In particular, the increased flexibility regarding scanner geometries and designs, along with the improved patient comfort make low field MRI an appealing choice when it comes to imaging the musculoskeletal (MSK) system and body extremities4,5. Lower magnetic fields can also be an asset to reduce the susceptibility artifacts generated at the tissue-bone interface6, or caused by magnetic implants and joint prostheses7. Quantitative MRI has proven valuable in a wide range of MSK diagnosis and treatments8. $$$T_2$$$ relaxation maps have shown promising results to assess disease involvement in Duchenne muscular dystrophy9. $$$T_1$$$ relaxation was found to be a good predictor of bone strength10, and $$$T_1$$$ maps are clinically useful to determine the glycosaminoglycan content in cartilage11. Given the linear dependence on temperature12, $$$T_1$$$ can also represent an alternative to proton resonance frequency shift for temperature mapping, for instance in MR-guided focused ultrasound for thermal therapies13 and pain alleviation14. Despite naturally benefiting from increased $$$T_1$$$ dispersion15, quantitative mapping techniques have not yet been extensively explored within the low field regime. Here we investigate the use of a multi-slice, interleaved, Look-Locker-based 2D-GRE sequence for $$$T_1$$$ mapping at 0.1 T. The accuracy of the $$$T_1$$$ estimation was initially assessed in calibrated samples, before further assessing the feasibility of the technique in vivo in a healthy volunteer’s hand.Material & Methods
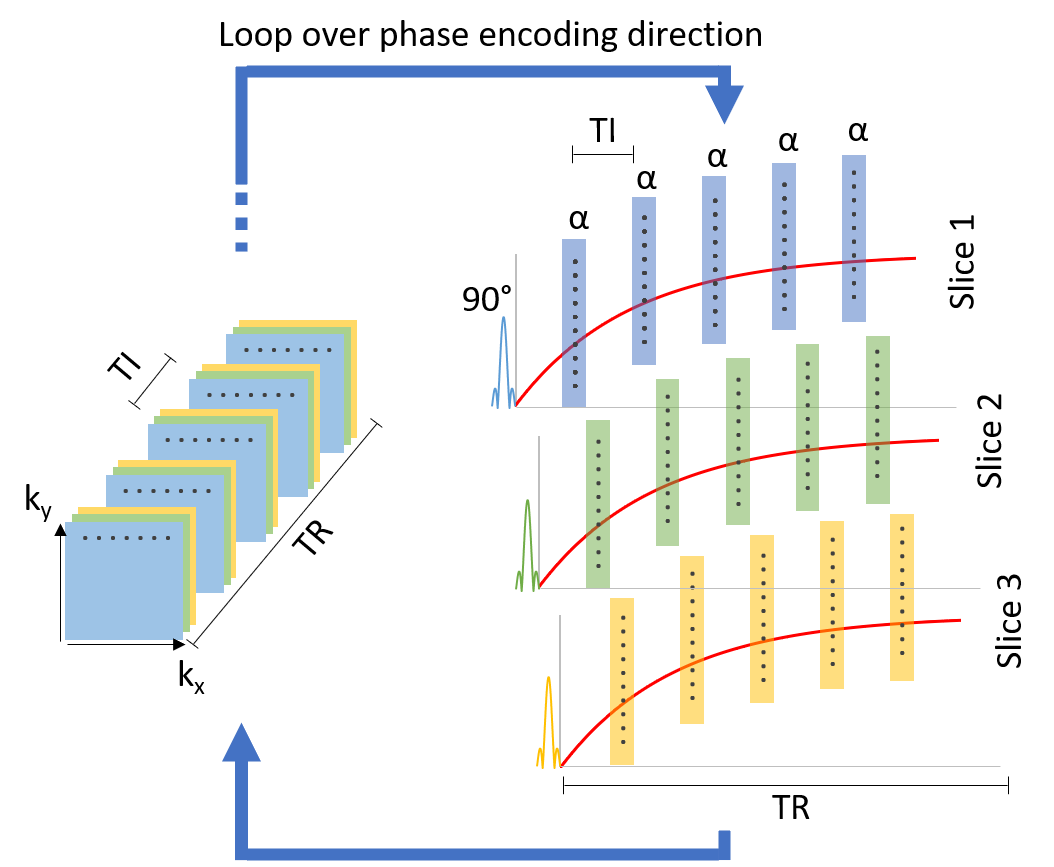
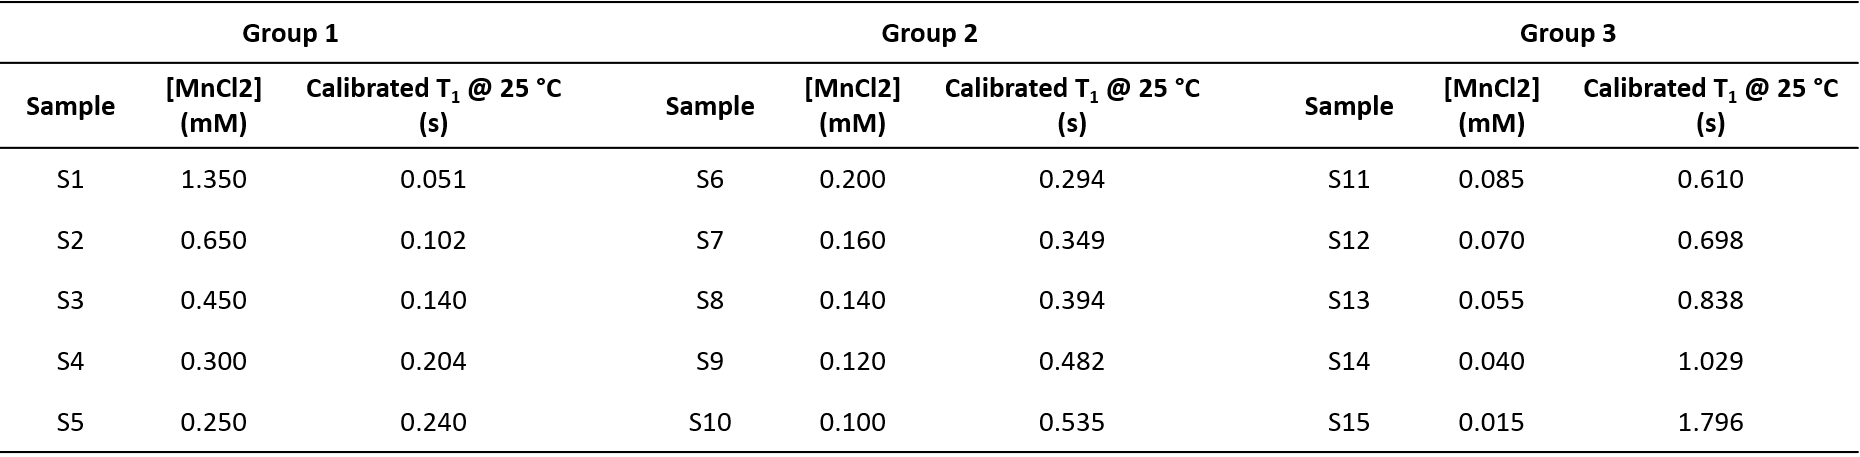
The proposed multi-slice, interleaved, Look-Locker-based 2D-GRE sequence16 is presented in Fig. 1. The sequence was initially tested on 15 previously calibrated samples (water + MnCl2), subdivided into three groups (Fig. 2). A first saturation pulse was followed by a set of $$$\alpha$$$ pulses (nominal value 5 °), spaced by TI = 0.05 s. 39 images were acquired for each batch (TR/TE = 2000/5.305 ms, in-plane resolution = 3x3 mm2, slice thickness = 20 mm, matrix = 64x35x3, 70 % sampling in phase encoding direction, pixel bandwidth = 312 Hz). The whole acquisition process took 150 s for 3 averages. $$$T_1$$$ reconstruction was performed in a pixel-wise manner using the following model:$$M_z(t) = M_0^*(1-e^{-t/T_1^*}),$$
where$$$M_z$$$ and $$$M_0^*$$$ are the net longitudinal magnetisation at time t and after full recovery. $$$T_1^*$$$ is the apparent relaxation typical of the Look-Locker approach. $$$T_1$$$ can be inferred by inserting $$$T_1^*$$$ in the following equation:
$$\frac{1}{T_1}=\frac{1}{T_1^*}+\frac{\ln(\cos\alpha)}{TI}.$$
A flip angle map (separately acquired) was used to account for $$$B_1$$$ inhomogeneities17. The same sequence was employed for the in vivo acquisition of $$$T_1$$$ maps of a volunteer’s hand. Here, TI = 25 ms was chosen, leading to a stack of 79 images. In this case, 12 averages were used, for a total scan time of 600 s. All images were acquired using a resistive biplanar MRI system (Bouhnik S.A.S., France) operating at 0.1 T. No magnetic nor radiofrequency shielding was applied.
Results
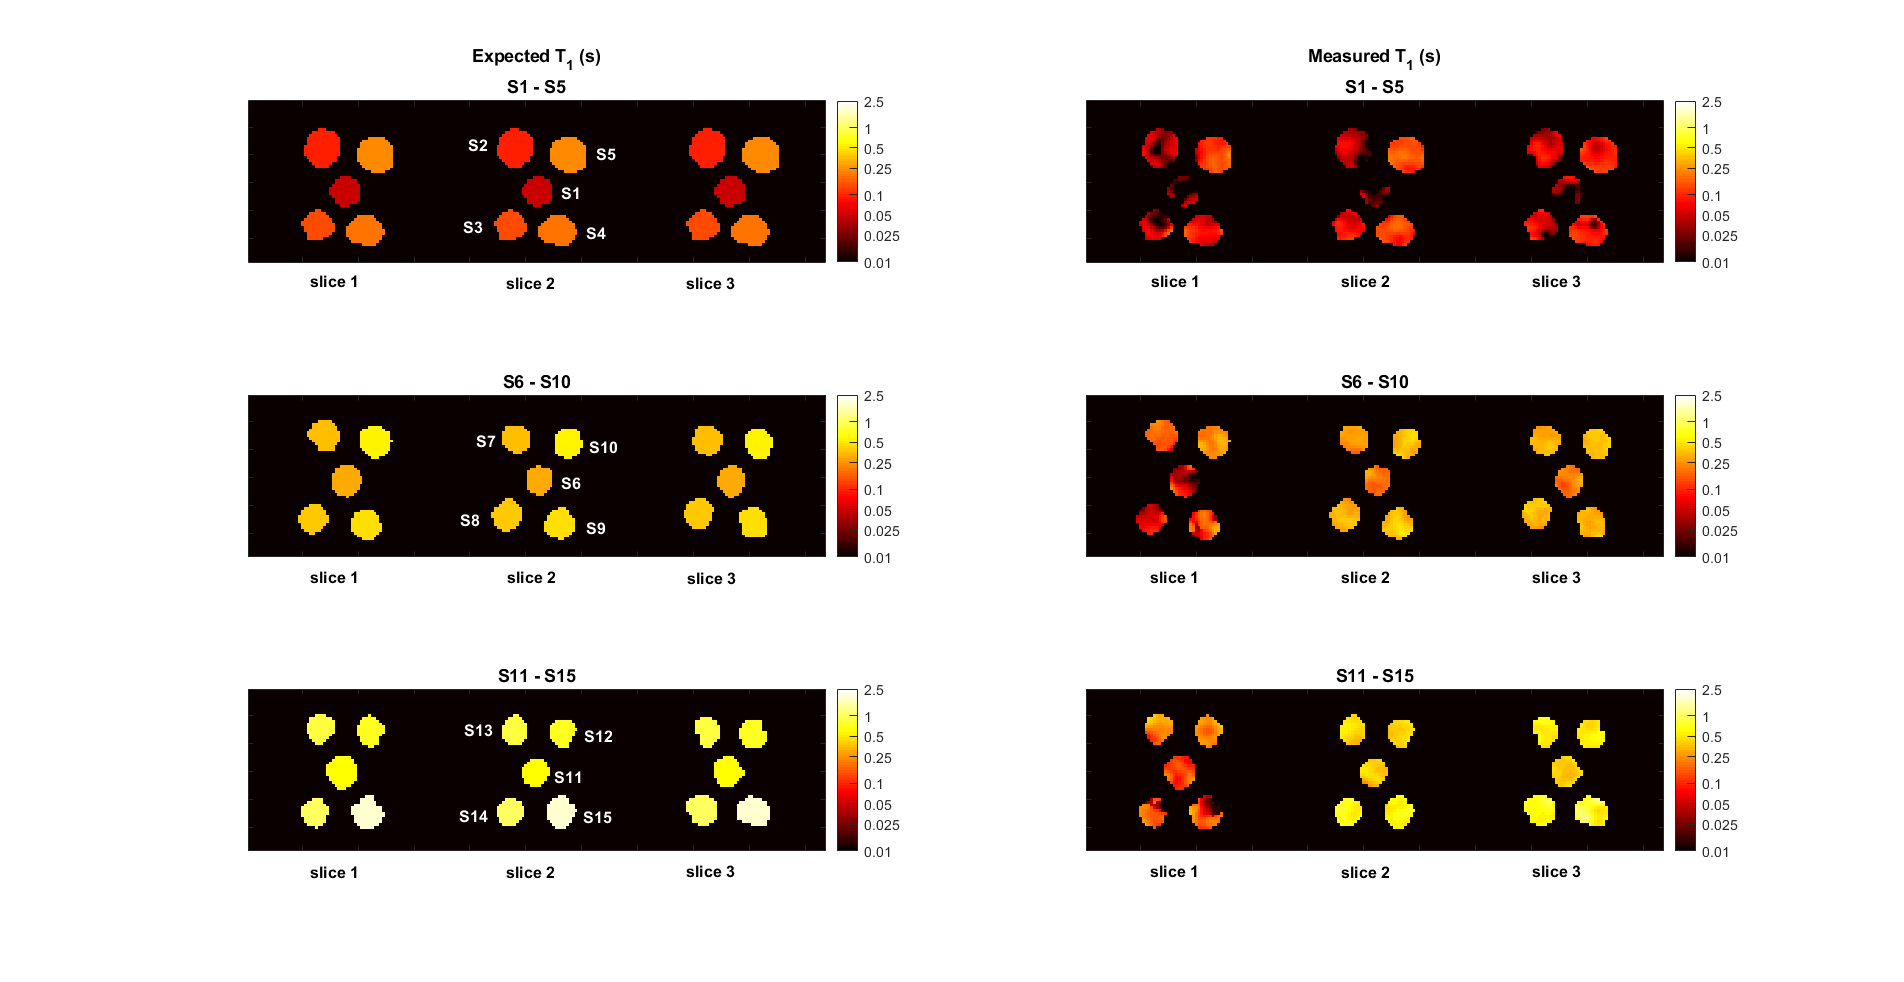
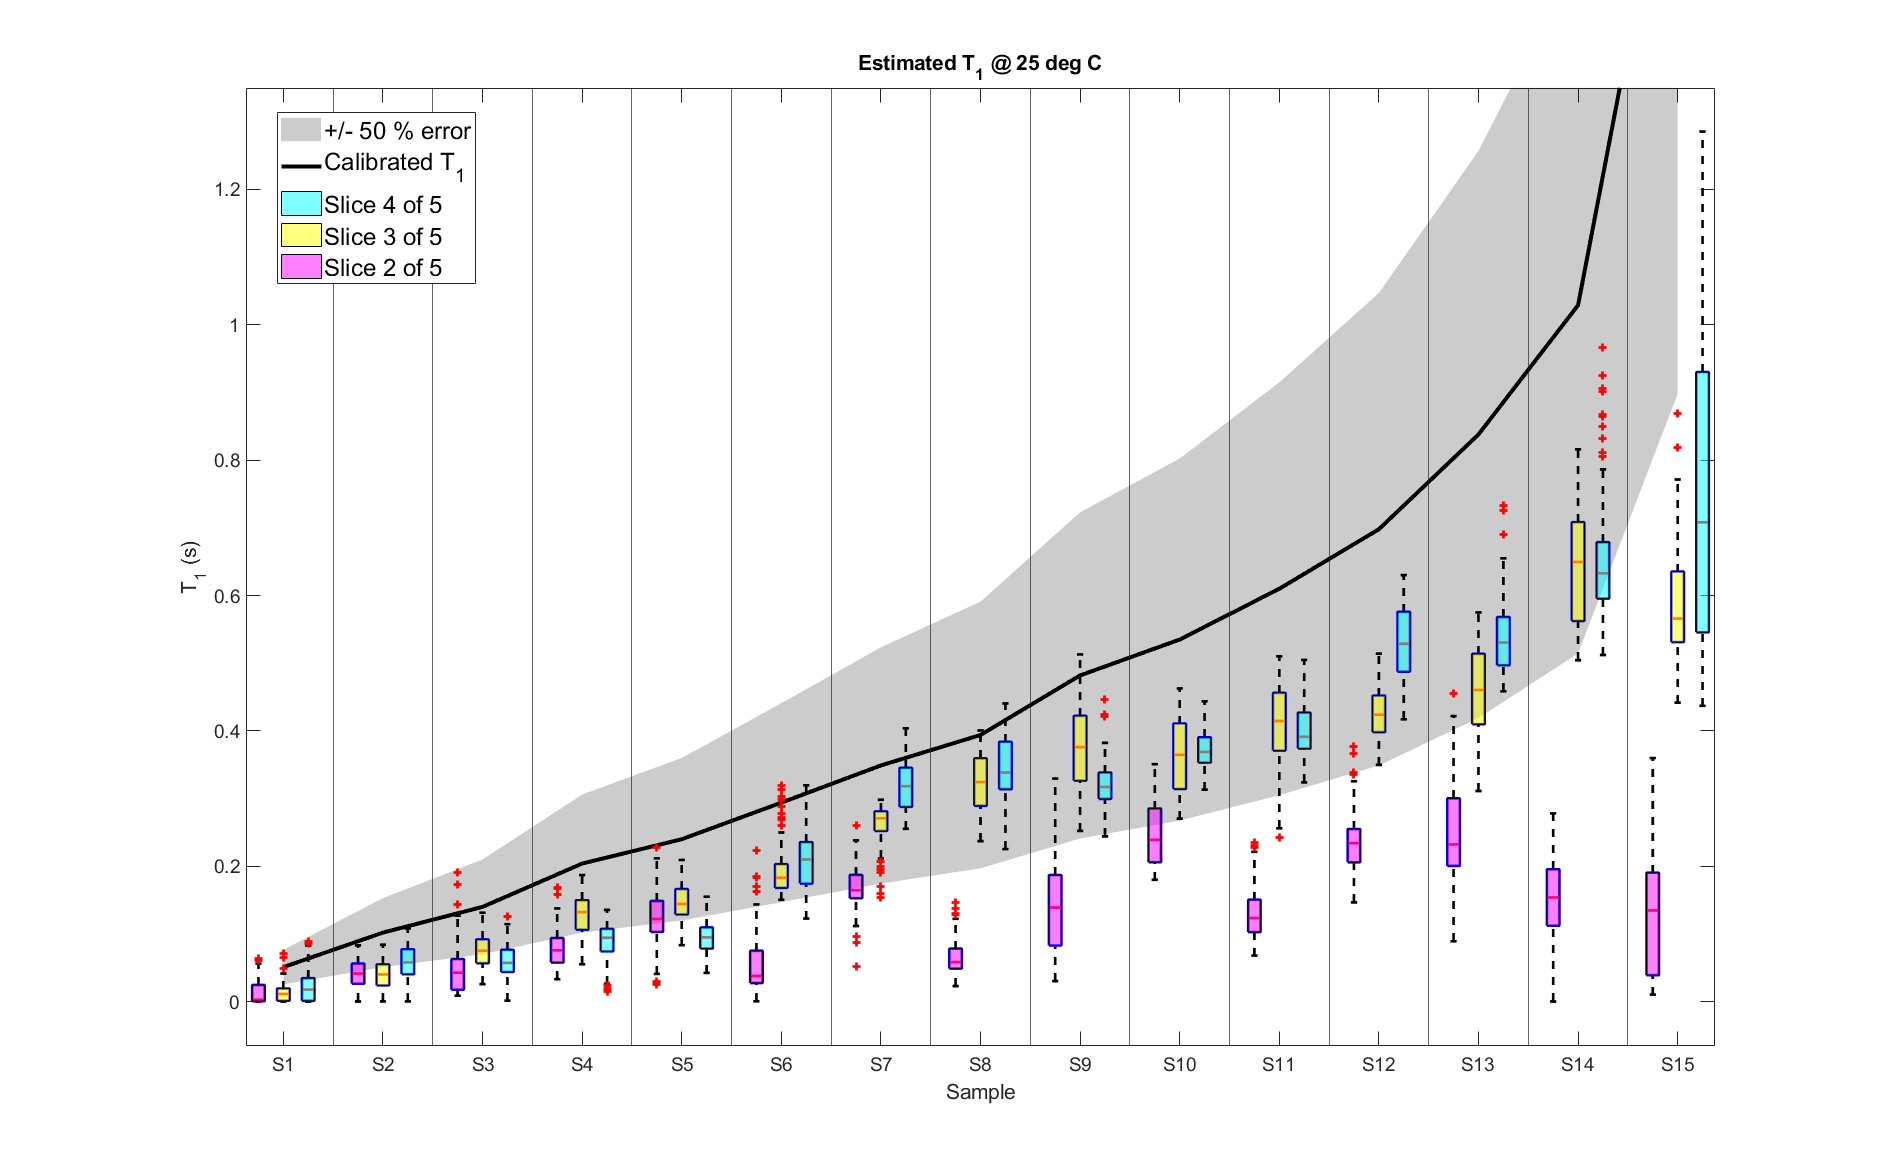
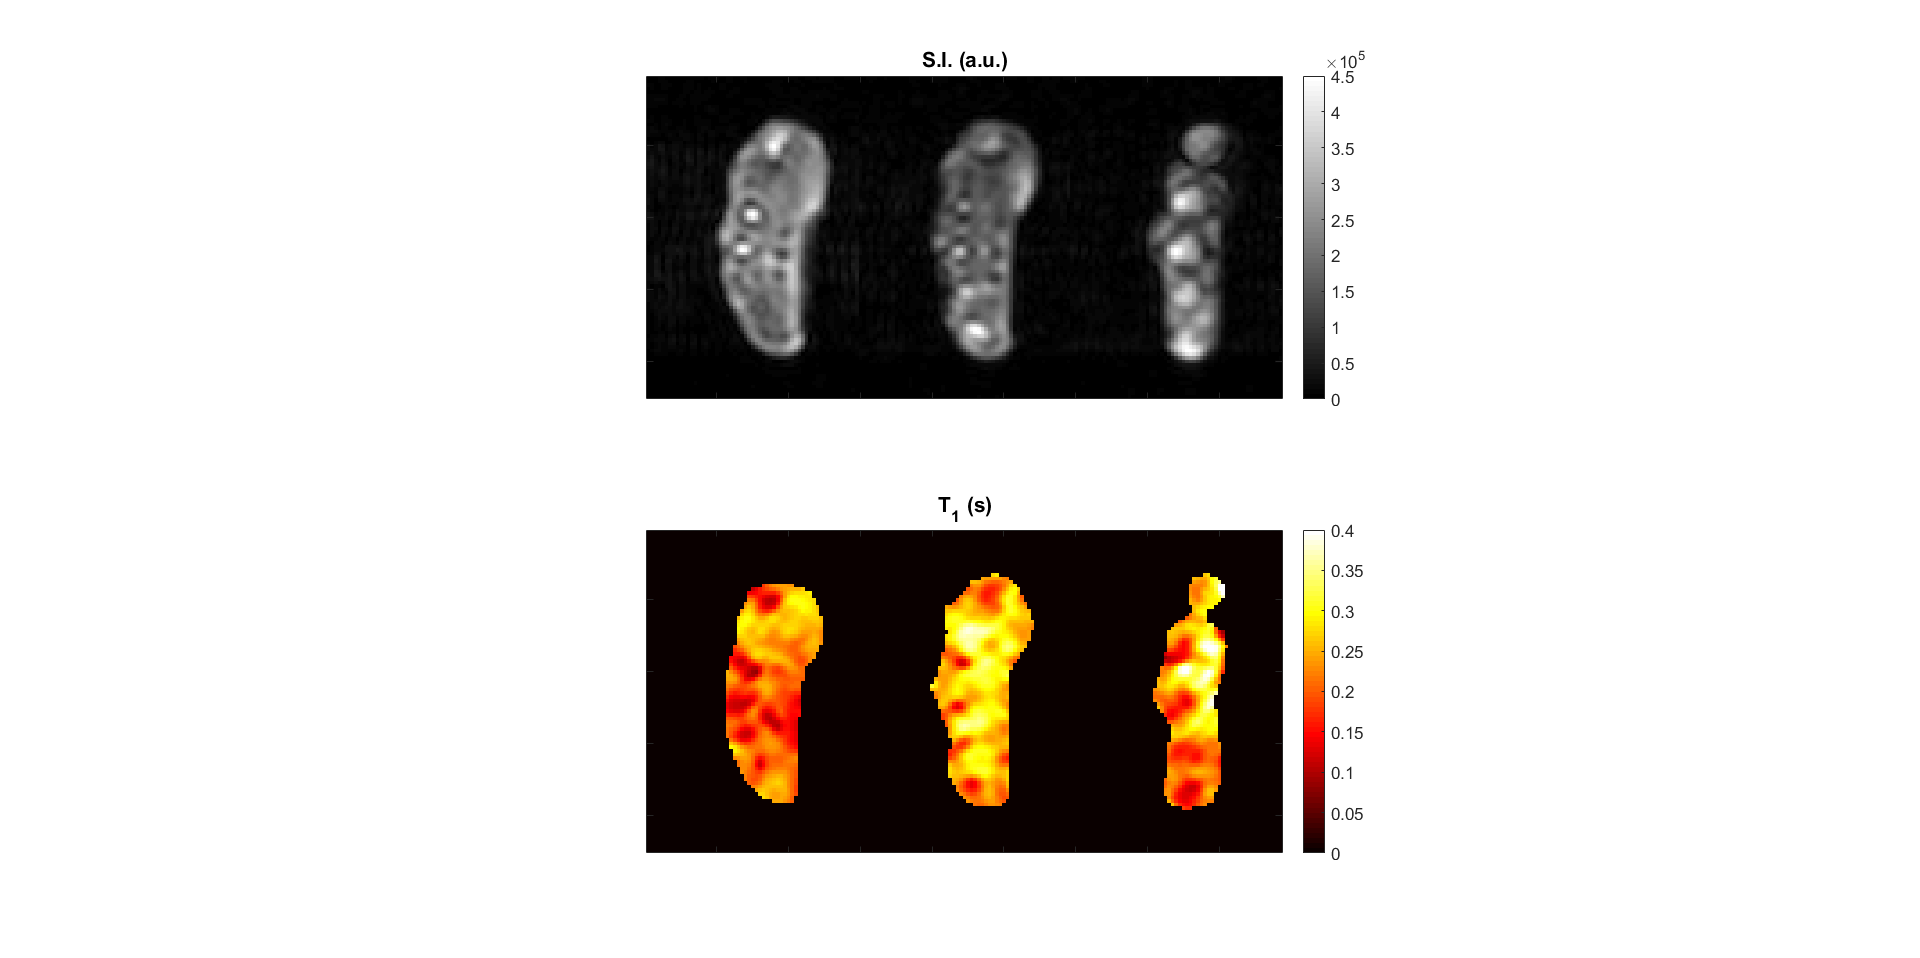
A comparison between the measured and expected $$$T_1$$$ maps of each sample group is presented in Fig. 3. The $$$T_1$$$ distribution within each individual sample is shown in the box plot in Fig. 4. Here the black line points out the expected values. The reconstructed in vivo $$$T_1$$$ map is given in Fig. 5, together with a corresponding anatomical image. Bone structures display very short $$$T_1$$$s, while the highest mapped values do not exceed 0.4 s.Discussion
Consistently with previous reports on the Look-Locker approach18, $$$T_1$$$ in each vial is generally underestimated. Nevertheless, the extracted maps lie within 50 % error of the expected calibrated values for two out of three slices. Given the chosen parameters, the shortest and longest investigated $$$T_1$$$s are inherently more prone to imprecision. Longer TRs could improve the estimation of long T1s (at the expense of time), yet the values measured in vivo suggest that the chosen TR is suitable for low-field clinical use. Key to an accurate sampling of $$$T_1$$$ recovery curves, the interleaved architecture of the sequence also allows for further reduction of the $$$T_1$$$ , at the expense of a lower number of slices. In that sense, the shorter TI selected for the in vivo images is expected to help retrieve a more precise $$$T_1$$$ for bones, which were estimated around 0.1 s. Despite the coarse resolution, the proposed approach successfully associated plausible $$$T_1$$$ values to the main anatomical parts of a human hand. Further acceleration of the sequence can result in increased SNR by unit time, which in turn can further reduce fluctuations in $$$T_1$$$ estimation (shown in Fig. 3) and allow a finer resolution.Conclusion
Here, we have assessed the performance of our proposed $$$T_1$$$ mapping sequence in calibrated samples covering a broad range of relaxation times (0.051 - 1.796 s). The same sequence could successfully provide an in vivo $$$T_1$$$ map of a volunteer’s hand in 10 min. Considering the multiple applications of $$$T_1$$$ mapping, the proposed technique can represent an asset for the diagnosis and treatment of a variety of diseases, especially focused on body extremities.Acknowledgements
Swiss National Science Foundation Grant No. PP00P2_170575.
Swiss National Science Foundation Grant No. PCEFP2_186861.
References
1Sarracanie, M., et al. (2015). Low-cost high-performance MRI. Scientific reports, 5(1), 1-9.
2Sarracanie, M., & Salameh, N. (2020). Low-field MRI: how low can we go? A fresh view on an old debate. Front Phys, 8, 172.
3Wald, L. L., et al. (2020). Low‐cost and portable MRI. Journal of Magnetic Resonance Imaging, 52(3), 686-696.
4Ghazinoor, S., et al. (2007). Low‐field musculoskeletal MRI. Journal of Magnetic Resonance Imaging: An Official Journal of the International Society for Magnetic Resonance in Medicine, 25(2), 234-244.
5Lindegaard, H. M., et al. (2006). Low-cost, low-field dedicated extremity magnetic resonance imaging in early rheumatoid arthritis: a 1-year follow-up study. Annals of the Rheumatic Diseases, 65(9), 1208-1212.
6Farahani, K., et al. (1990). Effect of field strength on susceptibility artifacts in magnetic resonance imaging. Computerized Medical Imaging and Graphics, 14(6), 409-413.
7Graf, H., et al. (2005). RF artifacts caused by metallic implants or instruments which get more prominent at 3 T: an in vitro study. Magnetic resonance imaging, 23(3), 493-499.
8de Mello, R., et al. (2019). Quantitative MRI Musculoskeletal Techniques: An Update. American Journal of Roentgenology, 213(3), 524-533.
9Wokke, B. H., et al. (2014). Quantitative MRI and strength measurements in the assessment of muscle quality in Duchenne muscular dystrophy. Neuromuscular Disorders, 24(5), 409-416.
10Endo, K. et al. (2016), K. MRI T1 map value can be a prediction of bone strength of cancellous bone. Annual Meeting of the Orthopaedic Research Society Orlando, FL March 5-8, 2016. J. Orthop. Res., 34(S1).
11Sur, S., et al. (2009). High resolution fast T1 mapping technique for dGEMRIC. Journal of Magnetic Resonance Imaging: An Official Journal of the International Society for Magnetic Resonance in Medicine, 30(4), 896-900.
12Nelson, T. R., & Tung, S. M. (1987). Temperature dependence of proton relaxation times in vitro. Magnetic resonance imaging, 5(3), 189-199.
13Hynynen, K. (2010). MRI-guided focused ultrasound treatments. Ultrasonics, 50(2), 221-229.
14Foley, J. L., et al. (2008). Effects of high‐intensity focused ultrasound on nerve conduction. Muscle & Nerve: Official Journal of the American Association of Electrodiagnostic Medicine, 37(2), 241-250.
15Fischer, H. W., et al. (1990). Nuclear relaxation of human brain gray and white matter: analysis of field dependence and implications for MRI. Magnetic resonance in medicine, 16(2), 317-334.
16Fiorito, M., et al. (2020). Low field MR thermometry with a fast, interleaved Look-Locker based T1 mapping approach. Proceedings of the 2020 ISMRM & SMRT Virtual Conference & Exhibition, August 8-14, 2020.
17Balezeau, F., et al. (2011). Mapping of low flip angles in magnetic resonance. Physics in Medicine & Biology, 56(20), 6635.
18Stikov, N., et al. (2015). On the accuracy of T1 mapping: searching for common ground. Magnetic resonance in medicine, 73(2), 514-522.
Figures