3233
Free-Breathing 3D MRI: T2*, Inspiration/Expiration Lung Volume, and Pulmonary Vasculature1Radiology, UC San Diego, San Diego, CA, United States, 2Canon Medical, Tochigi, Japan, 3Radiology, Fujita Health University, Toyoake, Japan
Synopsis
We have developed both the acquisition methodology and post-processing algorithms for 3D volume MRI. Using 3D MRI, T2*, lung volume changes between inspiration and expiration as a measure of regional specific ventilation (δV/V0), and pulmonary vasculature can be obtained using 3D ultra-short TE (UTE) imaging during free breathing.
Introduction
Ultra-short TE (UTE) imaging with TE of less than 0.1 ms allows visualization of lungs despite low proton density and short T2* [1]. This study demonstrates the ability to measure lung volumes at both inspiration and expiration, estimate T2* maps in lungs, and visualize pulmonary vessels using 3D UTE under free breathing.Methods
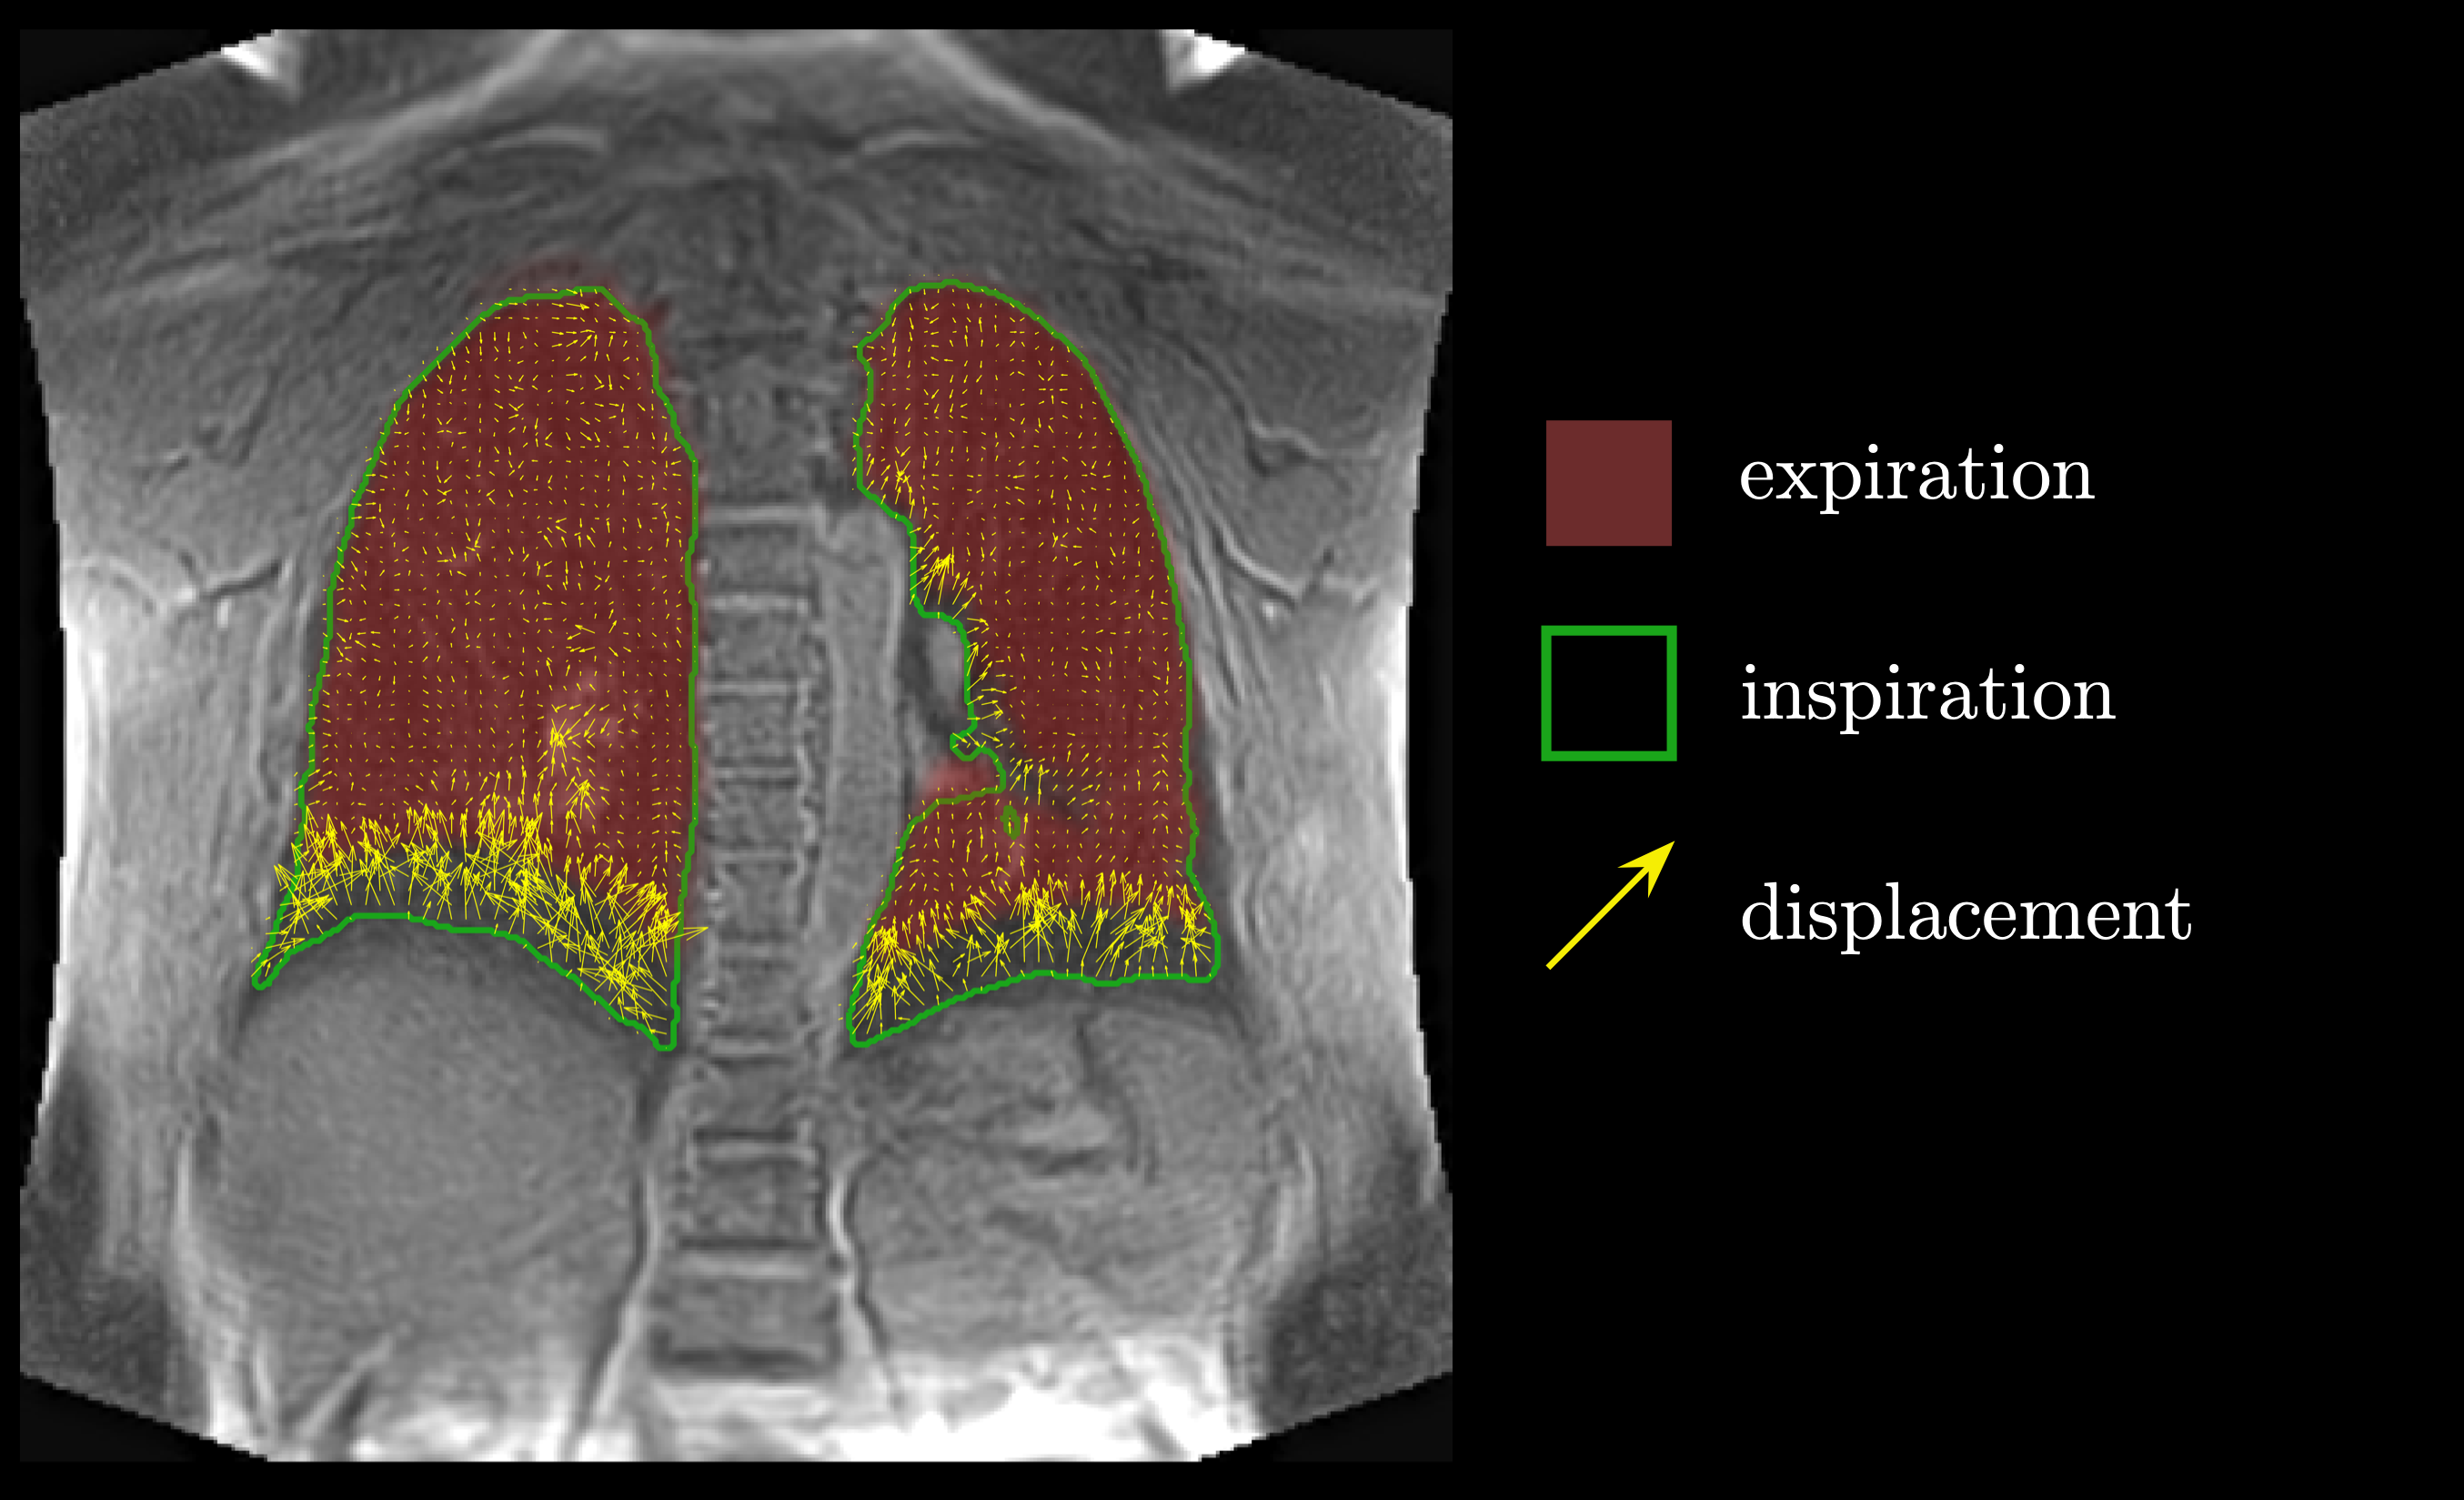
The study was carried out on a clinical 3T (Vantage Galan, version 6, Canon Medical, Japan) scanner on 4 healthy volunteers (46 ± 23 years) after obtaining IRB approved written informed consent. Images were acquired using a body SPEEDER coil. The scanning protocol included the following series: (i) 3D UTE without fat suppression (TE/TR = 96 µs/3.7 ms, NEX = 1, FA = 5°, in the coronal orientation FOV = 40×40 cm, matrix size 256×256); (ii) 3D UTE same as in (i) but with fat suppression: five SPectral Adiabatic Inversion Recovery (SPAIR) pulses per 64 segments were applied, resulting in approximately one SPAIR per 50 UTE lines. Both series used respiratory bellows and were scanned during the inspiratory period. Non-fat suppressed data were also acquired during expiration. For each series, 64 segments with approximately 250 lines per respiratory cycle were collected resulting in over 16000 lines and about 8% of k-space filled; (iii) multi-echo UTE (four TEs = 96 µs / 2.3/4.5/6.7 ms, TR = 12.5ms, NEX = 1, FA = 4°, in the coronal orientation FOV = 50×50 cm, matrix size 256×256) with the respiratory bellows set for the expiratory phase of the cycle. Data from (i) was used for the automated lungs segmentation which included a set of morphological operations: a) finding two largest areas with low signal at each slice inside the anatomy, b) voxels with less than 13 connections to the nearest neighbors were dropped, c) then the resultant surface was smoothed with a 3Dal gaussian kernel and used to calculate lung volume. An example of the segmented volume is shown in Figure 1. To visualize the vascular structure, the dataset (ii) was masked with the lungs surface, and the maximum intensity projection was derived, Figure 3. T2* maps were estimated from multi-echo UTE data using software built in-house with multithreading support for faster processing. The time-dependent signal curve for each voxel inside the lungs volume was fitted using least squares into the equation (1)$$ S(t)=S(0)\cdot {\exp{(-t/\mathrm{T_2^*)}}} + S' \quad \quad \quad \mathrm{(1)} $$ where the offset parameter S’ was introduced to account for long T2 components, to reduce partial volume effect and the signal noise floor [2]. The mean T2* for the lung was calculated by averaging T2* maps after exclusion of voxels with the values greater than 50 ms, which were attributed to the blood vessels. Specific ventilation was calculated using 1H imaging similar to [6], where displacements between inspiration and expiration images were calculated using the 3D Lucas-Kanade optical flow method, Figure 2.
Results
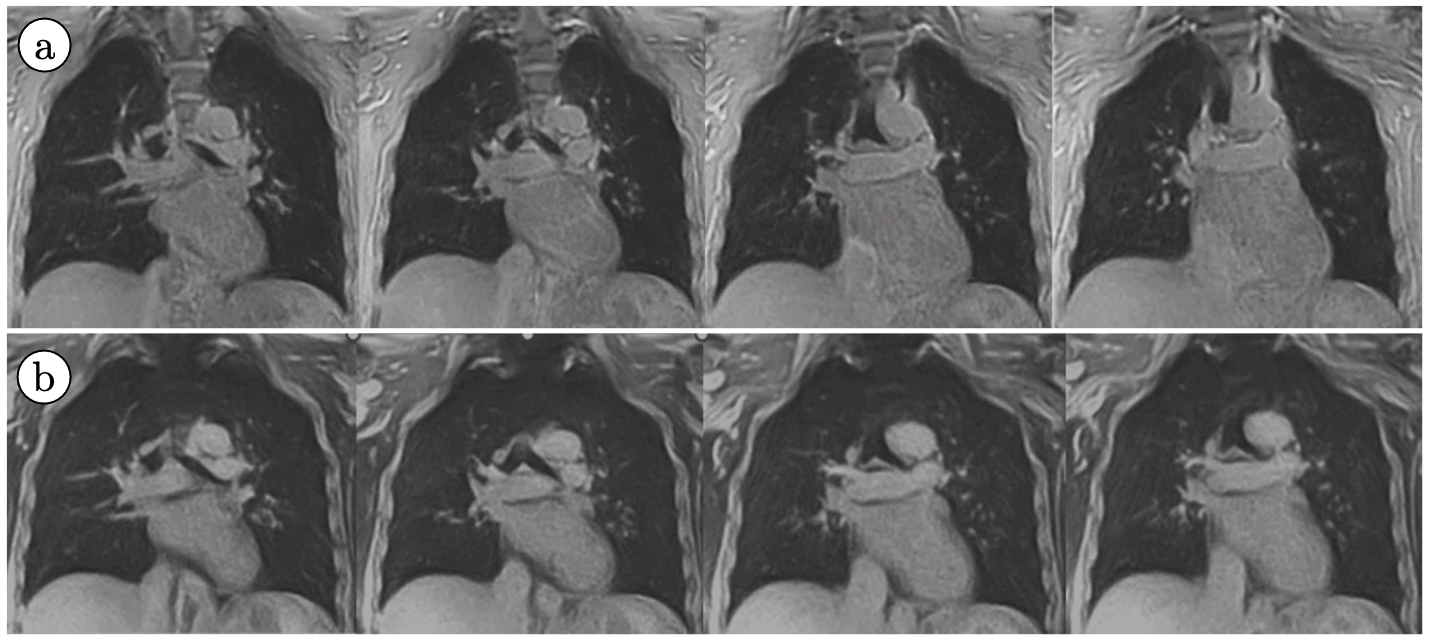
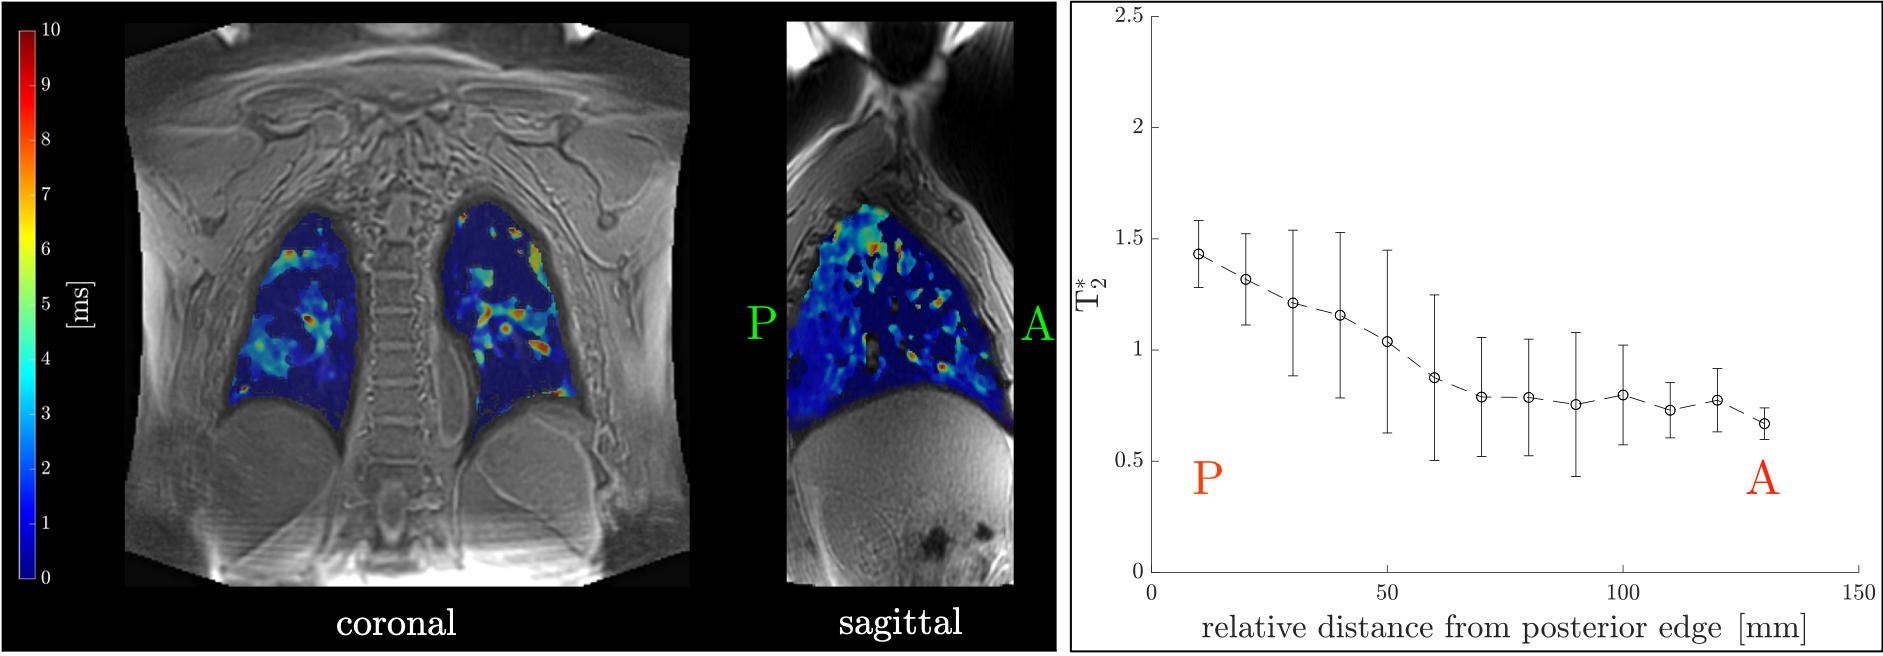
A set of four consecutive slices for UTEs with and without fat suppression is shown in Figure 3a. Distal parts of pulmonary vessels can be visualized nicely; however, the proximal pulmonary vessels are obscured and hidden by the high signal intensity of fat signal around the heart. Corresponding slices of UTEs with SPIR fat suppression pulse are shown in Figure 3b. The fat signal around the heart is suppressed demonstrating better visualization of myocardium and blood. In addition, proximal pulmonary vessels are unambiguously defined with fat suppression. The distal pulmonary vessels are similar in both UTE images with and without fat suppression. Figure 4 shows pulmonary blood vessels extracted from the MIPS of fat-suppressed images. Average lung volumes measured from the segmentation of the UTEs images obtained at inspiration and expiration phase were 3.25 ± 0.13 / 2.68 ± 0.08 liters respectively. The average T * for lung was 0.90 ± 0.08 ms; an example of the colormap superimposed over first echo (TE = 0.1 ms) image is shown in Figure 5. Calculated mean specific ventilation was 0.11 ± 0.02.Discussion
Averaged inspiration/expiration lung volumes segmented and measured in 3D UTE were similar to those reported in [4], and the difference between the two consistent with a normal tidal breath. Mean specific ventilation is consistent with the values reported in [3] and that expected in normal physiology. Mean T2* values similar to those estimated in [5]. The T2* in dorsal (gravitationally dependent) lung was longer than the ventral side in supine posture in all subjects, consistent with the literature and as expected from the known gradient in alveolar size [6, 7], Figure 5.Conclusions
Under free breathing, lung studies of T2*, expiratory/inspiratory volume, specific ventilation, and the pulmonary vasculature, are reported. These may provide useful information in patients with lung diseases.Acknowledgements
No acknowledgement found.References
[1] Bergin CJ., et al. Radiology. 1991; 179(3): 777-81.
[2] Pell GS., et al. J Magn Reson Imaging. 2006; 23: 248-252.
[3] Dante P. I., et al. Radiology. 2018; 287(2): 693-704.
[4] Mueller J., et al. Eur Radiol. 2019; 29: 1595–1606.
[5] Ohno Y., et al. Am J Roentgenol. 2011; 197(2): W279-85.
[6] Glazier J. B., et al. Journal of Applied Physiology. 1967; 23(5): 694-705.
[7] Theilmann, R.J., et al. J. Magn. Reson. Imaging. 2009; 30: 527-534.
Figures