2847
The effect of inversion time on a two-compartment SMT and NODDI: an in vivo study1AGH University of Science and Technology, Kraków, Poland, 2Cardiff University Brain Research Imaging Centre (CUBRIC), School of Psychology, Cardiff University, Cardiff, United Kingdom, 3Department of Applied Mathematics and Computer Science, Technical University of Denmark, Kongens Lyngby, Denmark, 4Signal Processing Lab (LTS5), École polytechnique fédérale de Lausanne (EPFL), Lausanne, Switzerland, 5LPI, ETSI Telecomunicación, Universidad de Valladolid, Valladolid, Spain
Synopsis
We investigate the effect of the inversion time on the spherical mean technique (SMT) and neurite orientation dispersion and density imaging (NODDI) metrics based on the multi-parametric diffusion MR data. Our findings indicate the orientation dispersion index and mean orientation of Watson distribution remains unchanged for a wide range of TI, while volume fractions and diffusivities show significant changes leading to characteristic "up-and-down" behavior concerning the TI used to fit the model.
Introduction
Diffusion magnetic resonance imaging (dMRI) is an emerging non-invasive tool that can be used to quantify the microstructure of the tissue on a cell scale1,2. While the dMRI is sensitive to microscopic diffusion of water in tissues3, the relaxometry uses the sensitivity of the MR signal to the physical and chemical micro-environments of the tissue, characterized by longitudinal (T1) and transverse (T2 and T2*) relaxation times 3,4. However, in both cases, limitations present, i.e., it is complicated to use the relaxation MR data to separate tissue compartments that have similar relaxation times and use dMRI data to separate tissue compartments with similar diffusion properties3. Diffusion-relaxometry alleviates the problems, and it simultaneously enables measuring multi-parametric MR data4,5 using, for instance, the ZEBRA sequence3. In this study, we investigate the influence of inversion time (TI) on the parameters of two biophysical models applied to in vivo human brain data, namely the spherical mean technique (SMT) and neurite orientation dispersion and density imaging (NODDI).Methods and materials
Models: Two biophysical models were used: 1) SMT with the objective function optimized via the trust region reflective approach6 $$f(b)=\frac{v_{in}\sqrt{\pi}\mathrm{erf}(\sqrt{b \lambda})}{2\sqrt{b\lambda}} + \frac{(1-v_{in})\sqrt{\pi}\mathrm{erf}(\sqrt{b\lambda v_{in}})\mathrm{exp}\left(-b\lambda (1-v_{in})\right)}{2\sqrt{b\lambda v_{in}}}-\frac{S(b, TI, TE=80 \ \mathrm{ms})}{S(b=0, TI, TE=80 \ \mathrm{ms})},$$ with $$$v_{in}$$$ being the intracellular volume fraction, $$$\lambda$$$ is the intrinsic diffusivity, and $$$b$$$ is the b-value, and 2) NODDI model obtained with the Dmipy Toolbox7.Multi-parametric diffusion: The ZEBRA sequence combines the diffusion and relaxometry following the equation:$$S(b, TI, TE) \propto (1 - 2 \exp(-TI/T_1))\exp(-TE/T_2)\exp(-bD),$$with $$$b$$$ being the b-value, $$$TI$$$ and $$$TE$$$ the inversion and echo times, and $$$D$$$ is the diffusion coefficient.
Data: In vivo data were acquired from five healthy human volunteers (3W, 2M), 19--46y, with their informed consent (REC 12/LO/1247) on a clinical 3T Philips Achieva scanner (Best, Netherlands). A modified single-shot PGSE EPI sequence3 was used collecting 1344 volumes over four b-shells (500, 1000, 2000, and 3000 $$$\mathrm{\frac{s}{mm^2}}$$$) in total, 105 uniformly distributed unique diffusion gradient directions, three echo times (TEs) (80, 105, and 130 ms), and 28 TIs ranged from 20 to 7322.7 ms. Full acquisition and preprocessing details are available in8. The data were interpolated for each gradient direction using a spline-based interpolation to reach a fully-sampled grid over $$$b \times TI \times TE$$$. To avoid any extrapolation we restricted the interpolation nodes to TI={1059, 1589, 2119, 2649, 3179, and 3709 ms} and TE={80, 105, and 130 ms}. Both SMT and NODDI models were fitted using all four b-shells,105 gradient directions and TE=80 ms.
Atlases: Two atlases were used to retrieve the region-of-interests (ROIs) namely the John Hopkins University (JHU) DTI-based atlas for white matter ROIs9 and sub-striatal regions atlas10 to obtain gray matter ROIs. In both cases, we used the FSL 5.0.11 software to register the data11.
Results
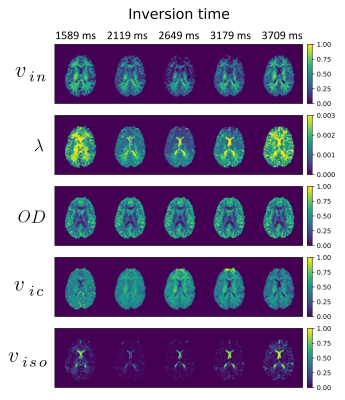
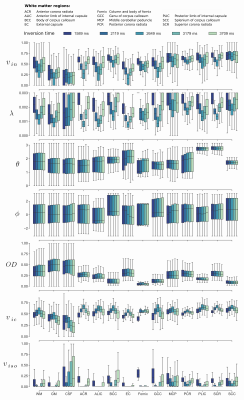
In Fig.1, we visually inspect the SMT and NODDI parameters in a selected axial slice. Significant differences in sensitivities of the parameters to the changes in TI are observed with an exception to the orientation dispersion index $$$OD$$$ being a consistent measure.In Fig. 2, we extrapolate the previous experiment and present the mean, the first and third quartiles of the measures calculated over the ROIs and different TIs. This experiment confirms the $$$OD$$$ and the mean orientation of Watson distribution $$$\mu = (\theta, \phi)$$$ to be stable independently of TI used to estimate the parameters of the models. We notice here the intracellular volume fractions and intrinsic diffusivity present a specific "up-and-down" behaviour that is a direct consequence of a low TI approaching $$$T1 \log(2)$$$ at the peak value.
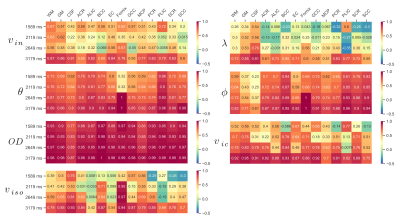
Next, in Fig.3, we present the Pearson correlation coefficients that evaluate linear correlations between the parameters obtained at two different TI namely TI = 3709 ms, and the remaining TIs. Again, we observe a very strong positive correlation for the $$$OD$$$ parameter and the mean orientation of Watson distribution mostly exceeding the value of 0.9.
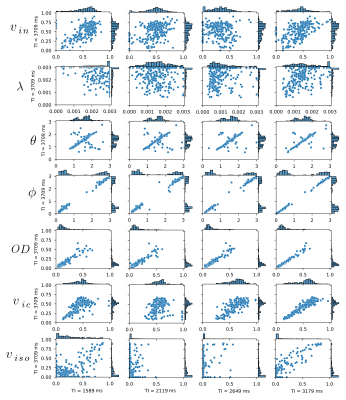
In Fig.4 we visually inspect these correlations using a scatter plot between the parameters obtained at different TIs for the body corpus callosum area. These results again show strong positive correlations for $$$OD$$$ and $$$\mu = (\theta, \phi)$$$.
Discussion
We evaluated the influence of inversion time on SMT and NODDI parameters. Our findings show that the intracellular volume fraction (SMT, NODDI), intrinsic diffusivity (SMT), and the isotropic volume fraction (NODDI) are especially vulnerable to the changes in TI. The metrics are characterized by a specific "up-and-down" behavior (especially visible in Fig. 2), which is directly caused by disappearance of the component $$$(1-2\mathrm{exp}\left(\frac{-TI}{T1}\right))$$$ in the MR signal once the TI approaches $$$T1\log(2)$$$. The $$$OD$$$ and the mean orientation of Watson distribution $$$\mu = (\theta, \phi)$$$ becomes rather stable across different TIs showing strong positive correlations and the differences across the TI are mainly due to the inherent acquisition noise.Conclusion:
The SMT and NODDI metrics show a different level of stability as the signal component $$$(1-2\mathrm{exp}\left(\frac{-TI}{T1}\right))$$$ disappears, i.e., orientation dispersion index and mean orientation of Watson distribution are insensitive, while volume fractions and diffusivities exhibit significant alterations to the changes in inversion time. Therefore, special care must be taken when interpreting the SMT and NODDI metrics across multiple site studies, especially once different acquisition protocols are used.Acknowledgements
Maryam Afzali and Derek K. Jones are supported by a Wellcome Trust Investigator Award (096646/Z/11/Z) and a Wellcome Trust Strategic Award (104943/Z/14/Z). Fabian Bogusz acknowledges AGH University of Science and Technology, Kraków, Poland (16.16.120.773). Marco Pizzolato acknowledges the European Union’s Horizon 2020 research and innovation programme under the Marie Sklodowska-Curie grant agreement No 75446. Tomasz Pieciak acknowledges the Polish National Agency for Academic Exchange for grant PN/BEK/2019/1/00421 under the Bekker programme and the Ministry of Science and Higher Education (Poland) under the scholarship for outstanding young scientists.References
1. Novikov, D. S., Kiselev, V. G., & Jespersen, S. N. (2018). On modeling. Magnetic resonance in medicine, 79(6), 3172–3193.
2. Zhang, H., Schneider, T., Wheeler-Kingshott, C. A., & Alexander, D. C. (2012). NODDI: practical in vivo neurite orientation dispersion and density imaging of the human brain. NeuroImage, 61(4), 1000–1016.
3. Hutter, J., Slator, P. J., Christiaens, D., Teixeira, R., Roberts, T., Jackson, L., Price, A. N., Malik, S., & Hajnal, J. V. (2018). Integrated and efficient diffusion-relaxometry using ZEBRA. Scientific reports, 8(1), 1–13.
4. Kim, D., Doyle, E. K., Wisnowski, J. L., Kim, J. H., & Haldar, J. P. (2017). Diffusion-relaxation correlation spectroscopic imaging: A multidimensional approach for probing microstructure. Magnetic resonance in medicine, 78(6), 2236–2249.
5. Slator, P. J., Hutter, J., Palombo, M., Jackson, L. H., Ho, A., Panagiotaki, E., Chappell, L. C., Rutherford, M. A., Hajnal, J. V., & Alexander, D. C. (2019). Combined diffusion-relaxometry MRI to identify dysfunction in the human placenta. Magnetic resonance in medicine, 82(1), 95–106.
6. Li, H., Chow, H. M., Chugani, D. C., & Chugani, H. T. (2018). Minimal number of gradient directions for robust measurement of spherical mean diffusion weighted signal. Magnetic resonance imaging, 54, 148–152.
7. Fick, R., Wassermann, D., & Deriche, R. (2019). The Dmipy Toolbox: Diffusion MRI Multi-Compartment Modeling and Microstructure Recovery Made Easy, Frontiers in Neuroinformatics, 13, 64.
8. Pizzolato, M., Palombo, M., Bonet-Carne, E., Tax, Ch. M. W., Grussu, F., Ianus, A., Bogusz, F., Pieciak, T., Ning, L., Larochelle, H., Descoteaux, M., Chamberland, M., Blumberg, S. B., Mertzanidou, T., Alexander, D. C., Afzali, M., Aja-Fernández, S., Jones, D. K., Westin, C-F., Rathi, Y., Baete, S. H., Cordero-Grande, L., Ladner, T., Slator, P. J., Hajnal, J. V., Thiran, J-P., Price, A. N., Sepehrband, F., Zhang, F., & Hutter, J. (2020). Acquiring and predicting MUlti-dimensional DIffusion (MUDI) data: an open challenge. Medical Image Computing and Computer Assisted Interventions Conference (MICCAI), Computational Diffusion MRI, 195-208.
9. Mori, S., Wakana, S., Van Zijl, P.C. & Nagae-Poetscher, L.M. (2005). MRI atlas of human white matter. Elsevier.
10. Tziortzi, A.C., Searle, G.E., Tzimopoulou, S., Salinas, C., Beaver, J.D., Jenkinson, M., Laruelle, M., Rabiner, E.A. & Gunn, R.N. (2011). Imaging dopamine receptors in humans with [11C]-(+)-PHNO: dissection of D3 signal and anatomy. Neuroimage, 54(1), 264-277.
11. Smith, S.M., Jenkinson, M., Woolrich, M.W., Beckmann, C.F., Behrens, T.E., Johansen-Berg, H., Bannister, P.R., De Luca, M., Drobnjak, I., Flitney, D.E. & Niazy, R.K. (2004). Advances in functional and structural MR image analysis and implementation as FSL. Neuroimage, 23, S208-S219.
Figures


Figure 2: Mean values and first and third quartiles for SMT (intracellular volume fraction $$$v_{in}$$$ and intrinsic diffusivity $$$\lambda \ [\mathrm{mm}^2/\mathrm{s}]$$$) and NODDI (mean orientation of Watson distribution $$$\mu = (\theta, \phi) \ [\mathrm{rad}]$$$, orientation dispersion index $$$OD$$$, intracellular volume fraction $$$v_{ic}$$$ and isotropic volume fraction $$$v_{iso}$$$) over regions-of-interests and changes in TI. WM - white matter, GM - grey matter, CSF - cerebrospinal fluid.

Figure 3: Pearson’s correlation for the SMT (intracellular volume fraction $$$v_{in}$$$ and intrinsic diffusivity $$$\lambda \ [\mathrm{mm}^2/\mathrm{s}]$$$) and NODDI (mean orientation of Watson distribution $$$\mu = (\theta, \phi) \ [\mathrm{rad}]$$$, orientation dispersion index $$$OD$$$, intracellular volume fraction $$$v_{ic}$$$ and isotropic volume fraction $$$v_{iso}$$$) at $$$TI = 3709 \ \mathrm{ms}$$$ and remaining TIs for different ROIs.

Figure 4: Correlations between the SMT (intracellular volume fraction $$$v_{in}$$$ and intrinsic diffusivity $$$\lambda \ [\mathrm{mm}^2/\mathrm{s}]$$$) and NODDI (mean orientation of Watson distribution $$$\mu = (\theta, \phi) \ [\mathrm{rad}]$$$, orientation dispersion index $$$OD$$$, intracellular volume fraction $$$v_{ic}$$$ and isotropic volume fraction $$$v_{iso}$$$) metrics between $$$TI = 3709 \ \mathrm{ms}$$$ and remaining TI values over the GCC area. The histograms on the right side and top of each scatter plot present the marginal distribution of the samples