2833
Are Cramér-Rao Lower Bounds an Accurate Estimate for Standard Deviations in Magnetic Resonance Spectroscopy?1Biomedical Engineering, Columbia University, New York City, NY, United States, 2Radiology, Columbia University, New York City, NY, United States
Synopsis
Cramér-Rao Lower Bounds (CRLBs) have become the routine method to approximate standard deviations for magnetic resonance spectroscopy. CRLBs are theoretically a lower bound on the standard deviation. Realistic synthetic 3 Tesla spectra were used to investigate the relationship between estimated CRLBs, true CRLBs and standard deviations. It was demonstrated that although the CRLBs are theoretically truly a lower bound on the standard deviation this approximation is valid only as long as the model properly characterizes the data. In the case when the basis set deviates from the measured data it was shown that the CRLBs deviate substantially from standard deviations.
Introduction
As magnetic resonance spectroscopy (MRS) is a time-limited modality it is typically not feasible to perform multiple repetitions of the same experiment to calculate the standard errors. As such the field has adopted the Cramér-Rao Lower Bound1 (CRLB) to circumvent this problem. Here a simulation study is presented which investigates the relationship between CRLBs and standard deviations (SDs) for two related but distinct cases: 1) the signal is well characterized by the model (i.e., the basis set of metabolites accurately reflects the experimental reality and the macromolecule signal has been measured a priori and is included in the linear combination modeling fit); and 2) the signal is approximately characterized by the model (i.e., the macromolecules have been measured a priori, however its exact shape has been modulated by T1 effects, as the double inversion preparation typically used to measure MM highly sensitizes these resonances to T1 variations2).Methods
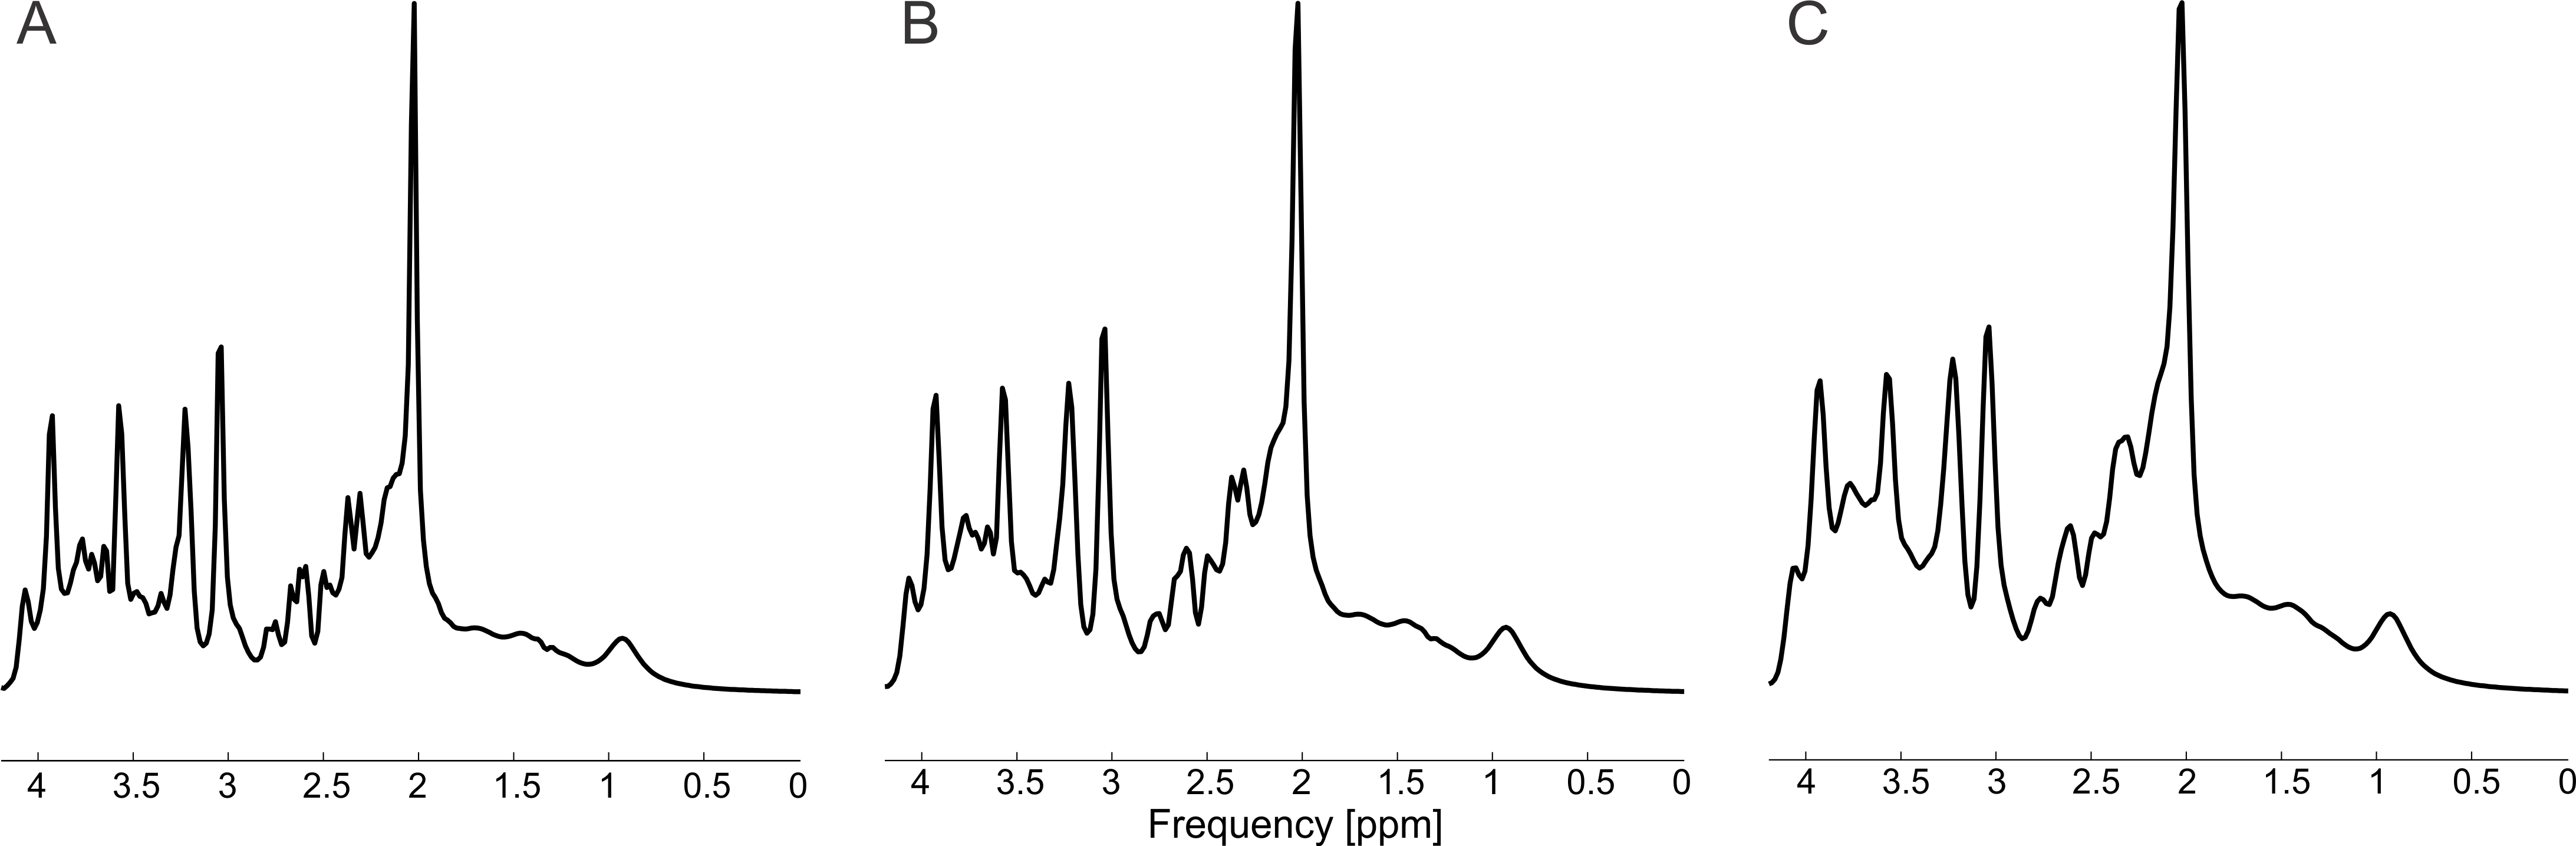
Synthesis of SpectraSpectra were synthesized similar to what has previously been performed3,4. Spectra were Gaussian broadened3 with a linewidth of 3, 8 or 20 Hz2 (NAA full width at half maximum of 4.6 Hz, 6.2 Hz and 8.9 Hz), which reflected good, adequate and poor quality shims, respectively, at 3T5. Five different noise factors (NF) were chosen to span the range of typically encountered signal-to-noise ratios (SNR). These noise scaling factors were 1, 2, 4, 8 and 16, where NF = 1 corresponds to an SNR of 773, 640, 523, for Gb = 3, 8 and 20 Hz2, respectively. The macromolecule signal was approximated as the sum of 10 individual Lorentzian resonances with measured concentration and T2 values2. The case when the macromolecule signal was approximately known (corresponding to the case where the macromolecules were measured but their amplitudes were modulated by T1 effects) was also investigated here. To approximate this effect the amplitude of the 10 macromolecule resonances varied by ±20%.
Calculation of SDs and CRLBs
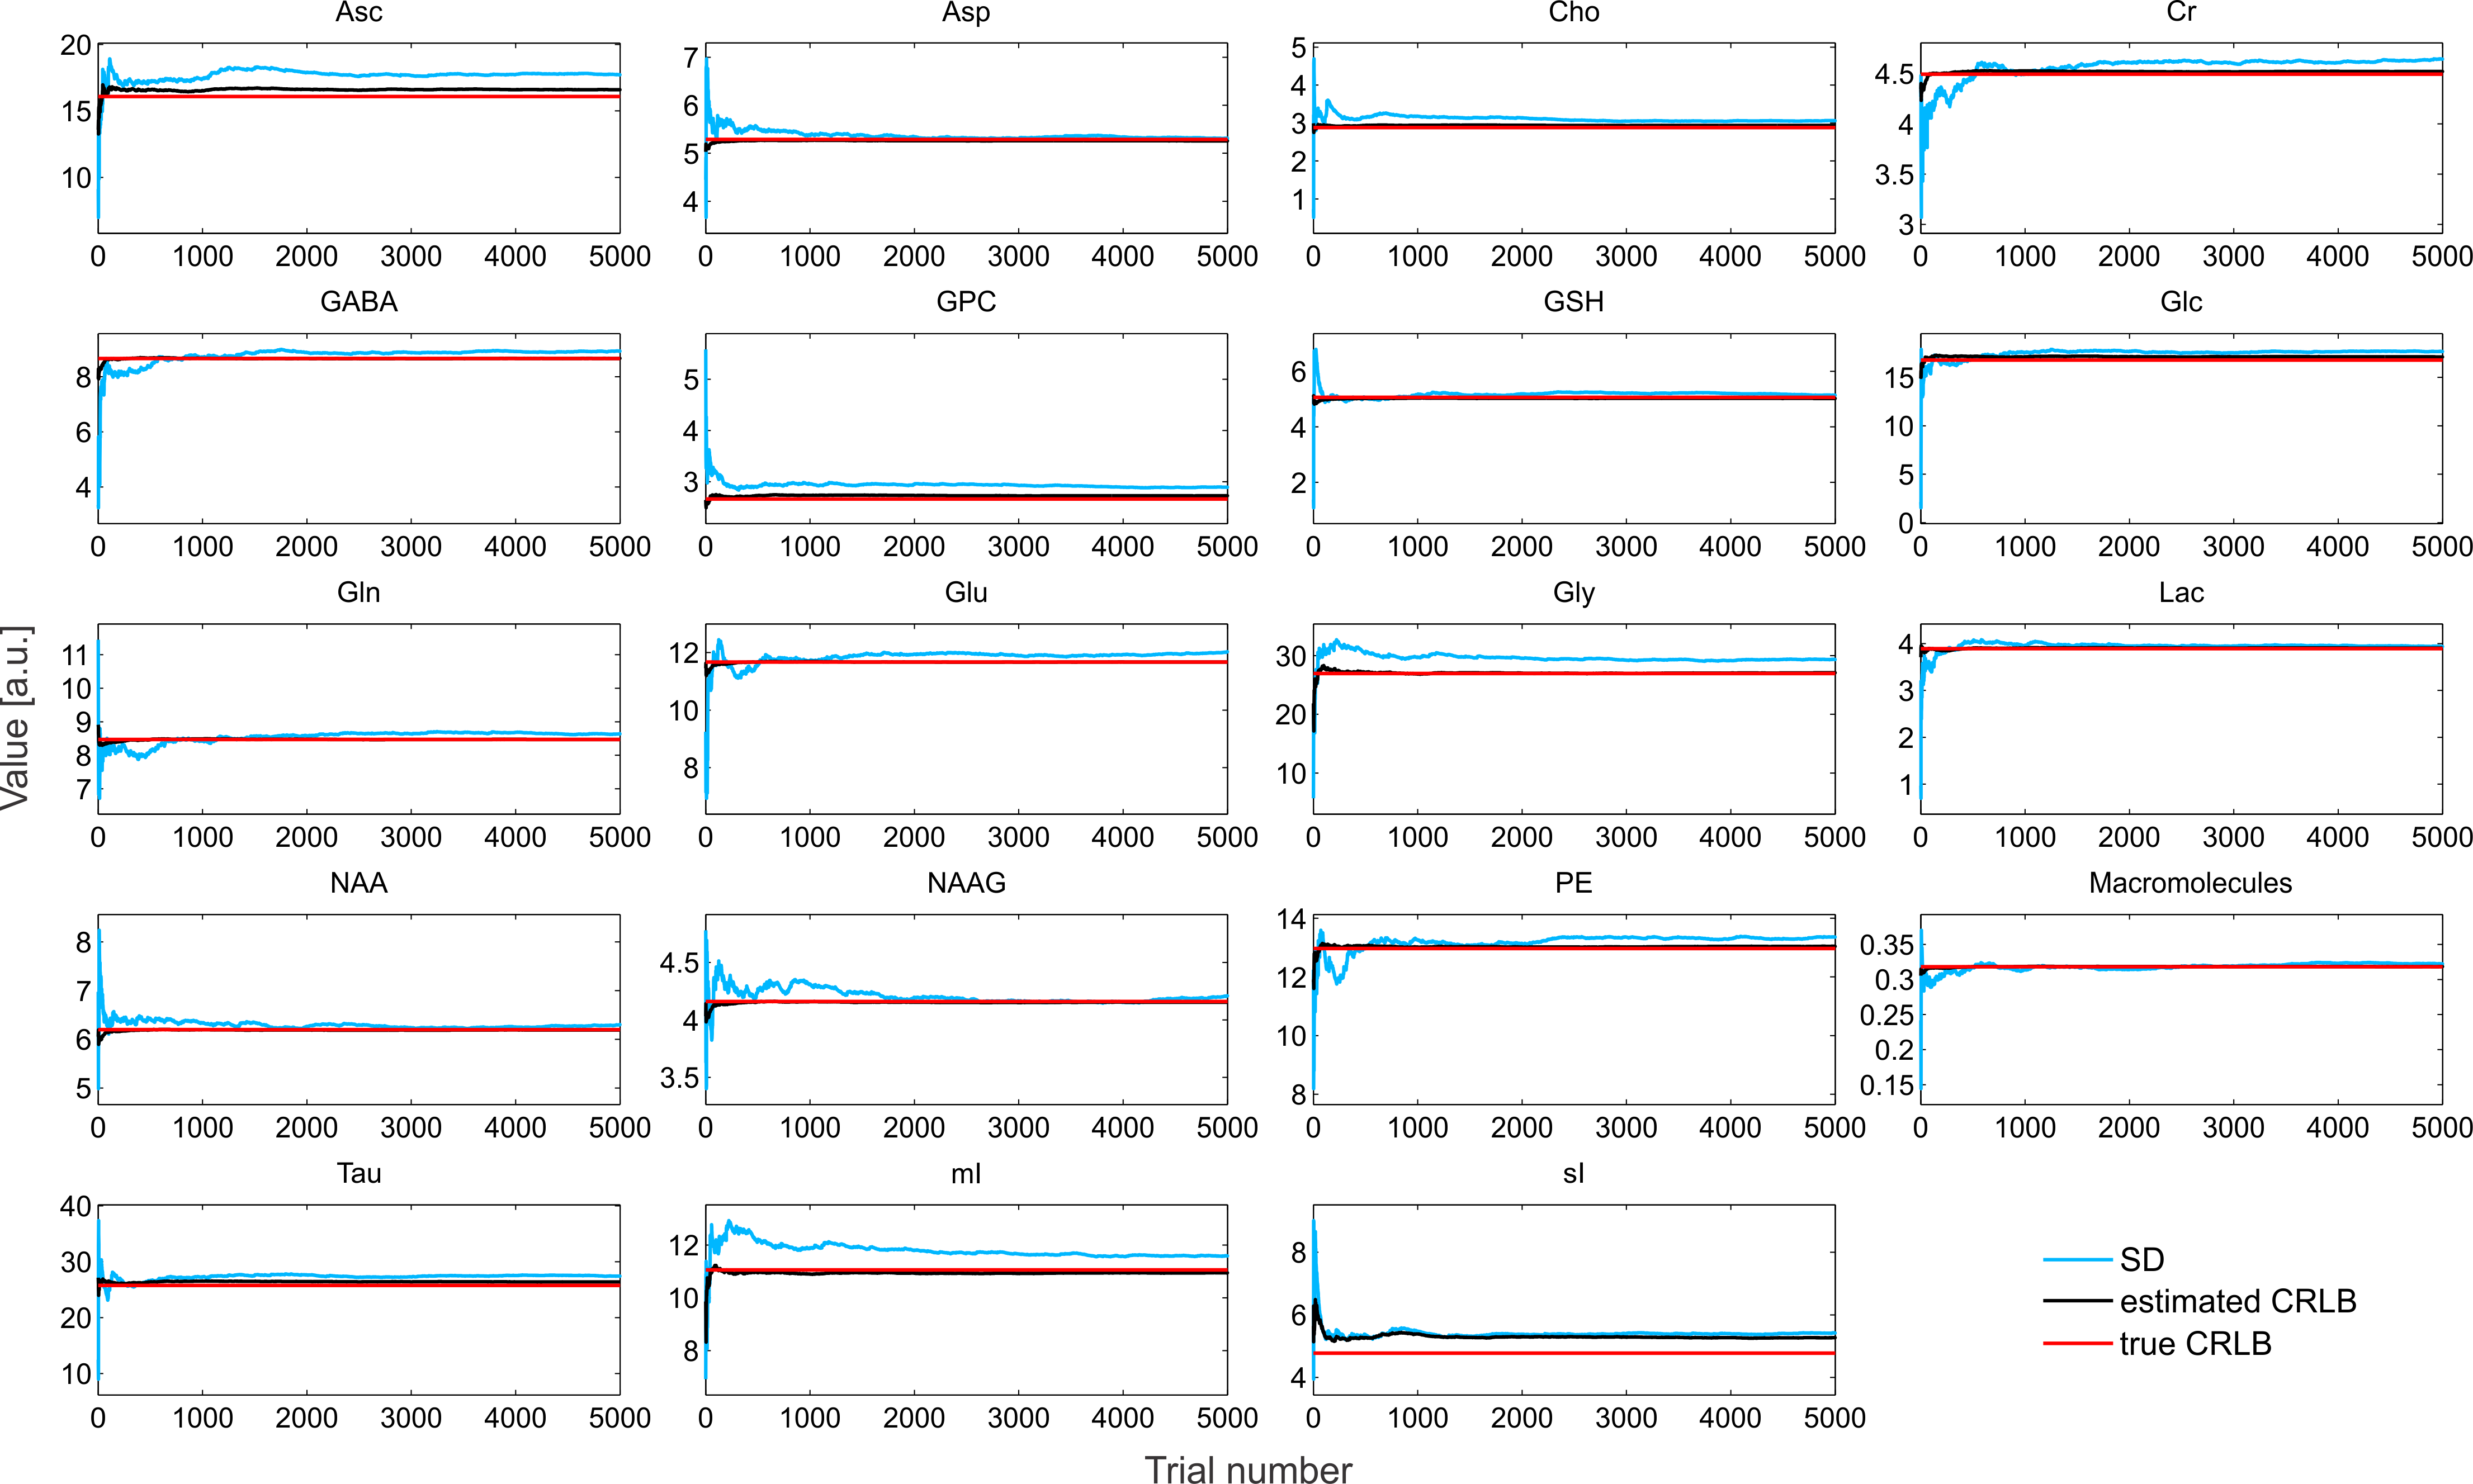
5000 Monte Carlo simulations differing in additive white Gaussian noise for each noise factor and shim quality were performed. At each trial the parameters (amplitude, frequency shift, Lorentzian linewidth, Gaussian linewidth and phase) were estimated via the interior trust region approach6 in INSPECTOR7,8. The estimated CRLB, $$$\widehat{CRLB}$$$, and true CRLB were calculated by inverting the Fisher information matrix9. $$$\widehat{CRLB}$$$ was calculated using the extracted fit parameters and noise power from the Monte Carlo simulations, while the true CRLB used the a priori parameter values and noise power.
Results and Discussion
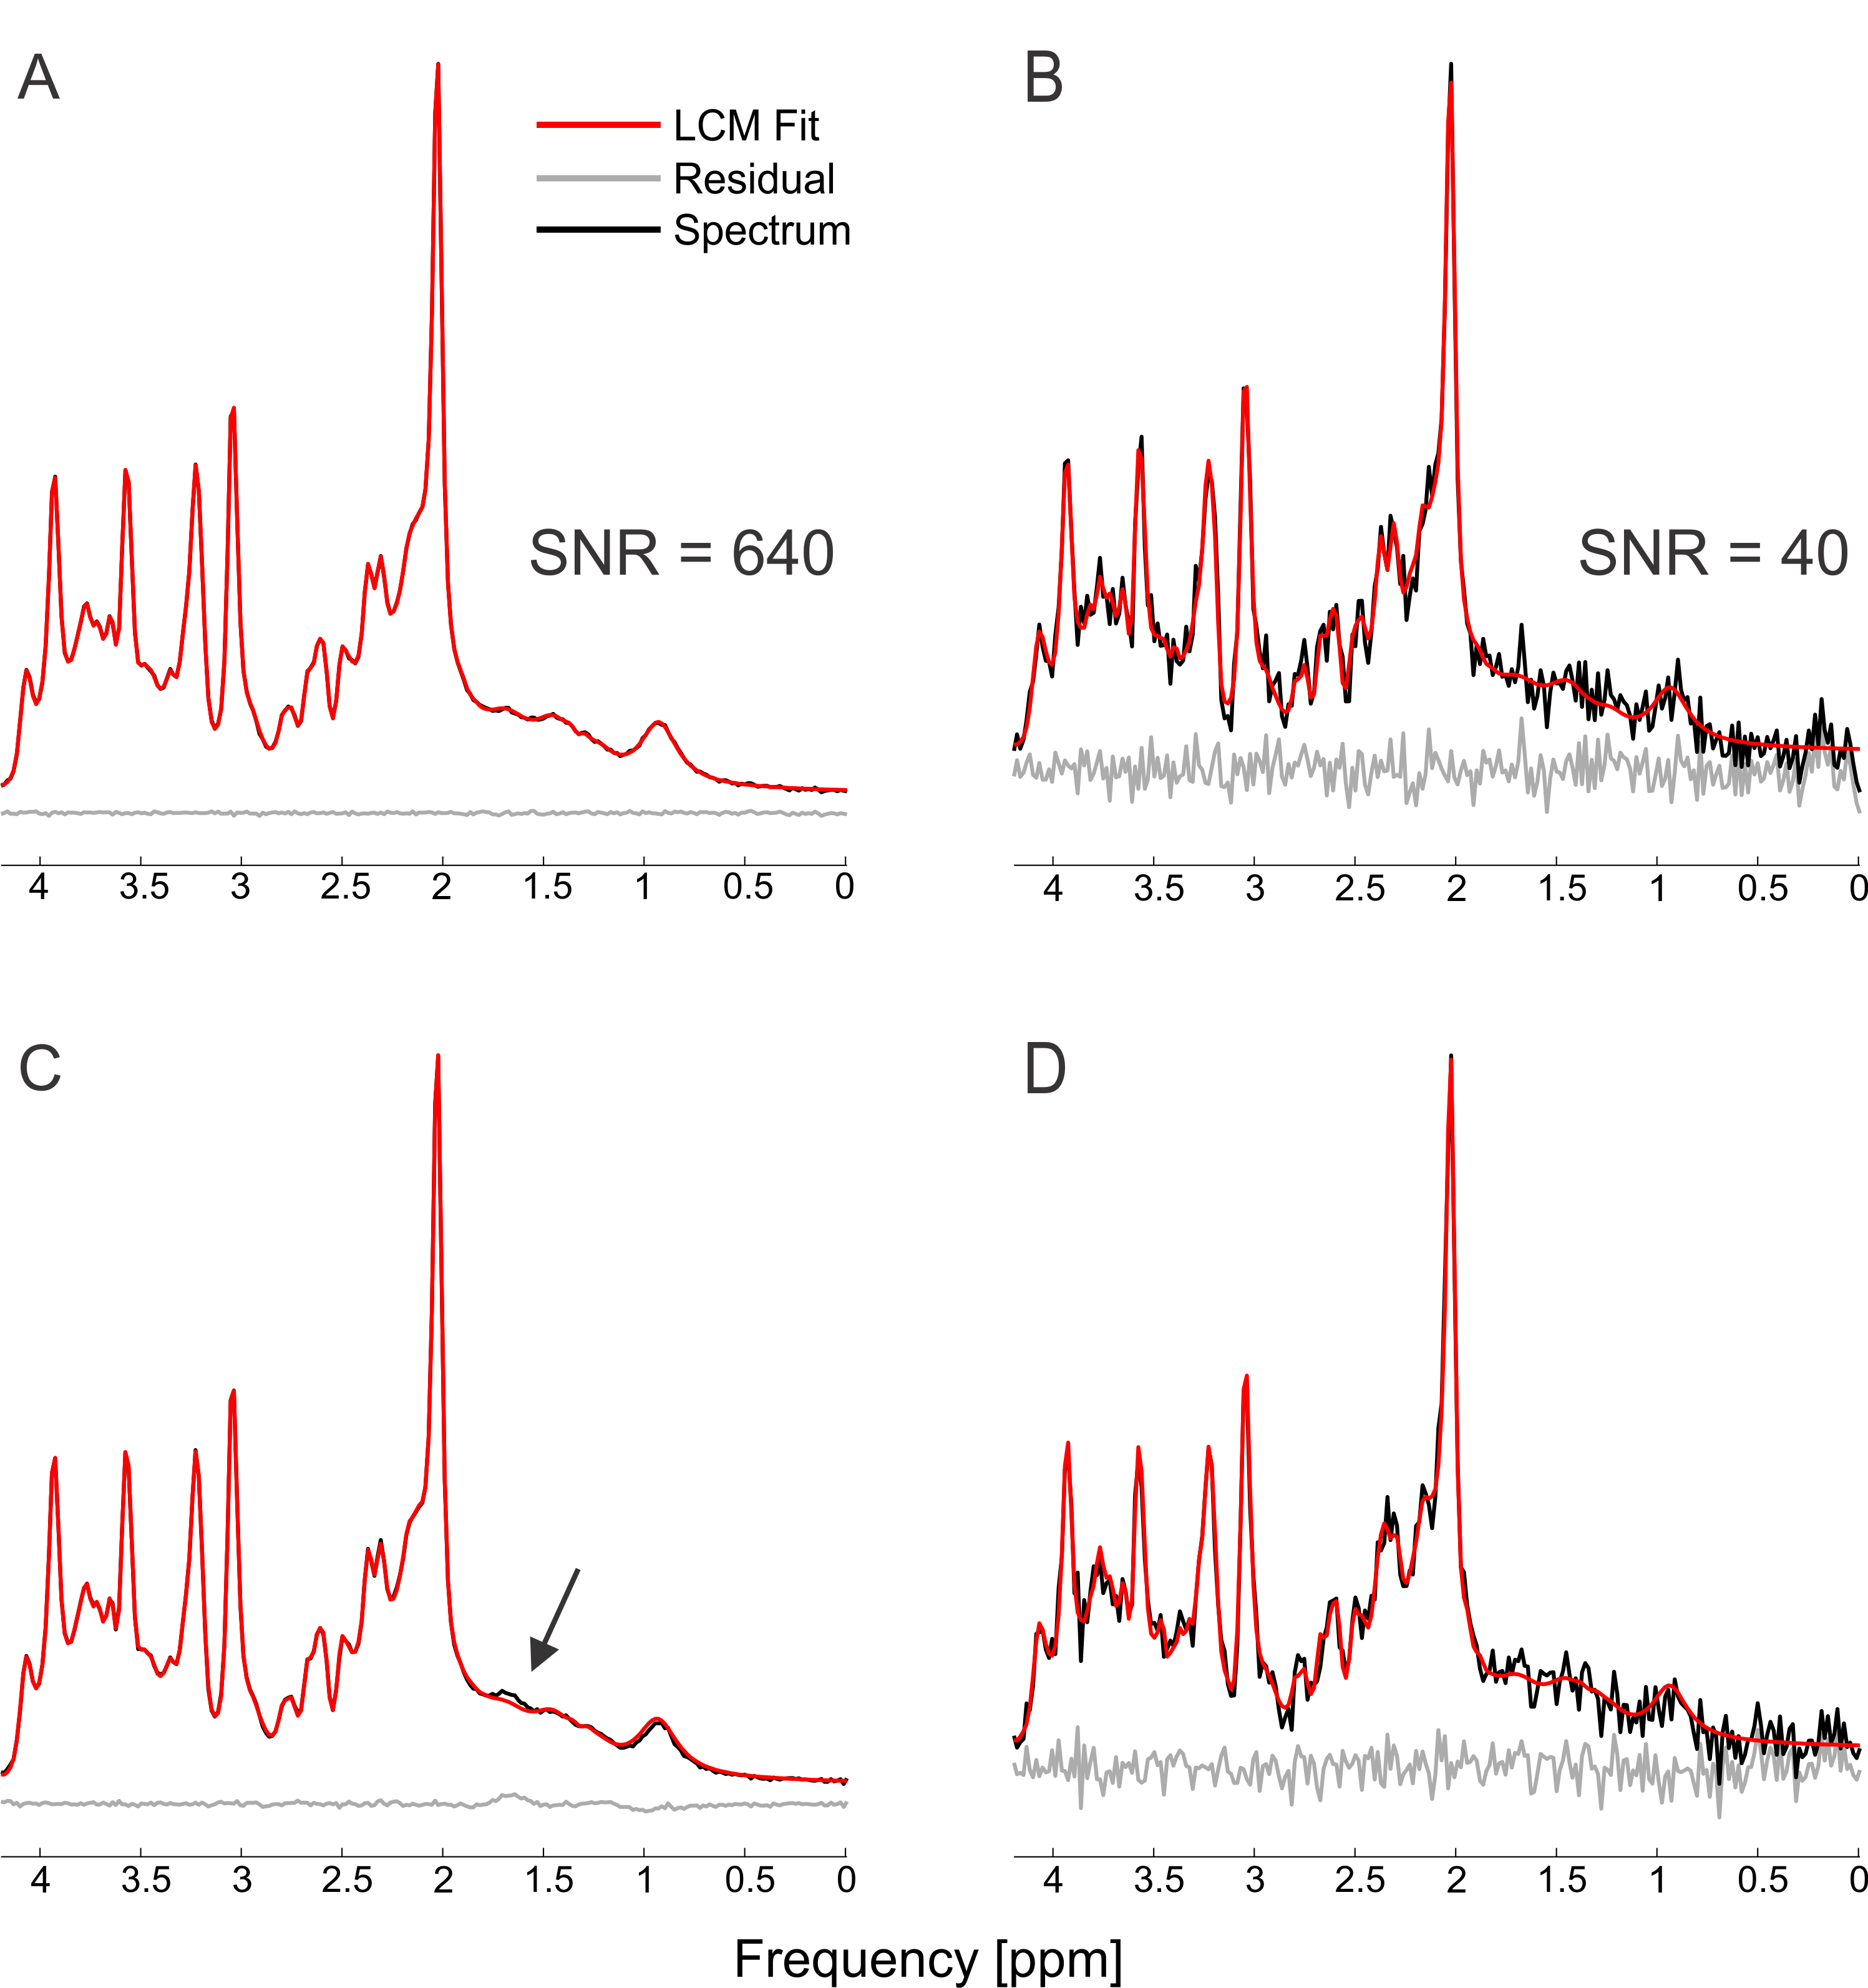
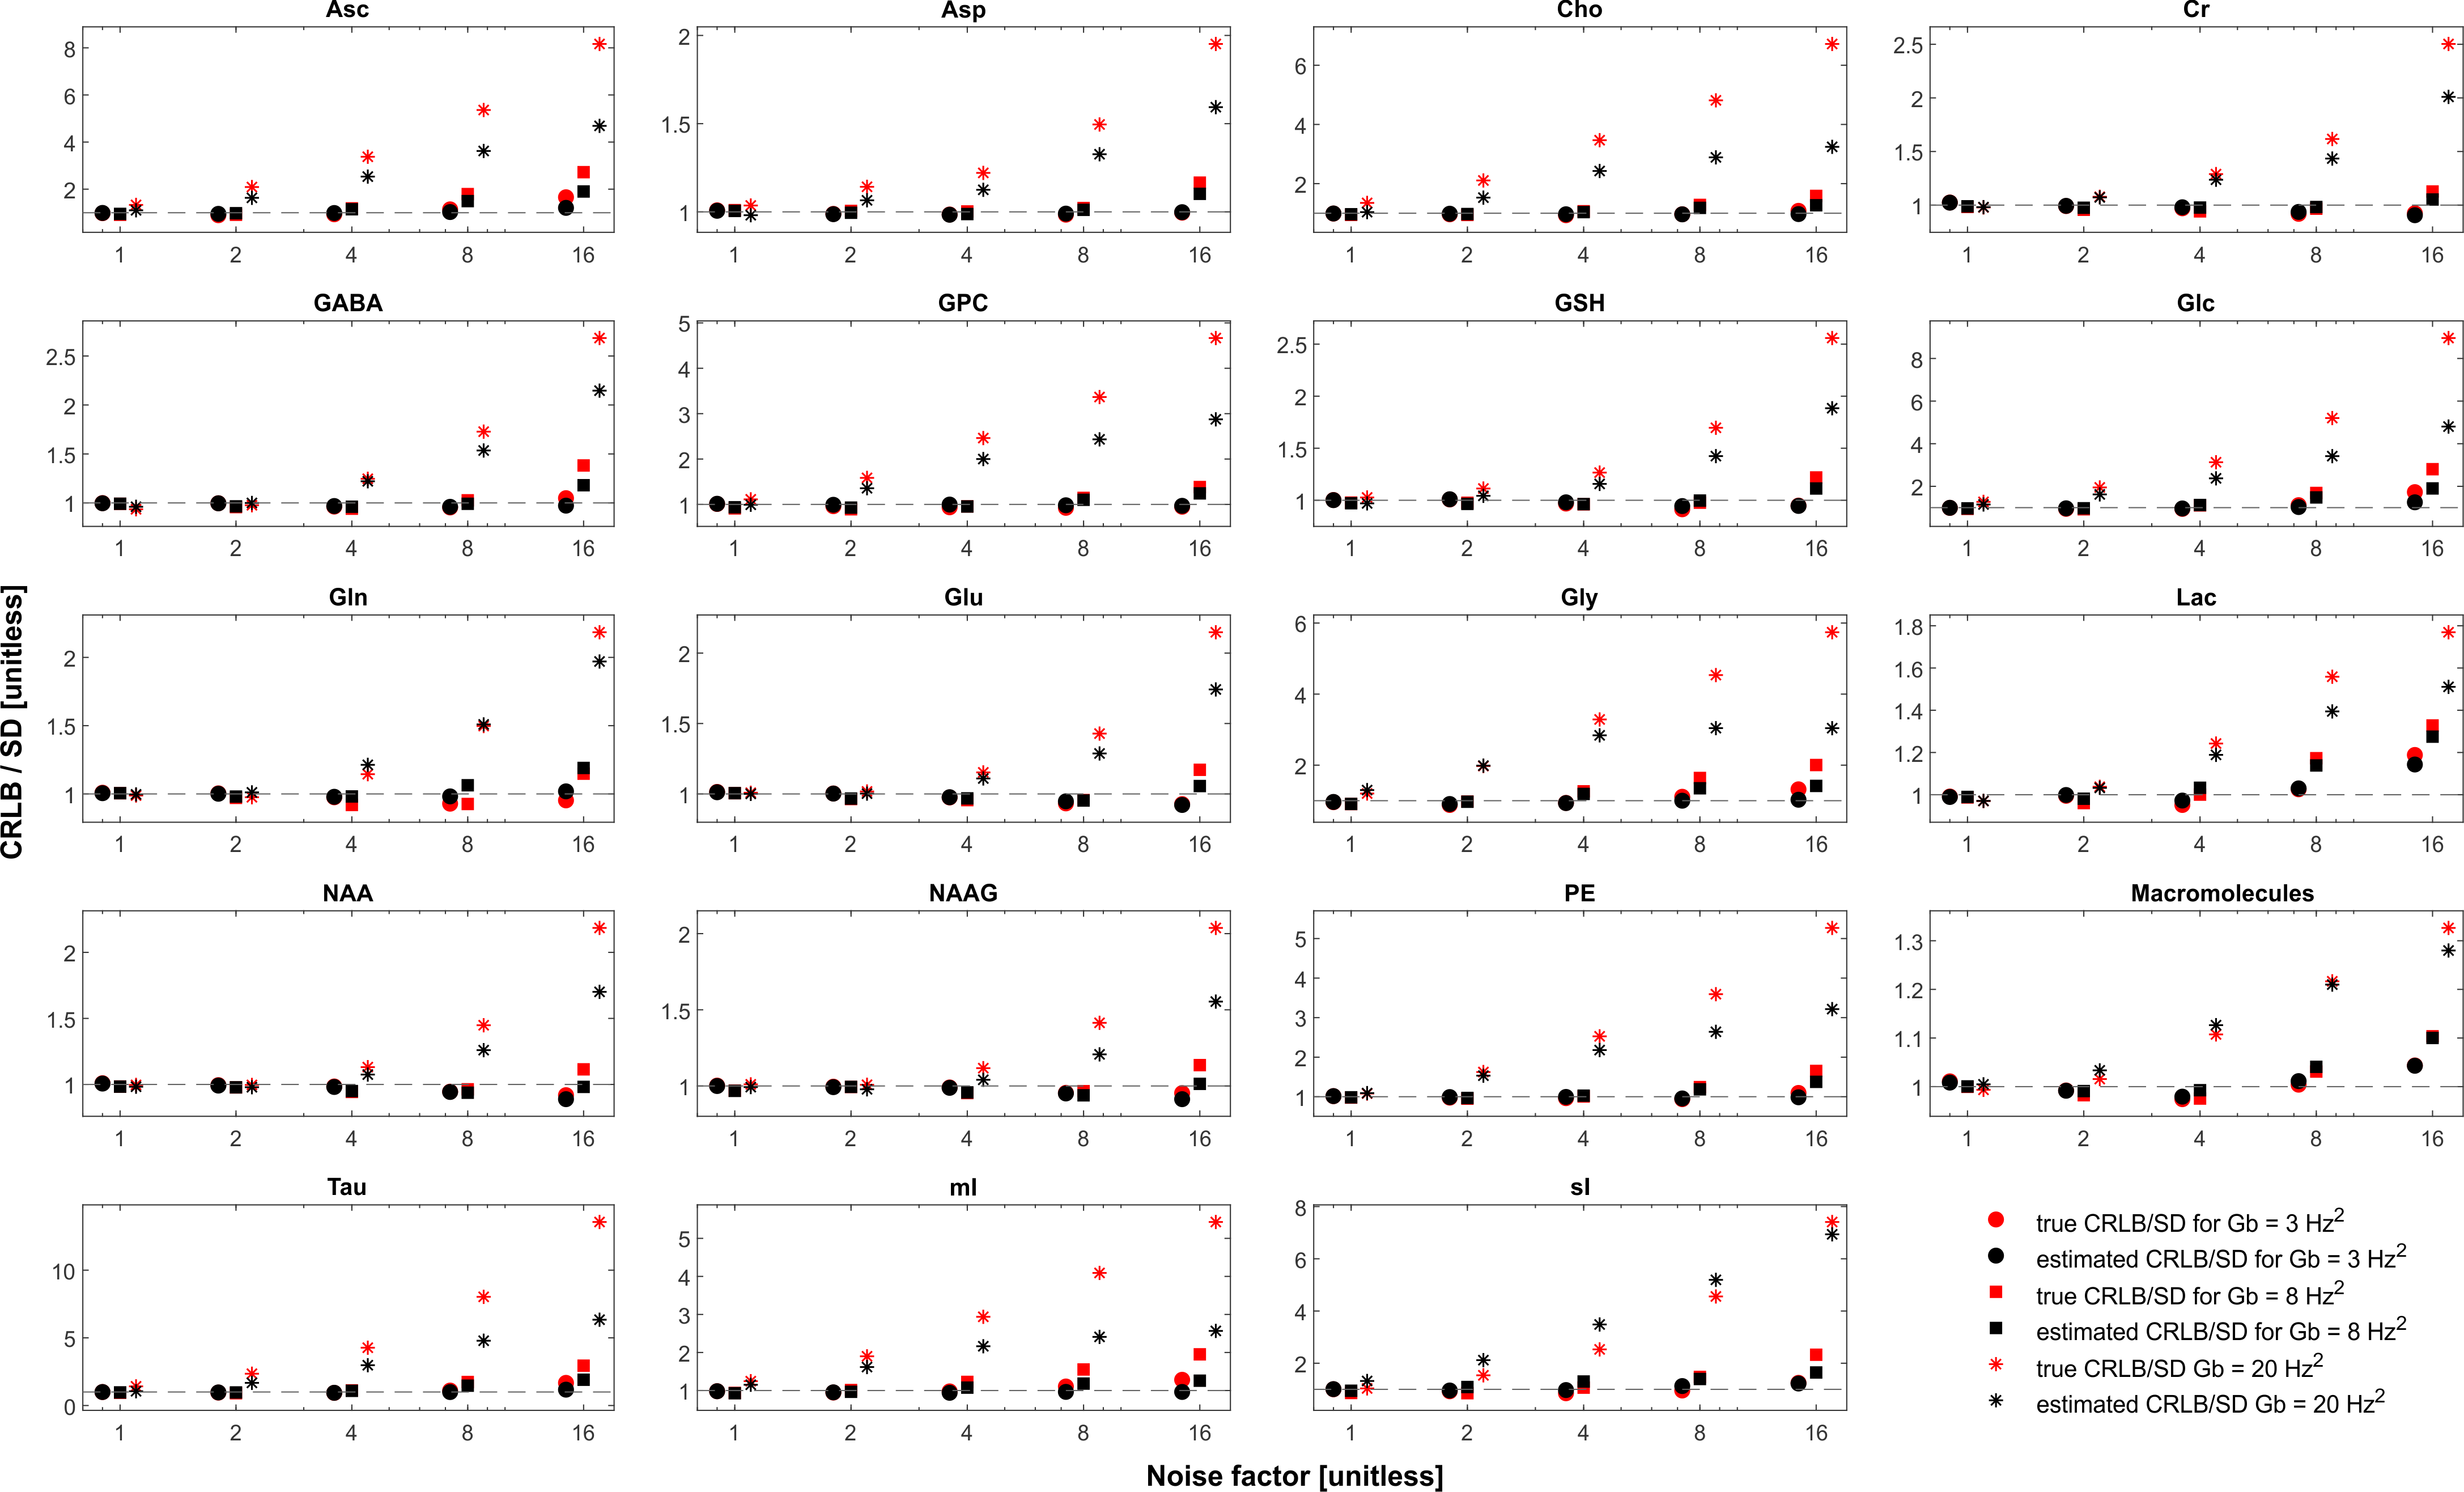
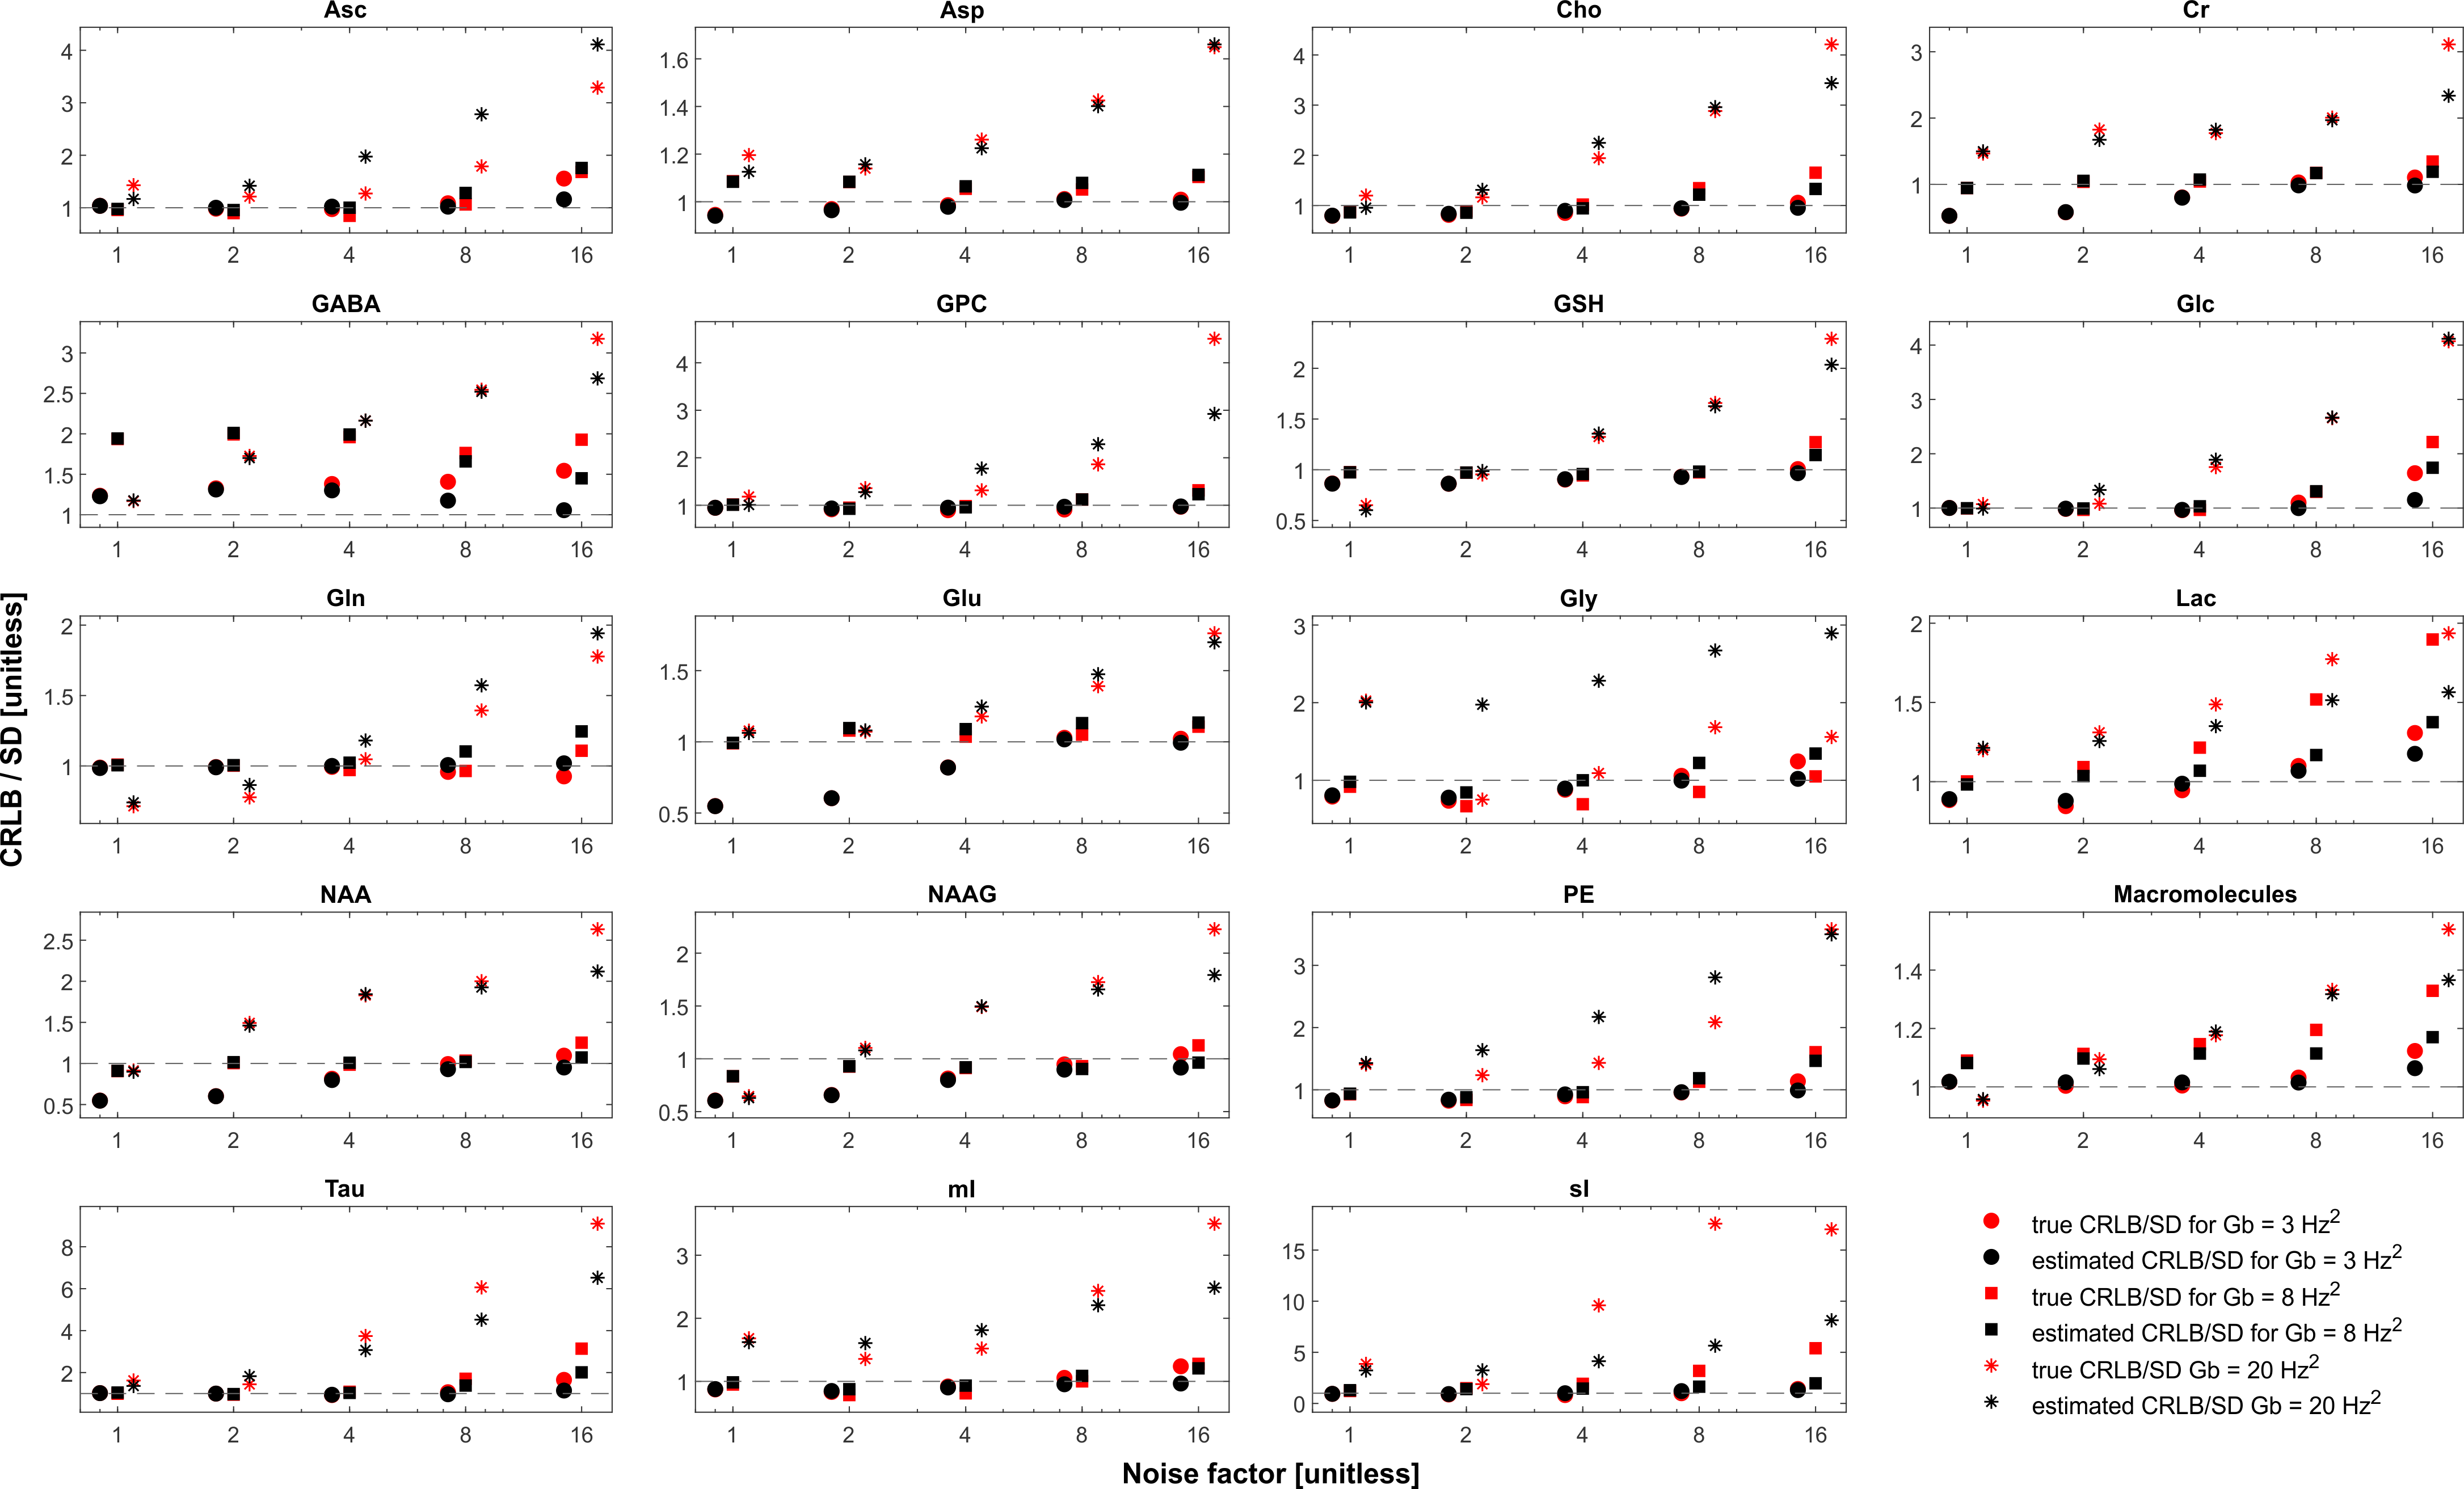
The simulated spectra appear visually very similar to those obtained experimentally with the same sequence4 (Figure 1). Excellent fits were obtained in the case where the perfect model and small but noticeable discrepancies were observed for the imperfect model (Figure 2). The number of chosen was sufficient to provide convergence for both SD and CRLB (Figure 3).In the case of a perfect model the CRLB/SD for the amplitude parameters are given in Figure 4. The true CRLB and estimated CRLB, $$$\widehat{CRLB}$$$, for all major metabolites (i.e., NAA, Cr, Glu, Gln, Cho, GPC, mI) are within 20% of the SD of amplitude when the SNR is above the breakdown threshold. Consistent with previous work10 when the SNR is below the breakdown threshold the CRLB can vary substantially from the SD.
In the case when the basis macromolecule signal deviates from the macromolecule signal in the spectrum the CRLB/SD for the amplitude parameters is given in Figure 5. The CRLB becomes a much poorer approximation for SD across virtually all metabolites. Major metabolites such as NAA and creatine can have CRLBs approximately 50% of the SD even in the cases of a high quality shim and high SNR. The appropriate parameterization of the macromolecule signals is a topic of ongoing research2,13–15, and the results here demonstrate that if the macromolecules were able to be measured accurately then CRLBs would be a reasonable approximate SDs. In other words, the CRLB is adequate at estimating the aleatoric uncertainty, while it does not incorporate the epistemic uncertainty.
In the case of an accurate model the result that CRLB/SD $$$ \approx 1$$$ indicates that the estimators are nearly efficient16. Thus the only substantial improvement novel methods such as denoising17,18, deep learning19,20 and non-Fourier methods21 will be able to yield is in relation to being able to extract values in the presence of an imperfect knowledge or in dealing with data with artefacts. These would be important improvements, however it is critical that this fundamental bound is acknowledged, which effectively eliminates the search for the holy grail of MRS algorithms: obtaining orders of magnitude more information from the same signal.
Conclusions
CRLBs and SDs were calculated via Monte Carlo simulations for 18 different metabolites and a macromolecule signal. When the model accurately represents the spectrum there is relatively little deviation between the CRLBs and SDs, provided the SNR is above the breakdown threshold, indicating that these parameter estimators are almost efficient. This finding of near-efficiency has important implications for the development of novel quantification methods such as deep learning19,20. In the case where the model does not accurately represent the data there is substantial deviations of both the estimated and true CRLB from SDs.Acknowledgements
Special thanks to Martin Gajdošík, PhD, and Kelley Swanberg, MSc, for fruitful discussions and input.References
1. Cavassila, S., Deval, S., Huegen, C., Ormondt, D. v & Graveron-Demilly, D. Cramér–Rao bounds: an evaluation tool for quantitation. NMR Biomed 14, 278–283 (2001).
2. Landheer, K., Gajdosik, M., Treacy, M. & Juchem, C. Concentration and T2 Relaxation Times of Macromolecules at 3 Tesla. Magn Reson Med 84, 2327–2337 (2020).
3. Bolliger, C. S., Boesch, C. & Kreis, R. On the use of Cramér-Rao minimum variance bounds for the design of magnetic resonance spectroscopy experiments. Neuroimage 83, 1031–40 (2013).
4. Landheer, K., Gajdosik, M. & Juchem, C. Semi-LASER Single-Voxel Spectroscopic Sequence with Minimal Echo Time of 20 ms in the Human Brain at 3 T. NMR Biomed e4324 (2020).
5. Juchem, C. et al. B0 shimming for in vivo magnetic resonance spectroscopy: Experts’ consensus recommendations. NMR Biomed 1–20 (2020). doi:10.1002/nbm.4350
6. He, W., Zhang, Y., Xu, Z., Cui, X. & Luo, H. V-shaped portable NMR sensor with a deep penetration depth and its application in assessing the aging level of turbine oils in power stations. SIAM J Optim. 6, 4148–445 (1996).
7. Prinsen, H., de Graaf, R. A., Mason, G. F., Pelletier, D. & Juchem, C. Reproducibility measurement of glutathione, GABA, and glutamate: Towards in vivo neurochemical profiling of multiple sclerosis with MR spectroscopy at 7T. J Magn Reson Imag 45, 187–198 (2017).
8. Juchem, C. INSPECTOR - Magnetic Resonance Spectroscopy Software. http://innovation.columbia.edu/technologies/cu17130_INSPECTOR
9. Cavassila, S., Deval, S., Huegen, C., van Ormondt, D. & Graveron-Demilly, D. Cramer-Rao Bound Expressions for Parametric Estimation of Overlapping Peaks: Influence of Prior Knowledge. J Magn Reson 143, 311–320 (2000).
10. Beer, R. & Ormondt, D. Analysis of NMR Data Using Time Domain Fitting Procedures. In-Vivo Magn. Reson. Spectrosc. I Probeheads Radiofreq. Pulses Spectr. Anal. 201–248 (1992). doi:10.1007/978-3-642-45697-8_7
11. Provencher, S. W. Estimation of Metabolite Concentrations from Localized in Vivo Proton NMR Spectra. Magn Reson Med 30, 672–679 (1993).
12. Novikov, D. S., Kiselev, V. G. & Jespersen, S. N. On modeling. Magn. Reson. Med. 79, 3172–3193 (2018).
13. Hoefemann, M., Bolliger, C. S., Chong, D. G. Q., van der Veen, J. W. & Kreis, R. Parameterization of metabolite and macromolecule contributions in interrelated MR spectra of human brain using multidimensional modeling. NMR Biomed. 1–18 (2020). doi:10.1002/nbm.4328
14. Murali-Manohar, S., Wright, A. M., Borbath, T. & Henning, A. T2 Relaxation Times of Macromolecules and Metabolites in the Human Brain at 9.4 T. Magn Reson Med 1–17 (2020). doi:10.1002/mrm.28174
15. Cudalbu, C. et al. Contribution of macromolecules to brain 1H MR spectra: Experts’ consensus recommendations. NMR Biomed. 1–24 (2020). doi:10.1002/nbm.4393
16. Hstadsen, A. On the existence of efficient estimators. IEEE Trans. Signal Process. 48, 3028–3031 (2000).
17. Ahmed, O. A. New denoising scheme for magnetic resonance spectroscopy signals. IEEE Trans. Med. Imaging 24, 809–816 (2005).
18. Cancino-De-Greiff, H. F., Ramos-Garcia, R. & Lorenzo-Ginori, J. V. Signal de-noising in magnetic resonance spectroscopy using wavelet transforms. Concepts Magn. Reson. Part A Bridg. Educ. Res. 14, 388–401 (2002).
19. Hatami, N., Sdika, M. & Ratiney, H. Magnetic resonance spectroscopy quantification using deep learning. Med. Image Comput. Comput. Assist. Interv. - MICCAI 2018 doi:10.1007/978-3-030-00928-1_53
20. Lee, H. H. & Kim, H. Intact metabolite spectrum mining by deep learning in proton magnetic resonance spectroscopy of the brain. Magn. Reson. Med. 82, 33–48 (2019).
21. Belkic, D. & Belkic, K. Automatic self-correcting in signal processing for magnetic resonance spectroscopy: noise reduction, resolution improvement and splitting overlapped peaks. J. Math. Chem. 57, 2082–2109 (2019).
Figures