2830
The effects of basis sets on magnetic resonance spectroscopy quantification for stock PRESS sequences, a simulation study1Biomedical Engineering, Columbia University, New York City, NY, United States, 2Radiology, Columbia University, New York City, NY, United States
Synopsis
Realistic synthetic PRESS spectra were generated for three different echo times for each of the three major vendors. These spectra were then fit to the matched basis set (i.e., the basis set used to generate it), as well as the mismatched basis sets at the same echo time from other vendors, and the matched basis set but with the hard pulse approximation, to investigate how sensitive resulting quantification is to basis sets. It was found that the concentration for low-concentration metabolites is highly susceptible to small changes in basis sets (e.g., GABA varied by 115 ± 188%).
Introduction
Point resolved spectroscopy1 is the most commonly used magnetic resonance spectroscopy sequence, and the major vendors’ implementations differ in the shape of the RF pulses2 with the refocusing pulses being of particular importance for resulting spectral shapes as well as their exact timings (i.e., TE1/TE2). For example, the General Electric (GE) utilizes 137° Shinnar-Le Roux pulses3 (the 137° enables shorter pulses at the cost of $$$ \text{sin}\left(\frac{137}{180} \pi \right)^4 \approx 0.75 $$$ factor in signal decrease) for refocusing pulses, while Siemens uses 180° Mao pulses4. As such, the spectral shape for J-coupled metabolites acquired across different platforms at the same echo time will vary. Although it has previously been shown that this can result in substantially different spectral shapes obtained from the different vendor implementations at the same echo time2 the effects on quantification with realistic spectra have yet to be investigated. Realistic synthetic spectra were generated for three different echo times for each of the three major vendors: Siemens, GE and Philips. These synthetic spectra were fit to the matched basis set (i.e., the basis set used to generate it), a basis set using the matched timings and flip angles but with the hard pulse approximation, as well as the mismatched basis sets at the same echo time from the two other vendors to investigate how sensitive resulting quantification is to small changes in basis sets. It was shown with realistic synthetic data in both metabolite concentrations and spectral appearance, where the ground truth is known, that the concentration for low-concentration metabolites is highly susceptible to small changes in basis sets.Methods
Synthesis of SpectraSpectra were simulated for each of the three vendors and three echo times (30/80/144 ms) using exact timings and shaped RF specific to the vendor and echo time in MARSS7. The vendor basis sets were simulated with 1283 spatial points to appropriately model the transition bands2, and the hard pulse basis set was generated by only using a single spatial point for each of the three vendors. Spectra were synthesized at each TE similar to what has previously been performed8,9. This was achieved by exponentially line broadening each of the simulated 18 metabolites by $$$\frac{1}{\pi T_2^m}$$$, where $$$T_2^m$$$ is the transverse relaxation constant for each of the individual metabolites, then broadening by a Gaussian linewidth of 8 Hz2 to resemble the effect of field inhomogeneities (NAA fullwidth at half maximum of 6.2 Hz), which reflects a good linewidth in the occipital cortex at 3T10. These broadened simulated spectra were then scaled by their respective concentration11, and multiplied by the appropriate scaling factors derived from analytical solutions to the Bloch equation for each echo time and metabolite to incorporate realistic $$$T_1$$$ and $$$T_2$$$ relaxation12–16. The macromolecule signal was approximated as the sum of 10 individual Lorentzian resonances with measured concentration and T2 values17.
Quantification of Spectra
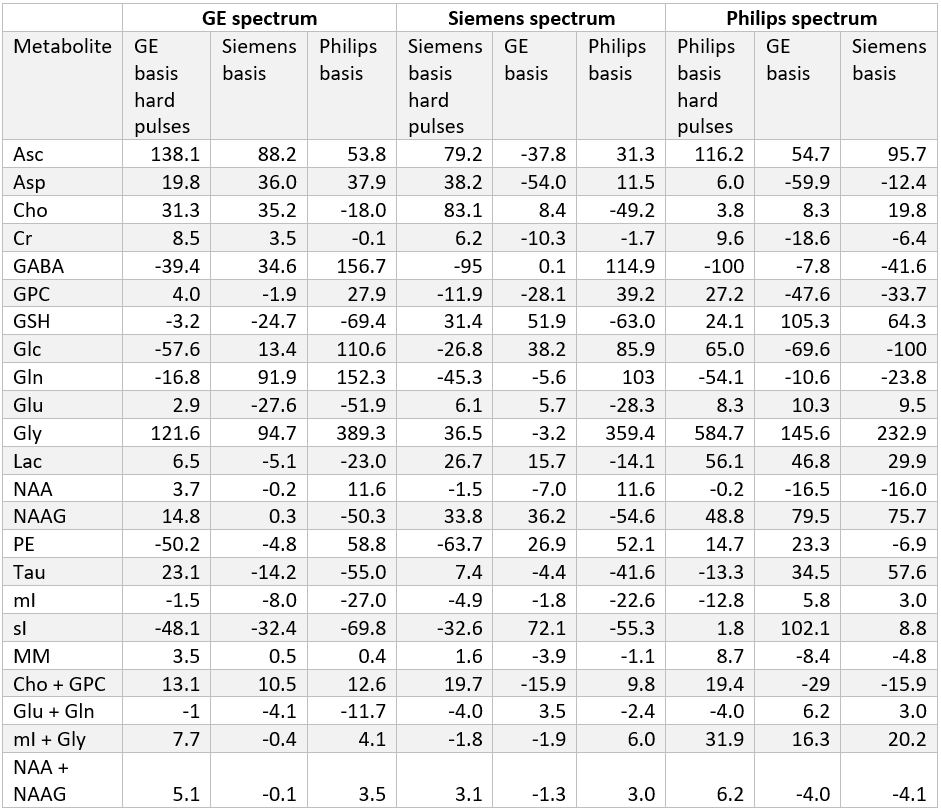
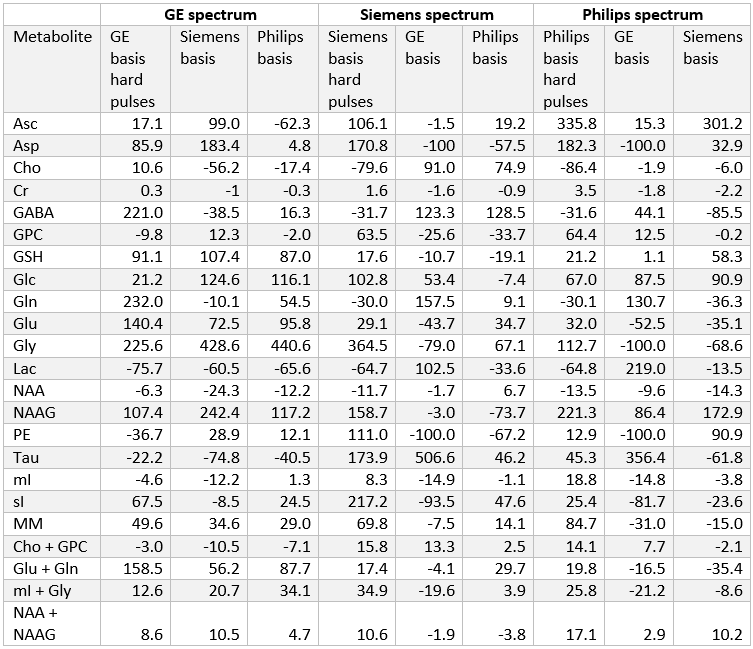
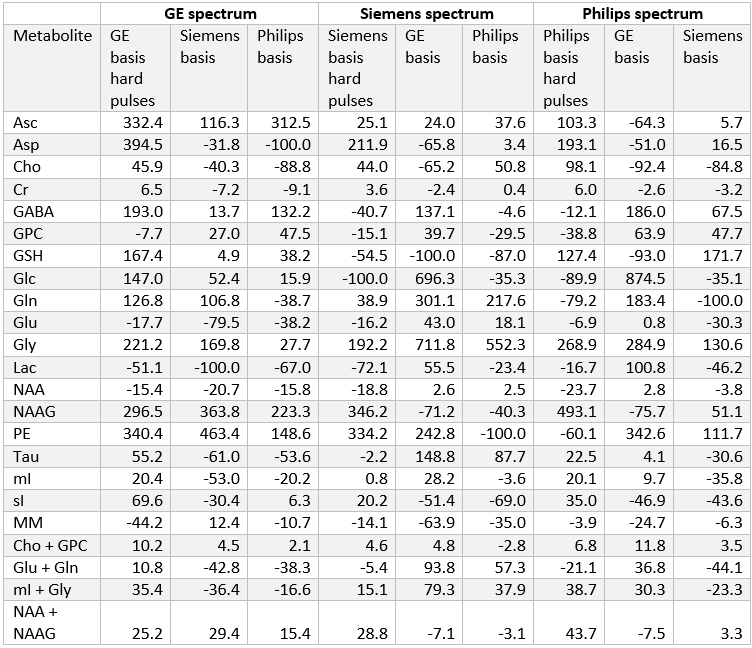
Spectra were simulated for a TE = 30 ms (general-purpose short echo spectroscopy), TE = 80 ms (for glutamate detection5) and TE = 144 ms (for lactate detection6) for each of the three major vendors. At each individual echo time the synthesized spectra were then fit via linear combination modelling (LCM) in INSPECTOR18,19 to each of the four basis sets. The relative errors, $$$RE^{B_v(TE)}_m(TE)$$$ for each of the metabolites and macromolecules calculated using each vendor basis set were then calculated via $$ RE^{B_v(TE)}_m(TE)=\frac{C_m^{B_v(TE)}(TE)-C_m^T}{C_m^T}\cdot 100 \% $$
where $$$C_m^{B_v(TE)}$$$ is the concentration extracted from the LCM fit at each of the three echo times using the basis set $$$B_v(TE)$$$ and $$$C_m^T$$$ represents the ground truth concentrations known a priori and hence are irrespective of echo time.
Results and Discussion
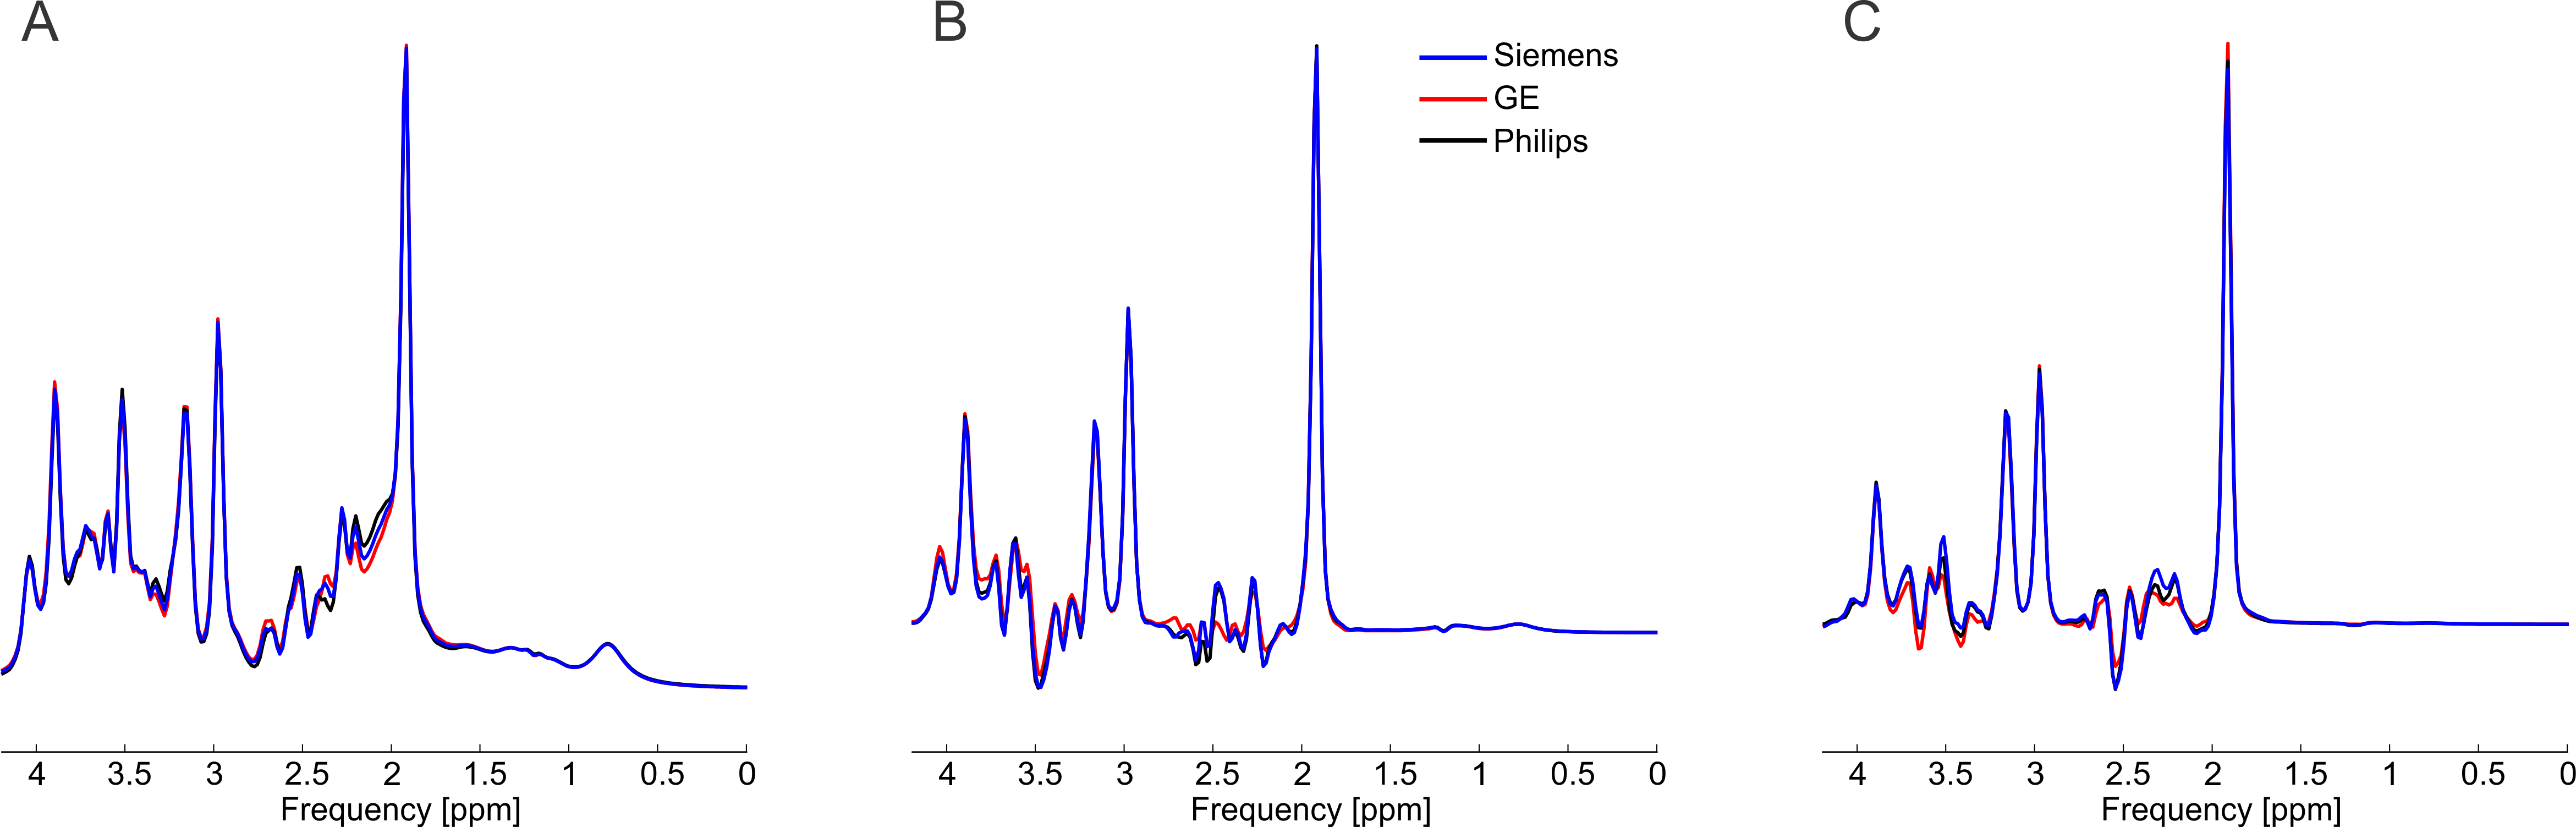
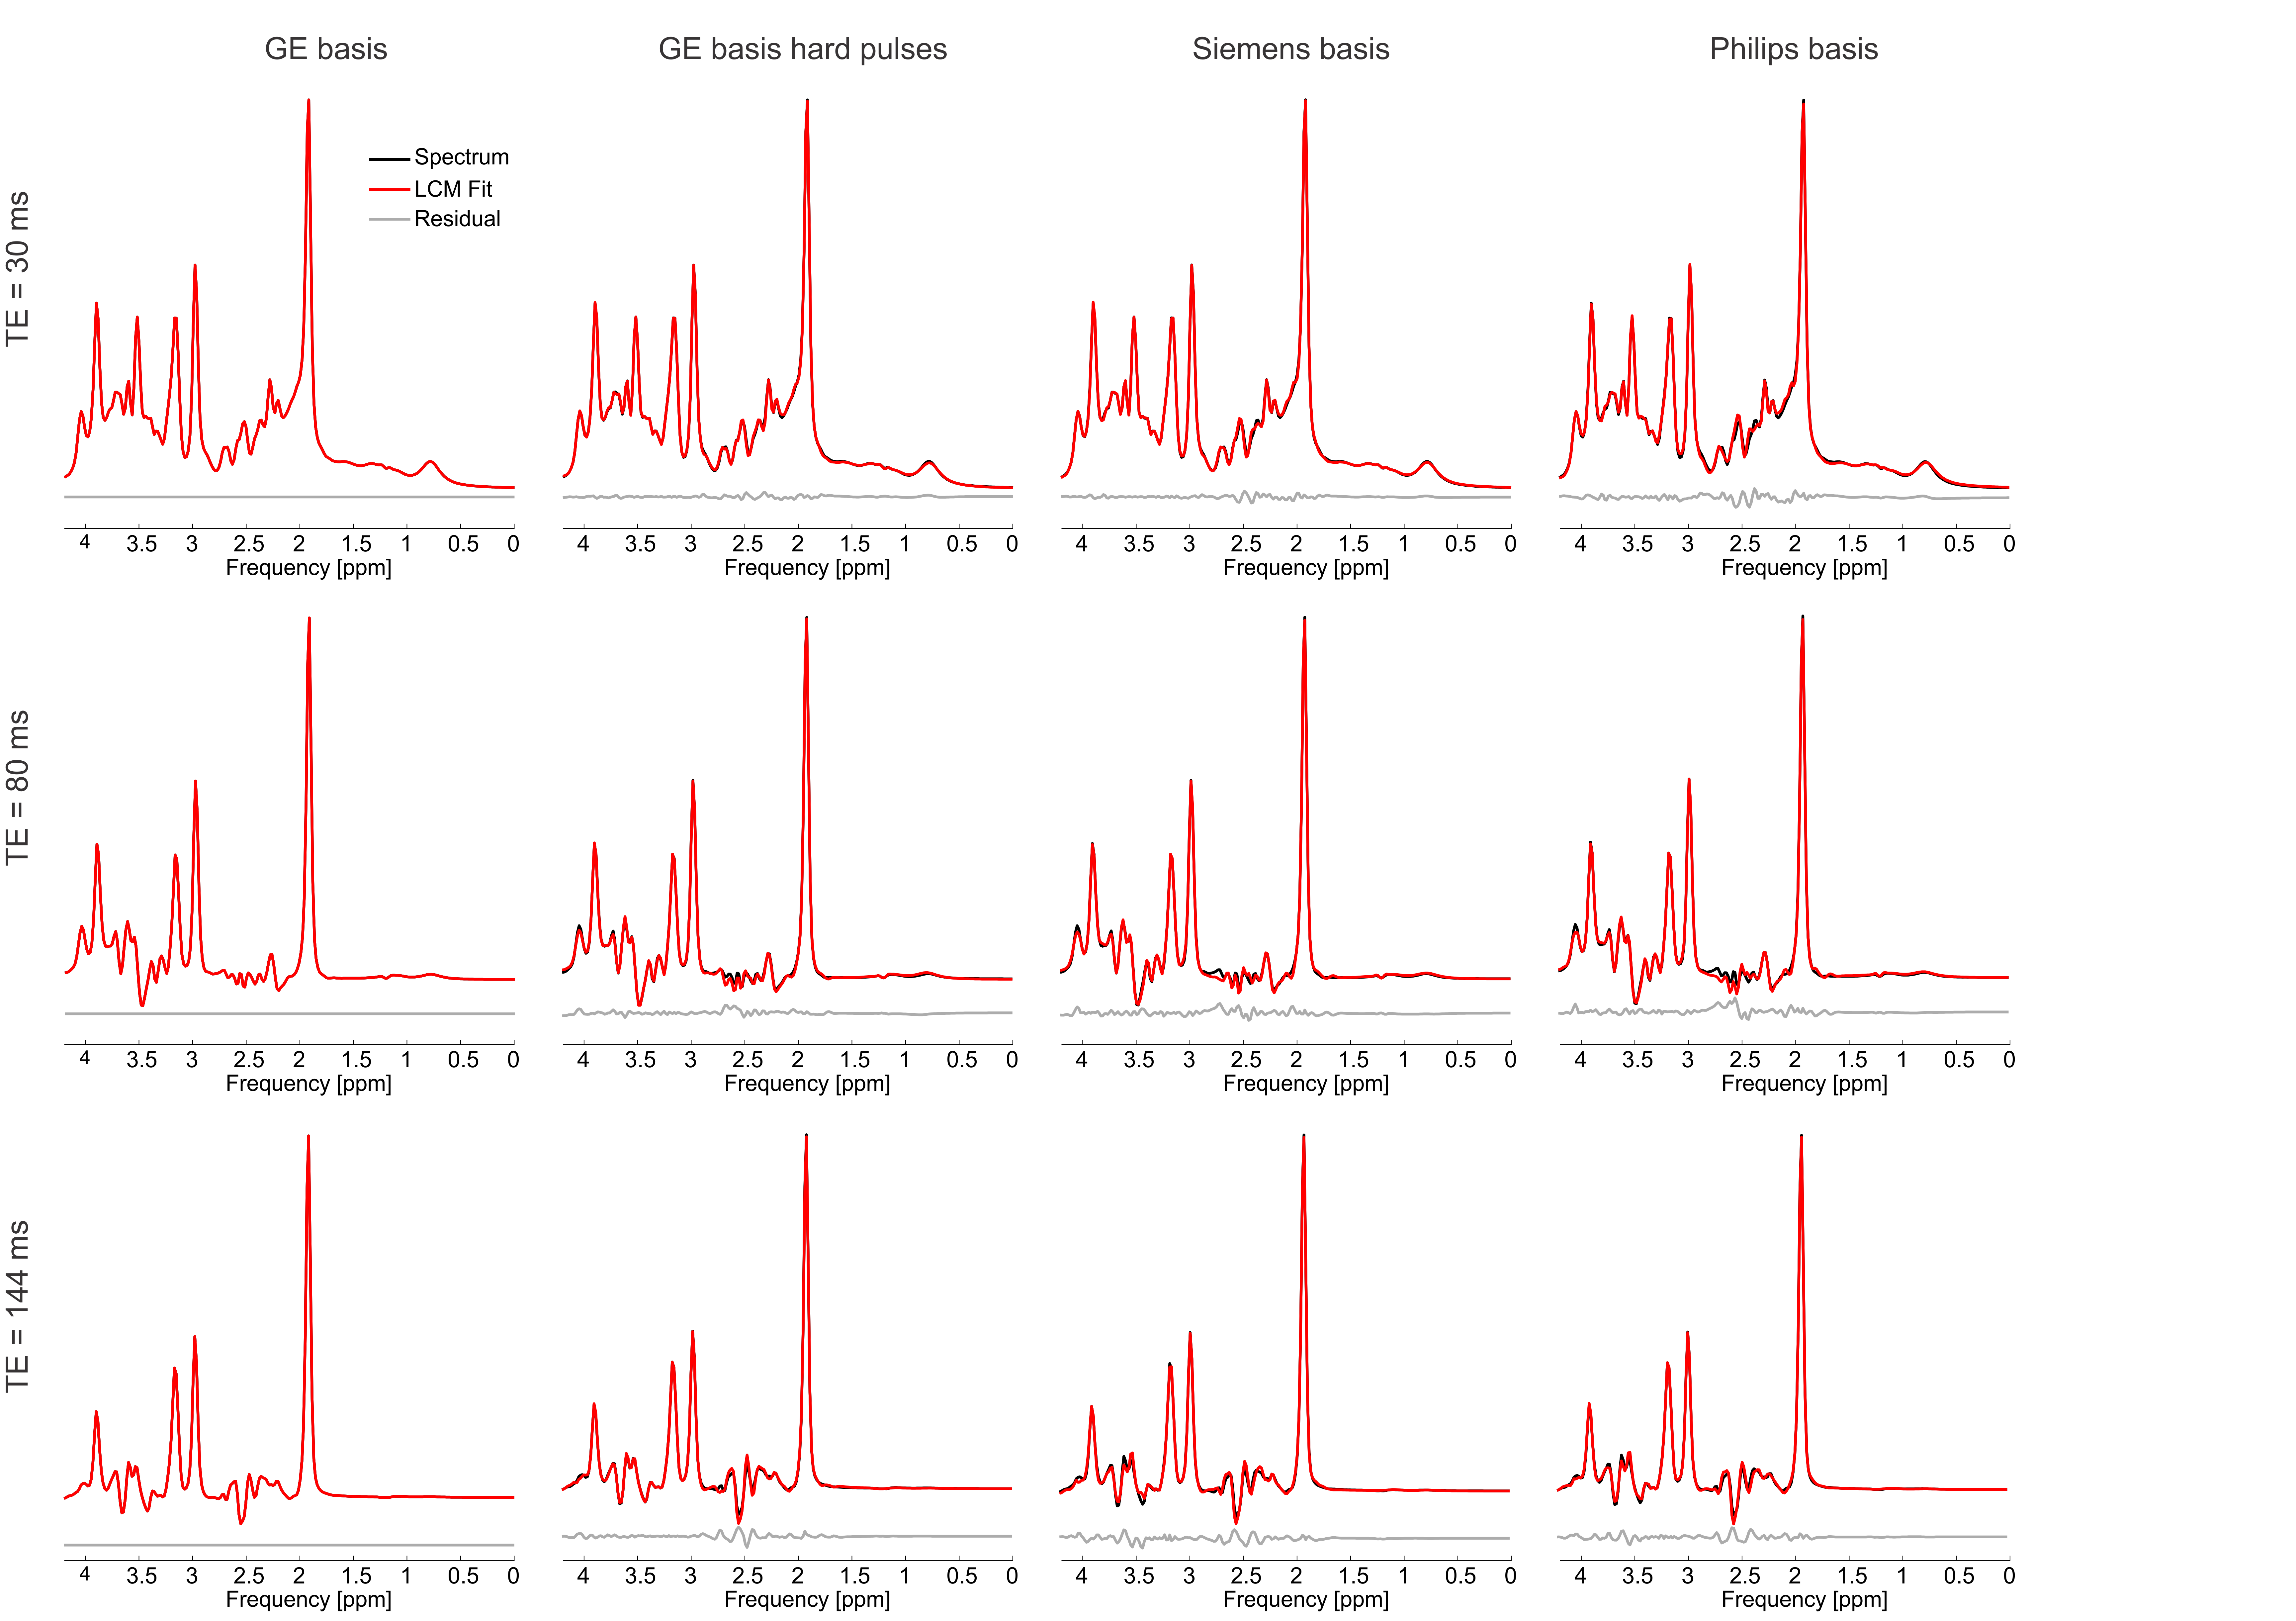
At each simulated echo time, small but noticeable differences between the three vendors were observed (Figure 1). Perfect fits were acquired in the case when the basis set matched the synthesized data, resulting in accurate quantification, i.e. 0% error, as expected. Spectra were noise free so that the measured relative errors can be directly attributed to imperfect fits. Fits obtained with the other basis sets, for instance, in vivo Siemens spectrum analyzed with GE basis set, had noticeable small but non-zero residuals (the three synthesized GE spectra are shown in Figure 2, with results for Siemens and Philips being similar but not shown). Despite all fits having relatively small residuals the concentration of all low-concentration metabolites for all echo times varied substantially from the known ground truth when suboptimal basis sets were employed for all three echo times (Tables 3-5). Longer echo times exacerbated these issues, which is expected as all TE = 0 ms spectra would be identical. The large relative errors despite adequate fits are a result of overlapping metabolites masquerading for one another. These results are consistent with previous results demonstrating that fit quality alone cannot validate a model20.Conclusions
Basis sets which do not use the experimentally realistic shaped RF pulses and timings, or basis sets which employ the hard pulse approximation, can appear to produce adequate quality fits, however the concentration of critical metabolites derived through linear combination modeling can vary substantially from the ground truth. The only remedy are basis sets that match the experimental reality as closely as possible.Acknowledgements
No acknowledgement found.References
1. Bottomley, P. A. Spatial Localization in NMR Spectroscopy in Vivo. Ann N Y Acad Sci 508, 333–348 (1987).
2. Landheer, K., Swanberg, K. M. & Juchem, C. Magnetic Resonance Spectrum Simulator (MARSS), A Novel Software Package for Fast and Computationally Efficient Basis Set Simulation. NMR Biomed e4129 (2019).
3. Pauly, J., Le Roux, P., Nishimura, D. & Macovski, A. Parameter Relations for the Shinnar-Le Roux Selective Excitation Pulse Design Algorithm. IEEE Trans Med Imag 10, 53–65 (1991).
4. Mao, J., Mareci, T. H. & Andrew, E. R. Experimental study of optimal selective 180° radiofrequency pulses. Jour Magn Reson 79, 1–10 (1988).
5. Schubert, F., Jurgen, G., Seifert, F. & Rinneberg, H. Glutamate concentrations in human brain using single voxel proton magnetic resonance spectroscopy at 3 Tesla. Neuroimage 21, 1762–1771 (2004).
6. Lange, T., Dydak, U., Roberts, T. P. L., Bjeljac, M. & Boesiger, P. Pitfalls in Lactate Measurements at 3T. Am J Neuroradiol 27, 895–901 (2006).
7. Landheer, K. & Juchem, C. Recommendations for Accurate Basis Set Generation for Magnetic Resonance Spectroscopy Quantification. in International Society for Magnetic Resonance in Medicine 4239 (2018).
8. Bolliger, C. S., Boesch, C. & Kreis, R. On the use of Cramér-Rao minimum variance bounds for the design of magnetic resonance spectroscopy experiments. Neuroimage 83, 1031–40 (2013).
9. Landheer, K., Gajdosik, M. & Juchem, C. Semi-LASER Single-Voxel Spectroscopic Sequence with Minimal Echo Time of 20 ms in the Human Brain at 3 T. NMR Biomed e4324 (2020).
10. Juchem, C. et al. B0 shimming for in vivo magnetic resonance spectroscopy: Experts’ consensus recommendations. NMR Biomed 1–20 (2020). doi:10.1002/nbm.4350
11. de Graaf, R. A. In Vivo NMR Spectroscopy: Principles and Techniques. (1998).
12. Mlynarik, V., Gruber, S. & Moser, E. Proton T1 and T2 relaxation times of human brain metabolites at 3 Tesla. NMR Biomed. 14, 325–331 (2001).
13. Puts, N. A. J., Barker, P. B. & Edden, R. A. E. Measuring the longitudinal relaxation time of GABA in vivo at 3T. J Magn Reson Imag 37, 999–1003 (2013).
14. Landheer, K., Sahgal, A., Myrehaug, S., Chen, A.P., Cunningham, C.H., Graham, S.J. A rapid inversion technique for the measurement of longitudinal relaxation times of brain metabolites: application to lactate in high-grade gliomas at 3 T. NMR Biomed. 29, 1381–1390 (2016).
15. Xin, L., Schaller, B., Mlynarik, V., Lu, H. & Gruetter, R. Proton T1 relaxation times of metabolites in human occipital white and gray matter at 7 T. Magn Reson Med 69, 931–936 (2013).
16. Wyss, P. O. et al. In Vivo Estimation of Transverse Relaxation Time Constant (T2) of 17 Human Brain Metabolites at 3T. Magn Reson Med 80, 452–461 (2018).
17. Landheer, K., Gajdosik, M., Treacy, M. & Juchem, C. Concentration and T2 Relaxation Times of Macromolecules at 3 Tesla. Magn Reson Med 84, 2327–2337 (2020).
18. Prinsen, H., de Graaf, R. A., Mason, G. F., Pelletier, D. & Juchem, C. Reproducibility measurement of glutathione, GABA, and glutamate: Towards in vivo neurochemical profiling of multiple sclerosis with MR spectroscopy at 7T. J Magn Reson Imag 45, 187–198 (2017).
19. Juchem, C. INSPECTOR - Magnetic Resonance Spectroscopy Software. http://innovation.columbia.edu/technologies/cu17130_INSPECTOR
20. Novikov, D. S., Kiselev, V. G. & Jespersen, S. N. On modeling. Magn. Reson. Med. 79, 3172–3193 (2018).
Figures