2746
A digital brain perfusion phantom for validation of ASL data post-processing software1Laboratory of Functional MRI Technology (LOFT), Mark & Mary Stevens Neuroimaging and Informatics Institute, University of Southern California, Los Angeles, CA, United States, 2Department of Diagnostic Radiology and Nuclear Medicine, School of Medicine, University of Maryland, Baltimore, MD, United States
Synopsis
A digital brain perfusion phantom was designed using a representative 5-delay 3D pCASL protocol and applied to validate the quantification accuracy of 4 ASL post-processing software packages, including ASLtbx, ASL_MRICloud, BASIL, and Cereflow. The 4 tested software can produce generally correct quantification results under normal SNR conditions, however their accuracy may be affected by the limitation occurred in low perfusion regions and low SNR condition. The digital phantom provides a reliable reference with high flexibility to validate ASL post-processing software.
Introduction
Arterial spin labeling (ASL) provides a non-invasive measurement for hemodynamic parameters such as cerebral blood flow (CBF) and arterial transit time (ATT). Recently, the standard protocol for ASL data acquisition has been recommended by the ASL white paper1. However, the consensus for processing ASL MRI data has not been reached and ideally should be evaluated with a known reference. Several ASL post-processing packages have been proposed in the literature, including ASLtbx2, ASL-MRICloud3, BASIL4, and Cereflow5. Each of them often has a pipeline consisting of skull stripping, motion correction, kinetic model fitting, and calibration. Validating the entire procedure requires a phantom with realistic anatomical structures, Control/Label image pairs, and proton density weighted image (M0). Although physical ASL perfusion phantoms have been introduced, they often lack these anatomical and imaging features required for post-processing software. In this study, we designed a digital brain perfusion phantom and applied it to evaluate the quantification accuracy of the four packages mentioned above with a representative 5-delay 3D pseudo-Continuous ASL (pCASL) protocol.Methods
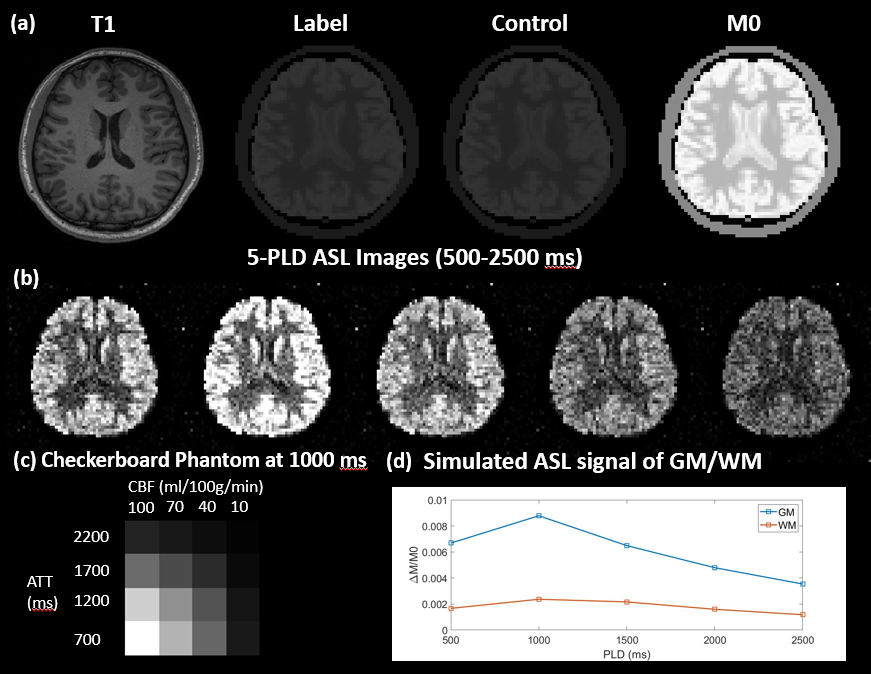
A healthy subject (25-years male) was scanned on Siemens Prisma 3T scanner using a Sagittal T1-weighted MPRAGE sequence (resolution=1×1×1mm3, FOV=240×192×256mm3, TR/TE/TI=2300/3/900ms, scan time=~5min). This MPRAGE data was segmented using FAST6 to generate the partial volume (PV) masks of the skull, gray matter (GM), white matter (WM), and Cerebrospinal fluid (CSF). The masks were cropped and down-sampled to 64×64×20 matrixes, and used as inputs for MRiLab7, an MRI simulator, to simulate M0 images using a T2 weighted Spin Echo sequence (FOV=192×192×100mm3, matrix=64×64×20, TR/TE=5000/10ms). Control images were obtained by scaling the intensity of M0 down to the one fifth to simulate the effect of background suppression. Subsequently, to simulate Label images, the perfusion signals of GM and WM were added to Control images based on the corresponding PV-masks with the CBF/ATT values of 60(ml/100g/min)/1000ms and 20(ml/100g/min)/1200ms, respectively. The one-compartment ASL kinetic model8 was employed for a 5-delay 3D pCASL protocol (PLD=500:500:2500ms, background suppressed, labeling efficiency=0.735, labeling duration=1.5s) to generate perfusion signals as shown in Fig.1(d). Gaussian complex noise was added in the k-space of perfusion images so that the signal-to-noise ratio (SNR) of WM was 1 for normal SNR condition or 0.5 for low SNR condition. A sample slice of M0, label, and control images are presented in Fig.1(a). The label-control difference image led to a series of realistic perfusion images of the brain with PV-effect as shown in Fig.1(b). Additionally, a 4x4 checkerboard (Fig.1(c)) with 4 CBF values (10,40,70, and 100ml/100g/min) and 4 ATT values (700,1200,1700, and 2200ms) was embedded into a lower slice. The simulated digital phantom was saved in DICOM/NIFTI format and processed by 4 software respectively with matched input parameters. The experiment was repeated five times under 2 SNR conditions, and the resultant quantitative CBF and ATT maps were evaluated based on: 1) the GM and WM voxels without PV-effect; 2) 16 grids in checkerboard.Results and discussion
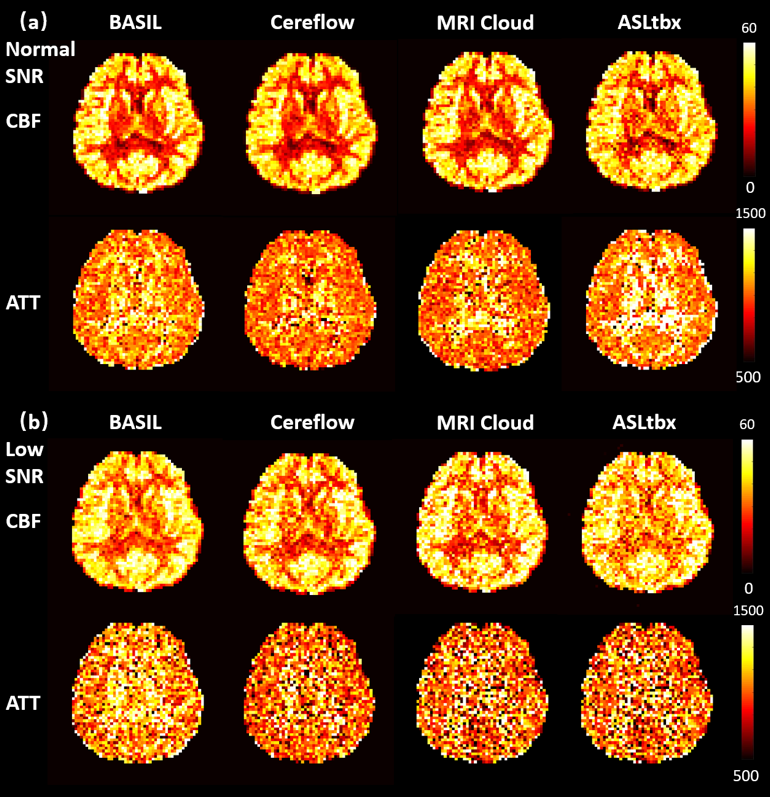
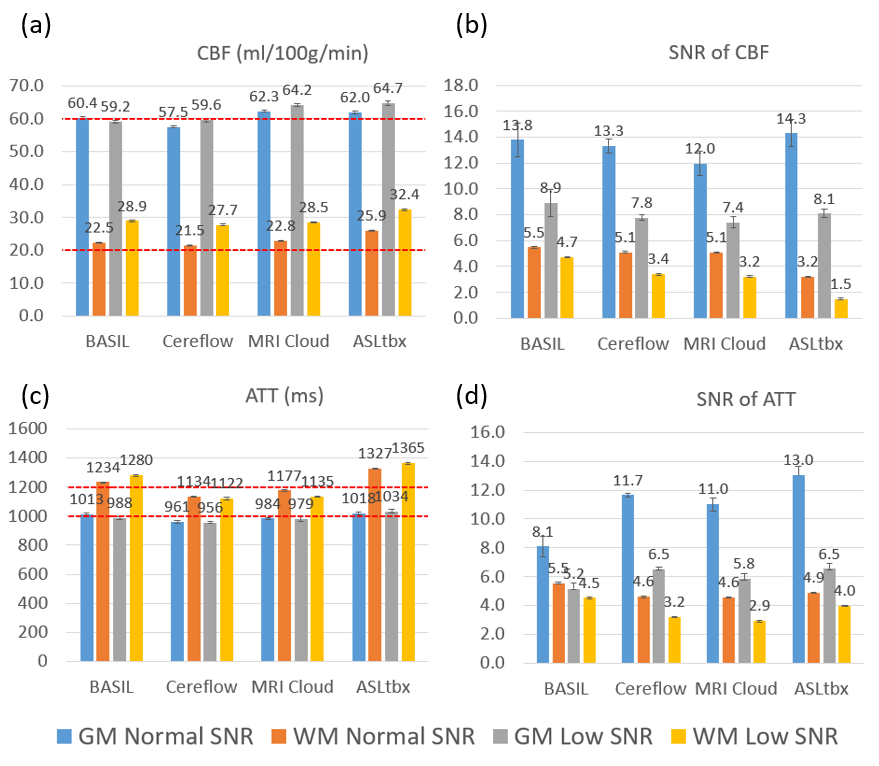
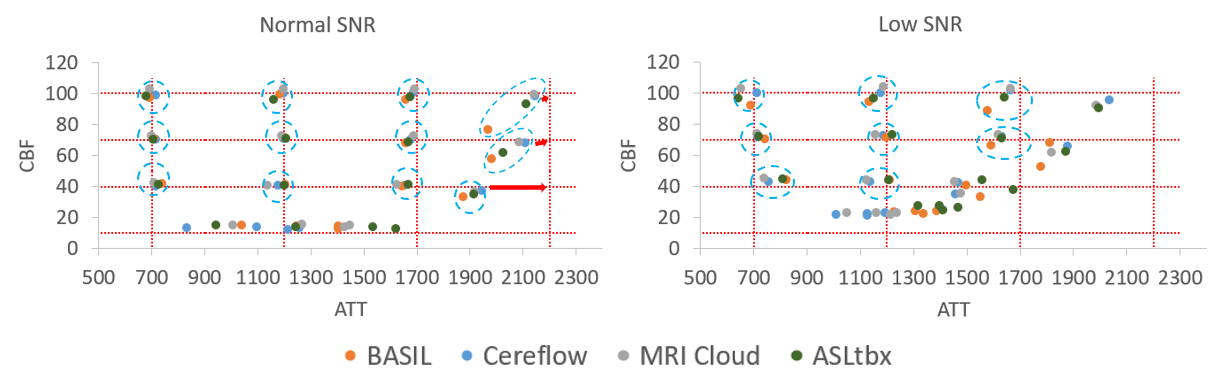
All 4 software processed the DICOM/NIFTI files of the digital phantom and produced reasonable CBF and ATT maps under normal and low SNR conditions, as shown in Fig.1(a) and (b), respectively. Furthermore, the bar charts in Fig.3 provide quantitative analysis results. Under normal SNR condition, the CBF maps from 4 software share a similar appearance except the WM CBF value from ASLtbx was overestimated with a 30% bias with a significantly noisier appearance and SNR of 3.2. The halved SNR in perfusion signals led to increased CBF and decreased SNR of WM CBF for all 4 software, while BASIL maintained a smoother appearance with a 15% loss of WM SNR. For ATT maps, different software presented a notable difference in WM/GM contrast and mean WM ATT under normal SNR condition. Specifically, the ATT map of ASLtbx exhibited an overestimated WM ATT (1327ms) and WM/GM contrast of 1.30, while that of Cereflow and MRI Cloud displayed an underestimated WM ATT (1134 and 1177ms, respectively) and lower WM/GM contrast (1.18 and 1.19, respectively). The observed difference of WM parameter quantification may result from different spatial smoothing strategies. With halved SNR, the ATT SNR was severely compromised for all 4 packages. Figure 4(a) and (b) display the checkerboard under normal and low SNR conditions, respectively. The scatter plot in Fig.5 shows the distribution of mean values measured in 16 grids. The results show that, under normal SNR condition, the grids with shorter ATT (700 and 1200ms) and higher CBF (40,70,100 ml/100g/min) can be accurately estimated. However, all software had trouble analyzing the grids with lower CBF (10ml/100g/min) and/or longer ATT (2200ms), and the bias increased with the decrease of SNR, suggesting their limitation for the quantification of low perfused brain region or lesion under low SNR conditions.Conclusion
A digital brain perfusion phantom was designed using a representative 5-delay 3D pCASL protocol and applied to evaluate the quantification accuracy of 4 ASL post-processing packages. The 4 tested software produced generally correct quantification results under normal SNR conditions, however their accuracy may be affected in low perfusion regions and under low SNR condition. The digital phantom has high flexibility in simulating ASL signals with various kinetic models and image acquisition protocols, thereby can facilitate the development and validation of ASL post-processing software.Acknowledgements
No acknowledgement found.References
1. Alsop D, David C, Detre J, et al. Recommended implementation of arterial spin-labeled perfusion MRI for clinical applications: a consensus of the ISMRM perfusion study group and the European consortium for ASL in dementia. Magnetic resonance in medicine. 2015;73(1):102-116.
2. Wang Z, Aquirre G, Geoffrey K, et al. Empirical optimization of ASL data analysis using an ASL data processing toolbox: ASLtbx. Magnetic resonance imaging. 2008;26(2):261-269.
3. Li Y, Liu P, Li Y, et al. ASL-MRICloud: An online tool for the processing of ASL MRI data. NMR in Biomedicine. 2019;32(2):e4051.
4. Chappel M, Michael A, Groves A, et al. Variational Bayesian inference for a nonlinear forward model. Magnetic resonance in medicine. 2008;57(1):223-236.
5. Hu H, Rusin J, Peng R, et al. Multi-phase 3D arterial spin labeling brain MRI in assessing cerebral blood perfusion and arterial transit times in children at 3T. Clinical Imaging. 2019;53:210-220.
6. Zhang Y, Brady M, Smith S, et al. Segmentation of brain MR images through a hidden Markov random field model and the expectation-maximization algorithm. IEEE transactions on medical imaging. 2001; 20(1):45-57.
7. Liu F, Velikina J, Julia V, et al. Fast realistic MRI simulations based on generalized multi-pool exchange tissue model. IEEE transactions on medical imaging. 2016; 36(2):527-537.
8. Chappel M, MacIntosh, B, Okell, T, et al. Introduction to perfusion quantification using arterial spin labelling. Oxford University Press. 2018;
Figures