2732
Reproducibility and repeatability of quantitative pCASL measurements in a 3D-printed perfusion phantom1Radiology, UT Southwestern Medical Center, Dallas, TX, United States, 2Advanced Imaging Research Center, UT Southwestern Medical Center, Dallas, TX, United States
Synopsis
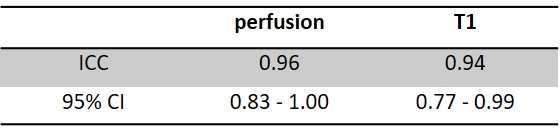
Arterial spin labelling (ASL) is a non-invasive and non-contrast perfusion imaging technique that can serve as an imaging biomarker to assess tissue blood flow characteristics. A perfusion phantom is valuable to evaluate newly developed ASL sequences, test consistency and to compare sequence reproducibility across various scanners. In this study, we performed a longitudinal assessment of the reproducibility and repeatability of perfusion measurement using 2D pCASL sequence with 20 PLDs over 5 weeks duration with a previously developed 3D printed perfusion phantom. Intra-class correlation coefficient (ICC) of measured perfusion and T1 are 0.96 and 0.94 respectively, indicating good reproducibility and repeatability.
Purpose
Arterial spin labelling (ASL) is a non-contrast perfusion imaging method that quantifies the blood flow which is one of the key physiological parameters. Perfusion abnormalities are associated with pathophysiological process such as cancer and neurodegenerative diseases. However, without a validated standard, it would be challenging to interpret the quantitative readouts. Hence a well calibrated and validated perfusion measures are highly desirable for efficient and safe clinical implementation of the ASL sequence [1, 2]. Perfusion phantom can enable ground truth evaluations such as quality control and cross-scanner comparison of ASL sequences, which will ensure consistency of longitudinal ASL measurements. Previously, we have developed a 3D-printed perfusion phantom that mimics the perfusion through human tissue with branching of arterial vessels [3]. Thus, the purpose of this study was to assess the perfusion phantom’s reproducibility and repeatability by longitudinally acquiring quantitative ASL measures using a multi-PLD 2D pCASL sequence over a period of 5 weeks.Methods
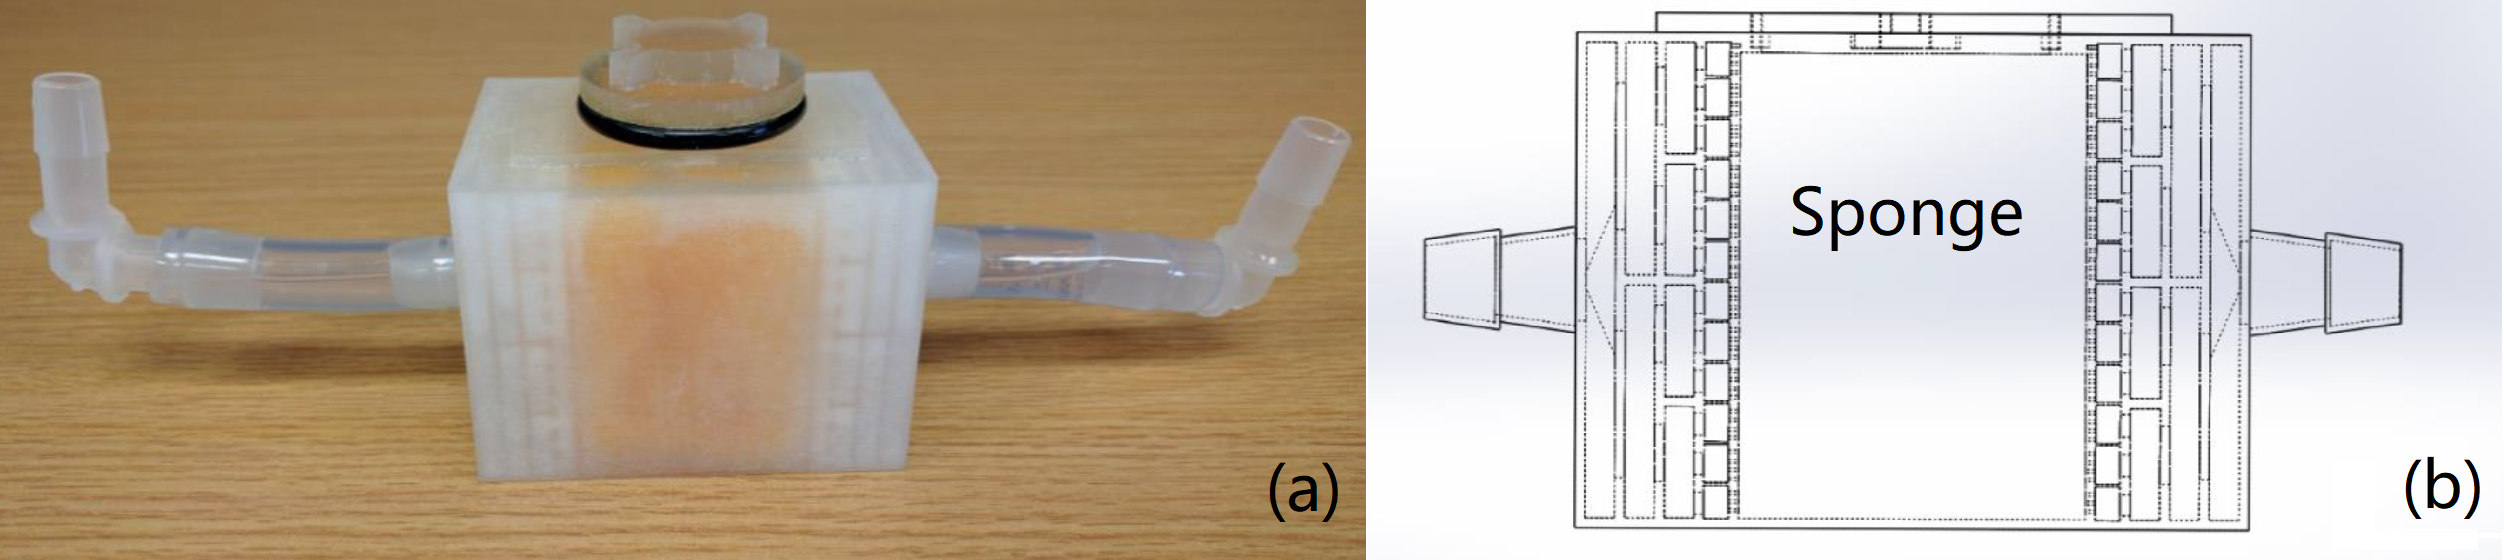
Phantom structure: The perfusion phantom is connected to tubes through two interfaces on either side of the main unit, one serves as input, and the other as output. (Fig. 1a, b) Distilled water is circulated by a peristaltic pump placed outside the scanner room, which is connected to the phantom by extended tubes. The phantom first distributes the incoming flow of water into smaller channels through its 3D-printed branches mimicking capillaries. Water then enters a small port next to a chamber that contains a sponge. (Fig. 1b) The sponge absorbed the water and mimics body tissue mass. The branches and the small port ensure that the sponge is sufficiently perfused, before water exits the phantom through the output structures that mirror the input flow setup.MR Imaging: A multiple post-label delay (PLD) 2D pCASL sequence was used for imaging, using a single shot turbo spin echo (SShTSE) acquisition. Parameters were: label duration = 1 s, 20 evenly-spaced PLDs ranging from 0.2 to 7.8 s, at 0.4 s increments. Other imaging parameters were: TR = 3/3.4/3.8/…/10.6 s, TE = 36 ms, TSE factor = 38, echo spacing = 4.9 ms, FOV = 100 x 100 mm2, acquired resolution = 1.6 x 1.6 mm2 , slice thickness = 10 mm, matrix = 64x64, scan time = 4:30 mins. M0 images were acquired for quantification with same parameters except for a single PLD = 6 s, a single TR = 8 s, and scan time = 8 s. Sequences were run at a pump flow rate of 400 mL/min for this reproducibility study, and were repeated for 3 times per session. In this ongoing study, one session is run each week and the data over a period of 5 weeks is presented in this abstract.
Data Analysis: Polygon ROI covering most of the perfusion was drawn on the perfusion difference image that has the highest perfusion among the 20 PLD images. The ROI was then copied to other PLD perfusion weighted images, followed by the calculation of their mean signal intensities within the ROI. The mean signal intensities of the perfusion difference images were normalized by the mean signal intensity of the M0 image within the same ROI. Normalized signal intensities of the 20 PLDs were then fitted into a general kinetic model for perfusion and T1 quantification, using nonlinear regression analysis with least squares method on GraphPad Prism 7.04 (GraphPad Software, San Diego, CA) [4]. Perfusion unit was converted from ms-1 to mL/100g/min according to the kinetic model, using an assumed labeling efficiency of 0.9 for pCASL [4]. Mean and standard deviation of the quantified perfusion and T1 values from each week’s 3 runs of 2D pCASL were calculated. The reliability among the 3 runs of 2D pCASL measurements were estimated using intra-class correlation coefficient (ICC), for both the quantified perfusion and T1. ICC estimates and their 95% confidence interval (CI) were calculated using SPSS statistics version 25.0 (IBM, Armonk, NY) based on a single-measurement, absolute-agreement, 2-way mixed-effects model.
Results
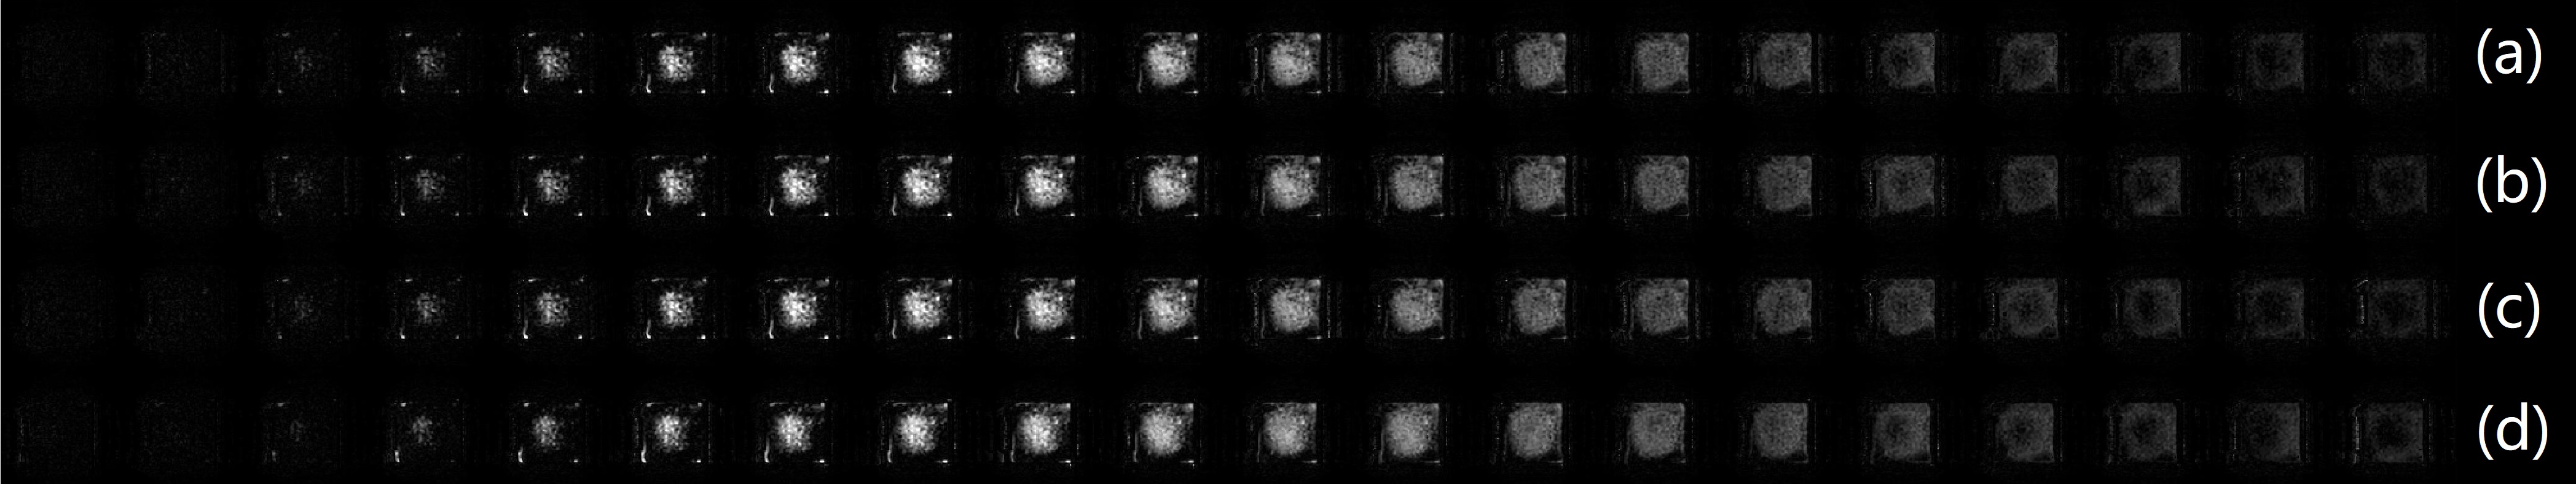
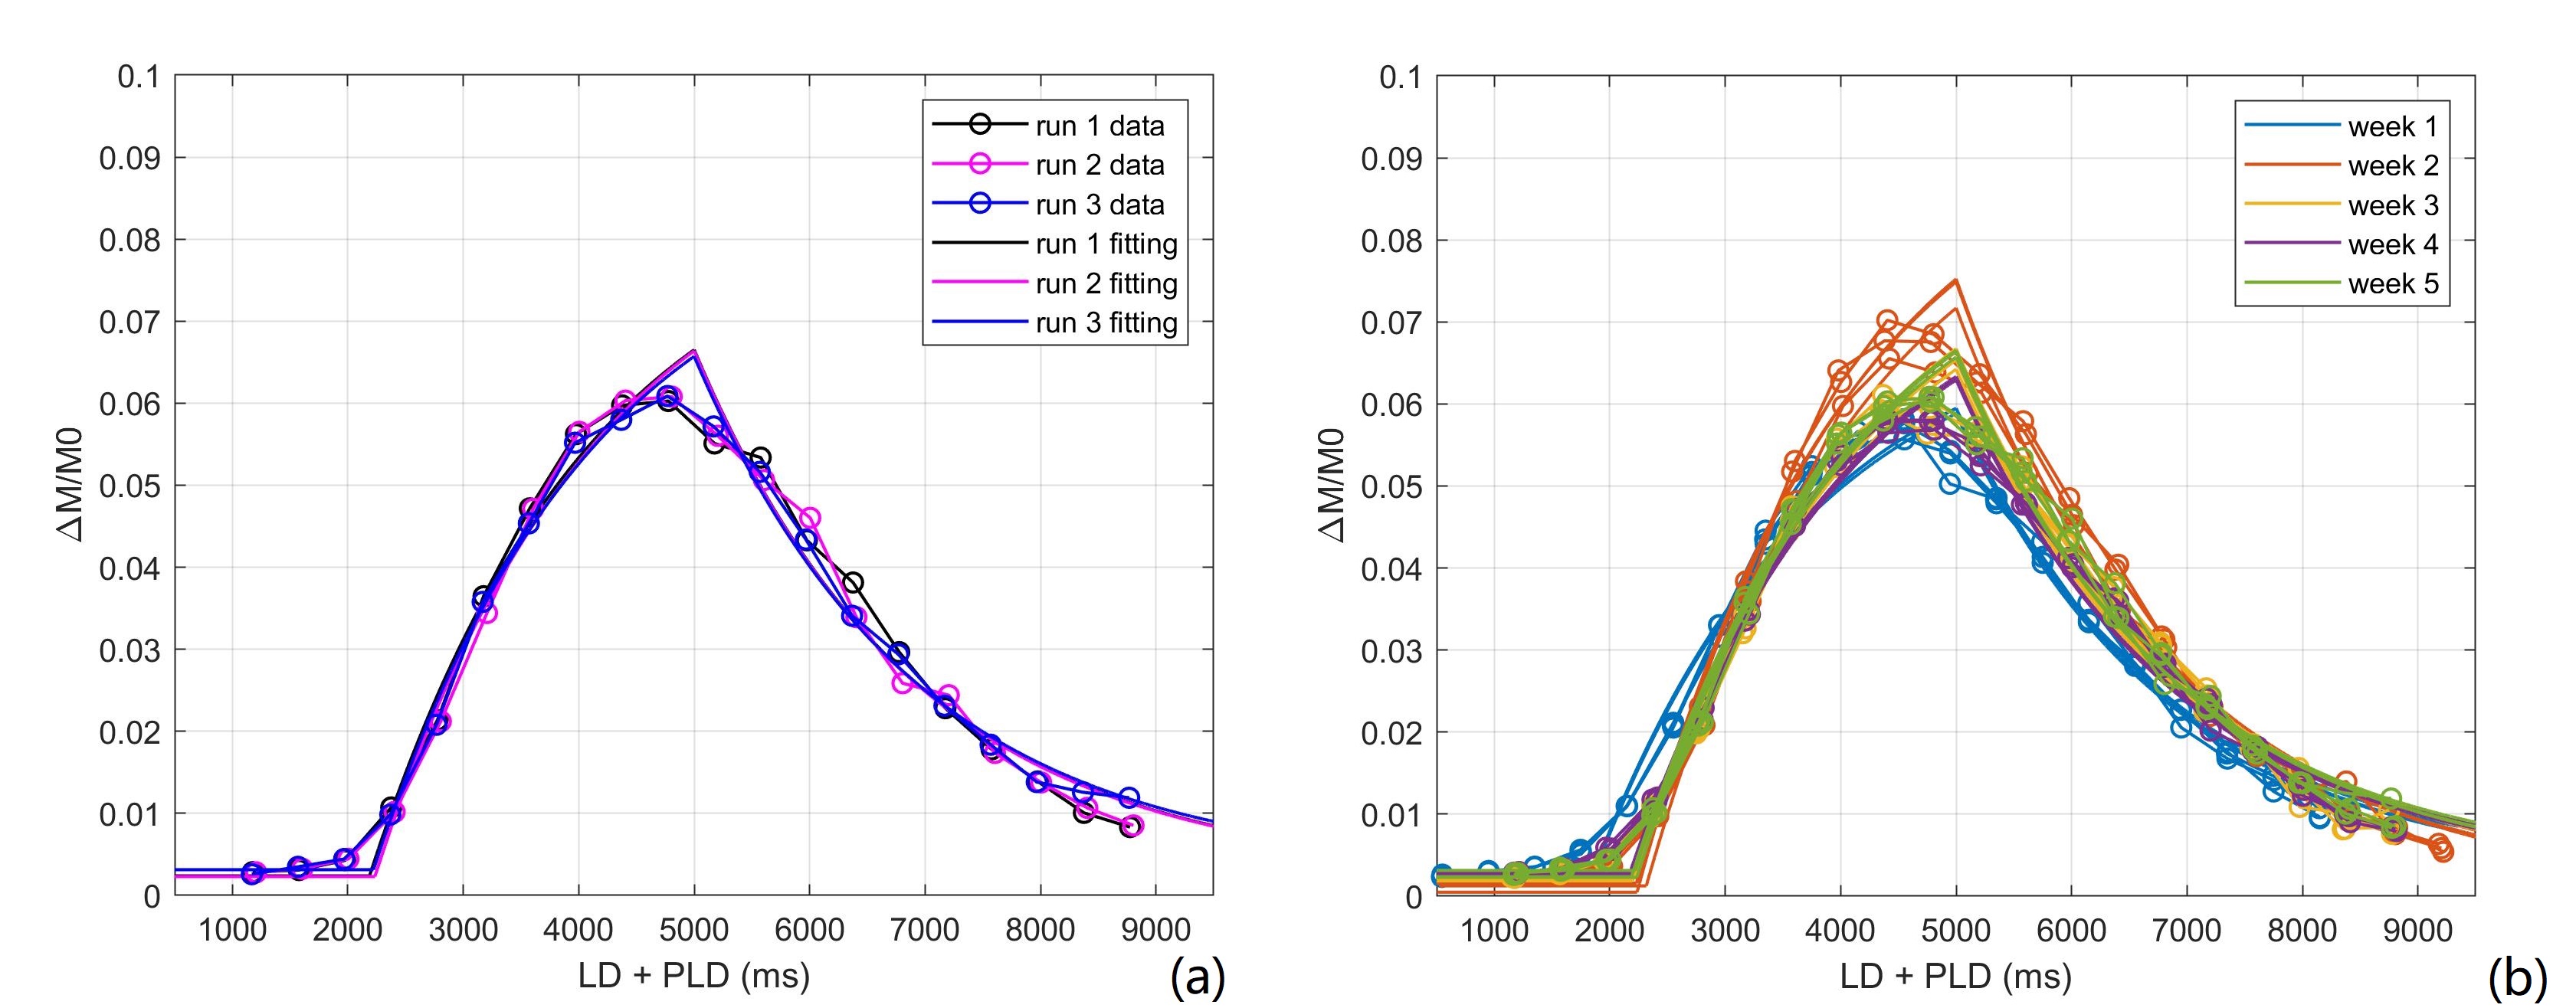
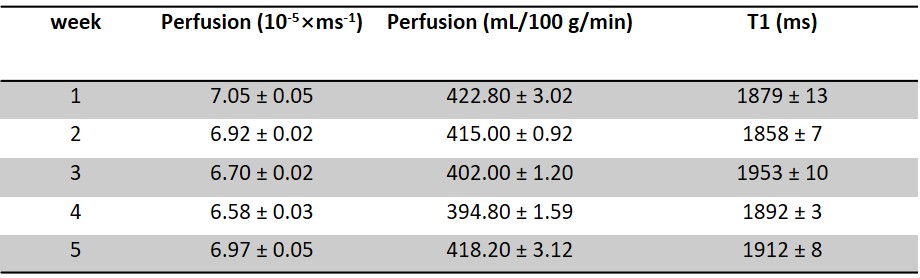
Fig. 2a-c show the perfusion weighted images across 20 PLDs from 3 runs of 2D pCASL in one session, and Fig. 2d shows images from 1 run of 2D pCASL of another session. Signal intensities (open circle) and their regression analysis results (solid line) across 20 PLDs are shown for 3 runs of 2D pCASL in 1 session (Fig. 3a), and for all 5 sessions across 5 weeks (Fig. 3b), showing overall highly reproducible signal intensities and regression analyses. Mean values of R2 across all 15 regression analyses was 0.984, with a standard deviation of 0.003, indicating good reproducibility. Mean values and standard deviations of the quantified perfusion values and T1s from the 3 runs of 2D pCASL were consistent over the 5 weeks (Table 1) with a strong ICC (Table 2).Conclusions
2D pCASL quantitative measurements with multiple PLDs in a previously-developed 3D-printed perfusion phantom showed high reproducibility and repeatability, indicating its reliable use as a quality control phantom for ASL measurements. Future works will include studying the phantom’s performance at different pump flow rates and determining an appropriate inflow range for its optimal performance.Acknowledgements
This work was partly supported by the NIH/NCI grant U01CA207091.References
[1] Alsop, DC et al. Radiology 1998; 208: 410-416
[2] Chiribiri, A et al. MRM 2013; 69(3): 698-707
[3] Greer, JS et al. ISMRM 2017: 3805
[4] Buxton, RB et al, MRM 1998; 40(3): 383-396.
Figures