2731
ASLDRO: Digital reference object software for Arterial Spin Labelling
Aaron Oliver-Taylor1, Thomas Hampshire1, Nadia A S Smith2, Michael Stritt3, Jan Petr4, Johannes Gregori3, Matthias Günther3,5, Henk J Mutsaerts6, and Xavier Golay1,7
1Gold Standard Phantoms Limited, London, United Kingdom, 2National Physical Laboratory, Teddington, United Kingdom, 3mediri GmbH, Heidelberg, Germany, 4Helmholtz-Zentrum Dresden-Rossendorf, Dresden, Germany, 5Fraunhofer MEVIS, Bremen, Germany, 6Amsterdam University Medical Center, Amsterdam, Netherlands, 7Institute of Neurology, University College London, London, United Kingdom
1Gold Standard Phantoms Limited, London, United Kingdom, 2National Physical Laboratory, Teddington, United Kingdom, 3mediri GmbH, Heidelberg, Germany, 4Helmholtz-Zentrum Dresden-Rossendorf, Dresden, Germany, 5Fraunhofer MEVIS, Bremen, Germany, 6Amsterdam University Medical Center, Amsterdam, Netherlands, 7Institute of Neurology, University College London, London, United Kingdom
Synopsis
ASLDRO is digital reference object software for Arterial Spin Labelling. Here we present the development and demonstration of the DRO software, and its use in a sensitivity and uncertainty analysis of the single-subtraction equation for ASL perfusion quantification.The DRO software was written in python, and can generate synthetic ASL control, label and M0 data in ASL BIDS format. Pulsed and continuous labelling are supported, and patient motion and instrument noise are accurately simulated. It can be used both for testing and validation of image processing software, and for investigating ASL quantification models.
Introduction
Arterial Spin Labelling is a non-invasive MRI technique for measuring perfusion, the delivery rate of arterial blood to an organ. Since the introduction of a Position Paper providing a set of clear guidelines for ASL acquisition and analysis1, product ASL packages adhering to these recommendations are offered by the major MRI manufacturers, and a standardised and simple quantification model (the ‘Whitepaper’ equation) reduces variability in results due to differing models2. Even though the essence of the ASL analysis is a simple subtraction, a more complex3,4 pipeline is needed to correct for motion, misalignment to an anatomical reference, and partial volume effects. While standardised datasets are useful for assessing variability in pipeline outputs, they lack a known ground truth. Digital Reference Objects (DRO) address this issue by generating synthetic data from a known ground truth. One ASL DRO exists5 , but with limited parameter simulations and no anatomical morphology.Here, we present ASLDRO, an open-source software package that generates DRO data that more closely represents an ASL experiment, and can thus be used to test pipelines. We demonstrate this software by performing sensitivity and uncertainty analyses of the Whitepaper model.
Methods
ASLDRO is developed in Python 3.7 and released under the MIT license6. A 5D NIfTI image supplies 1x1x1 mm ground truths for cerebral blood flow (CBF), arterial transit time, M0, T1, T2, T2* and a tissue label map. $$$\Delta M$$$ signal is generated using the General Kinetic Model7 for both pulsed and continuous labelling, and encoded into a timeseries of control, label and M0 images (Figure 1). Configuration parameters are defined in a JSON file, and data are output and validated in ASL BIDS8 format. Structural data can be synthesized by omitting the ASL signal model, and the resulting 1x1x1 mm maps can be resampled to specified spatial resolutions.We conducted sensitivity and uncertainty analyses (also Python 3.7) using the ASLDRO (v2.2.0) output on CBF values calculated using the Whitepaper equation (Figure 2.d) with quantification parameters kept as recommended1 (Figure 2.b), assessing the impact of the variability of key parameters (based on between-subject variability from previous studies) when the ground truth CBF is fixed. First, a two-level full factorial sensitivity analysis10 was conducted using all high and low combinations of the parameters defined in Figure 2.a. Parameters with significant effects were included in a 12000 sample Monte Carlo uncertainty evaluation11. Finally, the bias and linearity between input and output CBF was assessed by modulating the input CBF by a scaling factor between 0 and 2.
Results
DRO data comprising an ASL timeseries (1 M0 and 30 control-label pairs, base image SNR of 100) with and without random motion, and a 1x1x1 mm T1w structural image were successfully analysed with ExploreASL3 (Figure 3.d). Note how the image processing was unable to fully undo the detrimental effects of head motion and there is significant GM-WM signal mixing. Sensitivity analysis indicates all of the chosen input parameters are significant (larger than the standard error) and so were all included in the uncertainty evaluation. Results from the uncertainty analysis give estimates of the mean CBF with associated standard uncertainty of 43.8 ± 15.2 ml/100g/min in the grey matter, and 10.9 ± 4.1 ml/100g/min in the white matter.Discussion
As demonstrated, the DRO can generate required data for benchmarking and testing ASL image processing pipelines. While it does not yet simulate more advanced aspects of ASL sequences such as background suppression or specific readout trajectories, its modular architecture makes it extendable. Furthermore, different ground truth NIfTI files can be used to represent different patient populations or simulate abnormalities.Most parameters’ sensitivities are larger for grey matter, which has higher CBF, however the effect size for Transit Time Scale is similar, resulting in the contribution being much larger for white matter. The largest contributing parameter was the tissue T1 scaling factor.
Estimates of mean grey and white matter CBF are significantly lower than the ground truth (60 and 20 mL/min/100g, respectively) due to the first-order bias between the ground truth and calculated CBF, of which a small fraction is partial volume averaging, and the remainder due to the simplified Whitepaper quantification model. The associated standard uncertainties account for the between-subject variability that might be expected. Estimating or measuring these parameters on a per-subject basis with sufficient precision could lower this uncertainty and improve the bias.
We have assumed that all chosen input parameters are independent. However, there is evidence to suggest a correlation between the T1 of tissue and M013, which would lead to a reduction in the overall uncertainty. Visually, the sampled parameters match their defined distributions, apart from labelling efficiency which had values clipped at 1.0, potentially skewing its effect on the output distribution.
Conclusion
In this work we have presented DRO software for arterial spin labelling, and its use in sensitivity and uncertainty analyses on a model where ASL control, label and M0 data is generated with the DRO, and then quantified using the single-subtraction ‘Whitepaper’ equation. Further work would be to extend this analysis to the more complex aspects of ASL analysis pipelines.Acknowledgements
This work is part of Eurostars-Project ASPIRE 01QE2026A is funded by the Eurostars program via the Federal Ministry of Education and Research, Innovate UK, and the Netherlands Enterprise Agency (RvO). HM is supported by the Dutch Heart Foundation (2020T049).References
- Alsop et al., Recommended implementation of arterial spin-labeled perfusion MRI for clinical applications: A consensus of the ISMRM perfusion study group and the European consortium for ASL in dementia. Magnetic Resonance in Medicine. 2015; 73(1):102-16
- Steger et al., Input parameter sensitivity analysis and comparison of quantification models for continuous arterial spin labeling. Magnetic Resonance in Medicine. 2015; 53(4):895–903.
- Mutsaerts et al., ExploreASL: An image processing pipeline for multi-center ASL perfusion MRI studies. NeuroImage. 2020; 219:117031.
- Chappell et al., Variational Bayesian Inference for a Nonlinear Forward Model. IEEE Transactions on Signal Processing. 2009; 57(1): 223–236.
- Antolak and Jackson, Phys. Med. Biol. 2019; 64: 02NT01
- https://github.com/gold-standard-phantoms/asldro
- Buxton et al., A general kinetic model for quantitative perfusion imaging with arterial spin labeling. Magnetic Resonance in Medicine. 1998; 40(3):383–396.
- Clement et al., ESMRMB 2019, 36th Annual Scientific Meeting, Rotterdam, NL, October 3–October 5: Abstracts, Friday. Magnetic Resonance Materials in Physics, Biology and Medicine 2019;32:107–233
- Gudbjartsson and Patz, The rician distribution of noisy mri data. Magnetic Resonance in Medicine. 1995; 34: 910-914.
- FORCE (DK), LNE (Fr), NPL (UK) and PTB (DE) , “Best practice guide to uncertainty evaluation for computationally expensive models,” EURAMET, 2015.
- Cox and Siebert, The use of a Monte Carlo method for evaluating uncertainty and expanded uncertainty. Metrologia 2006;43:S178–S188
- Fonov et al, Unbiased average age-appropriate atlases for pediatric studies. NeuroImage 2011;54:313–327
- Petersen, Brain Perfusion Imaging: Quantification of Cerebral Blood Flow Using ASL Techniques. Aarhus University; 2009.
- Petersen et al, The QUASAR reproducibility study, Part II: Results from a multi-center Arterial Spin Labeling test–retest study. NeuroImage 2010;49:104–113
- Lu et al., Routine clinical brain MRI sequences for use at 3.0 Tesla. Journal of Magnetic Resonance Imaging. 2005;22:13–22
- Wong et al., A theoretical and experimental comparison of continuous and pulsed arterial spin labeling techniques for quantitative perfusion imaging. Magnetic Resonance in Medicine. 1998; 40:348–355
- Zhang et al., In vivo blood T1 measurements at 1.5 T, 3 T, and 7 T. Magnetic Resonance in Medicine. 2012;70:1082–1086
- Herscovitch and Raichle, What is the Correct Value for the Brain-Blood Partition Coefficient for Water? Journal of Cerebral Blood Flow & Metabolism. 1985;5:65–69
Figures

DRO Pipeline: For label images, the $$$\Delta M$$$ signal generated using the GKM is encoded into the longitudinal magnetisation before either the gradient echo or spin echo signal is calculated (control and M0 no magnetisation is encoded). Rigid rotations and translations simulate patient motion, and an image is formed at the acquisition resolution. Instrument noise is modelled by adding gaussian noise to the real and imaginary channels in k-space, resulting in a Rician noise distribution9 in magnitude images.

Tables of a. DRO parameters and their sensitivity/uncertainty analysis values/distributions, b. DRO parameters that are fixed when the model is run, c. Table of quantification parameters that are used in the Whitepaper equation. d. Complete model pipeline: input parameter distributions, random sampling of parameters from these distributions, running the DRO with these parameters, quantification of the control, label and M0 volumes, and then calculation of the mean grey and white matter CBF.
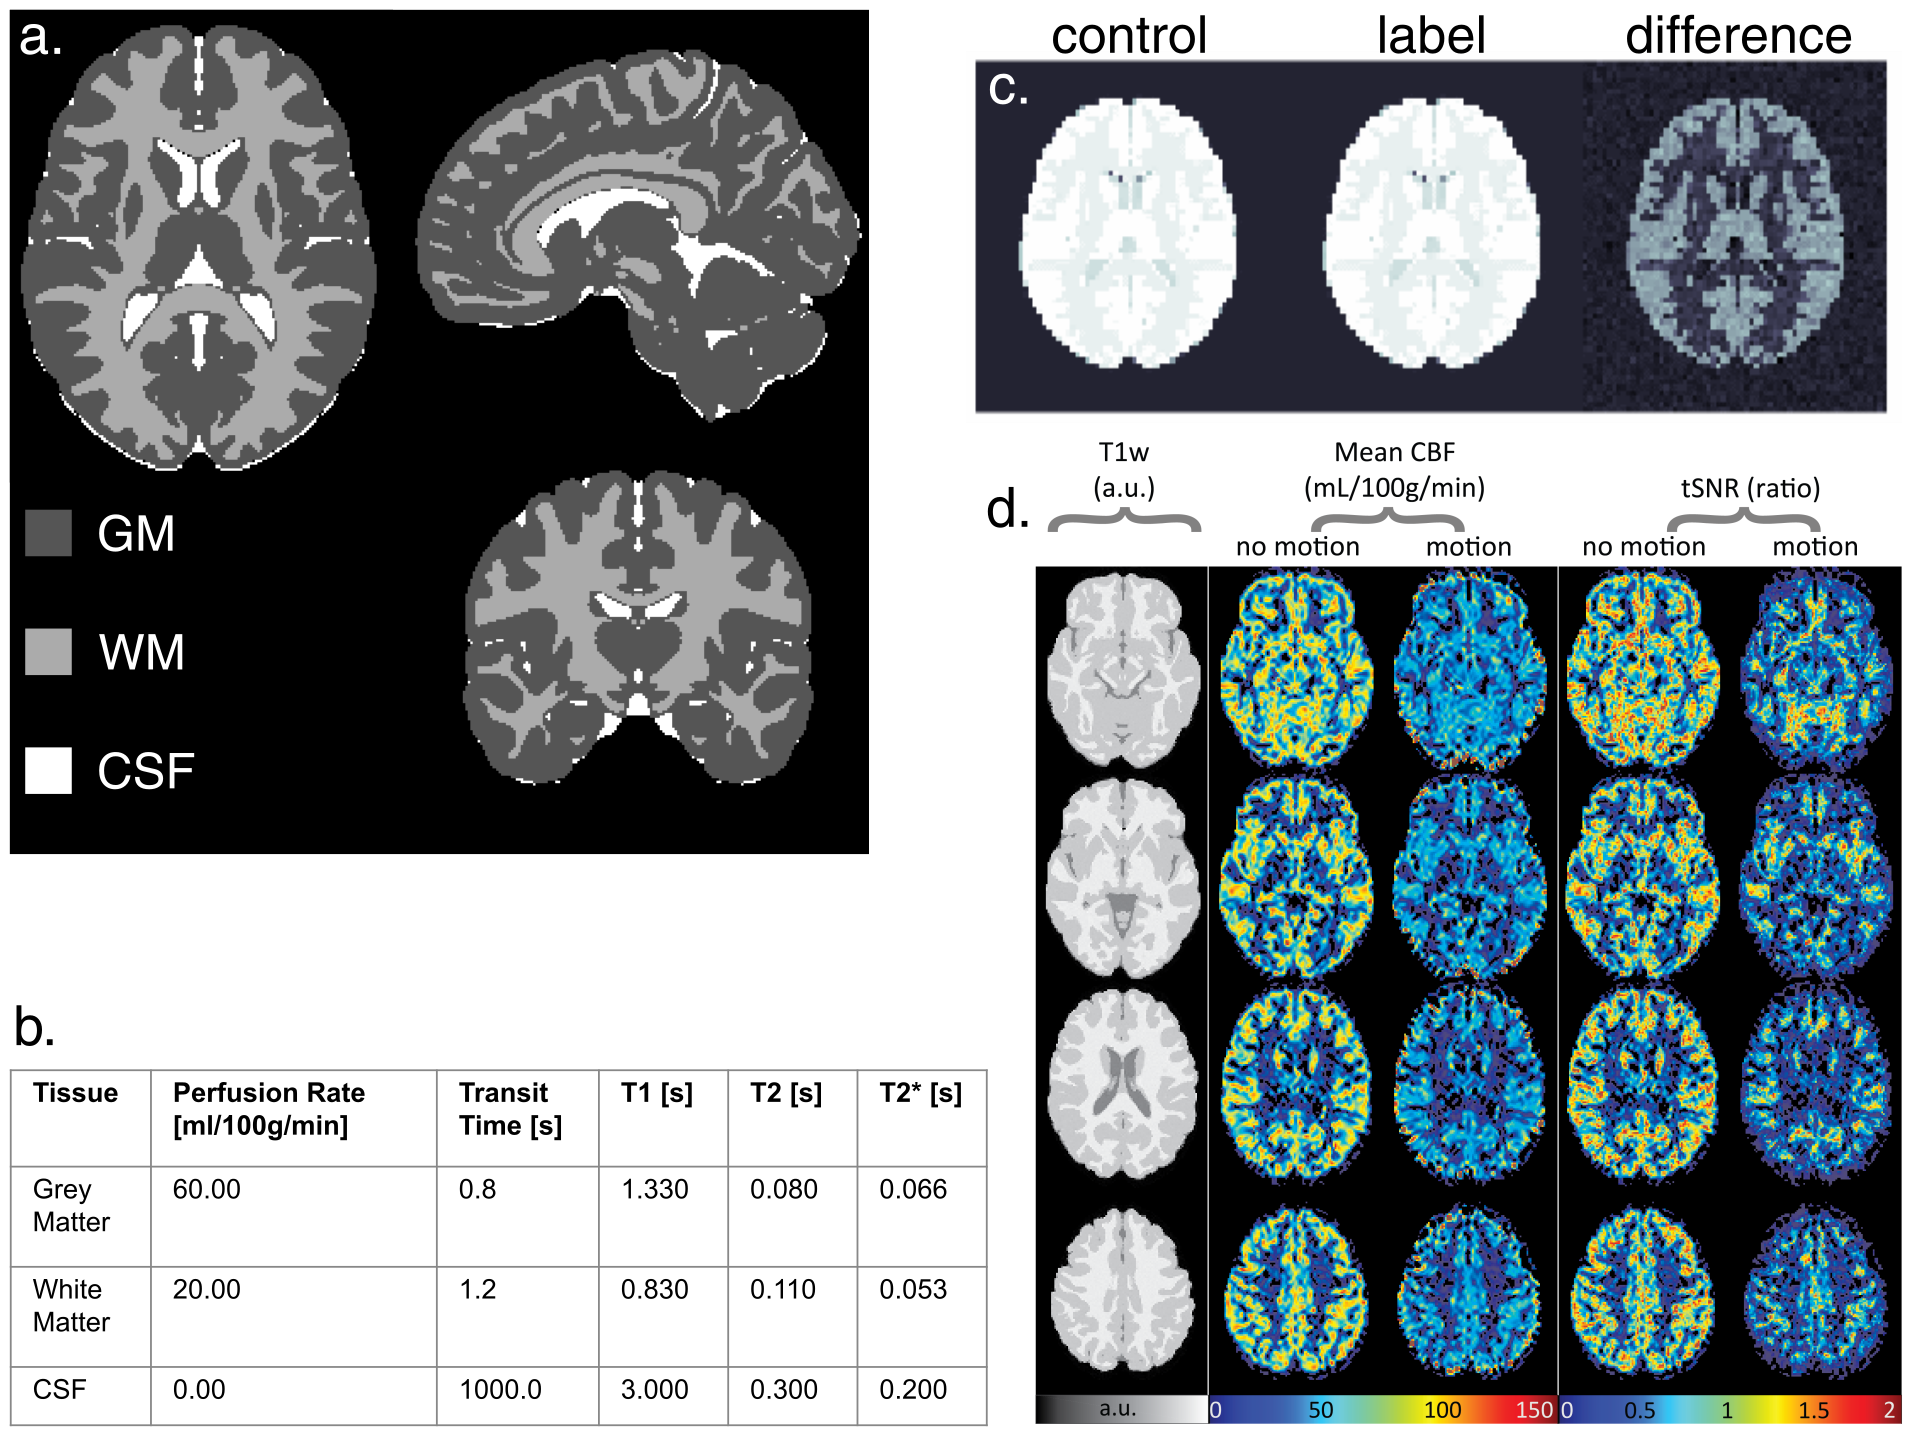
a. Tissue segmentation volume from the input ground truth obtained from the ICBM 2009a Nonlinear Symmetric atlas12. Values in the table in b. are assigned to each of the regions for each quantity volume, relaxation times are for 3 Tesla. c. Example DRO output control, label and corresponding difference images. d. Four transversal MRI slices output from ExploreASL for two DROs with same perfusion but with and without motion. tSNR = temporal signal-to-noise ratio.
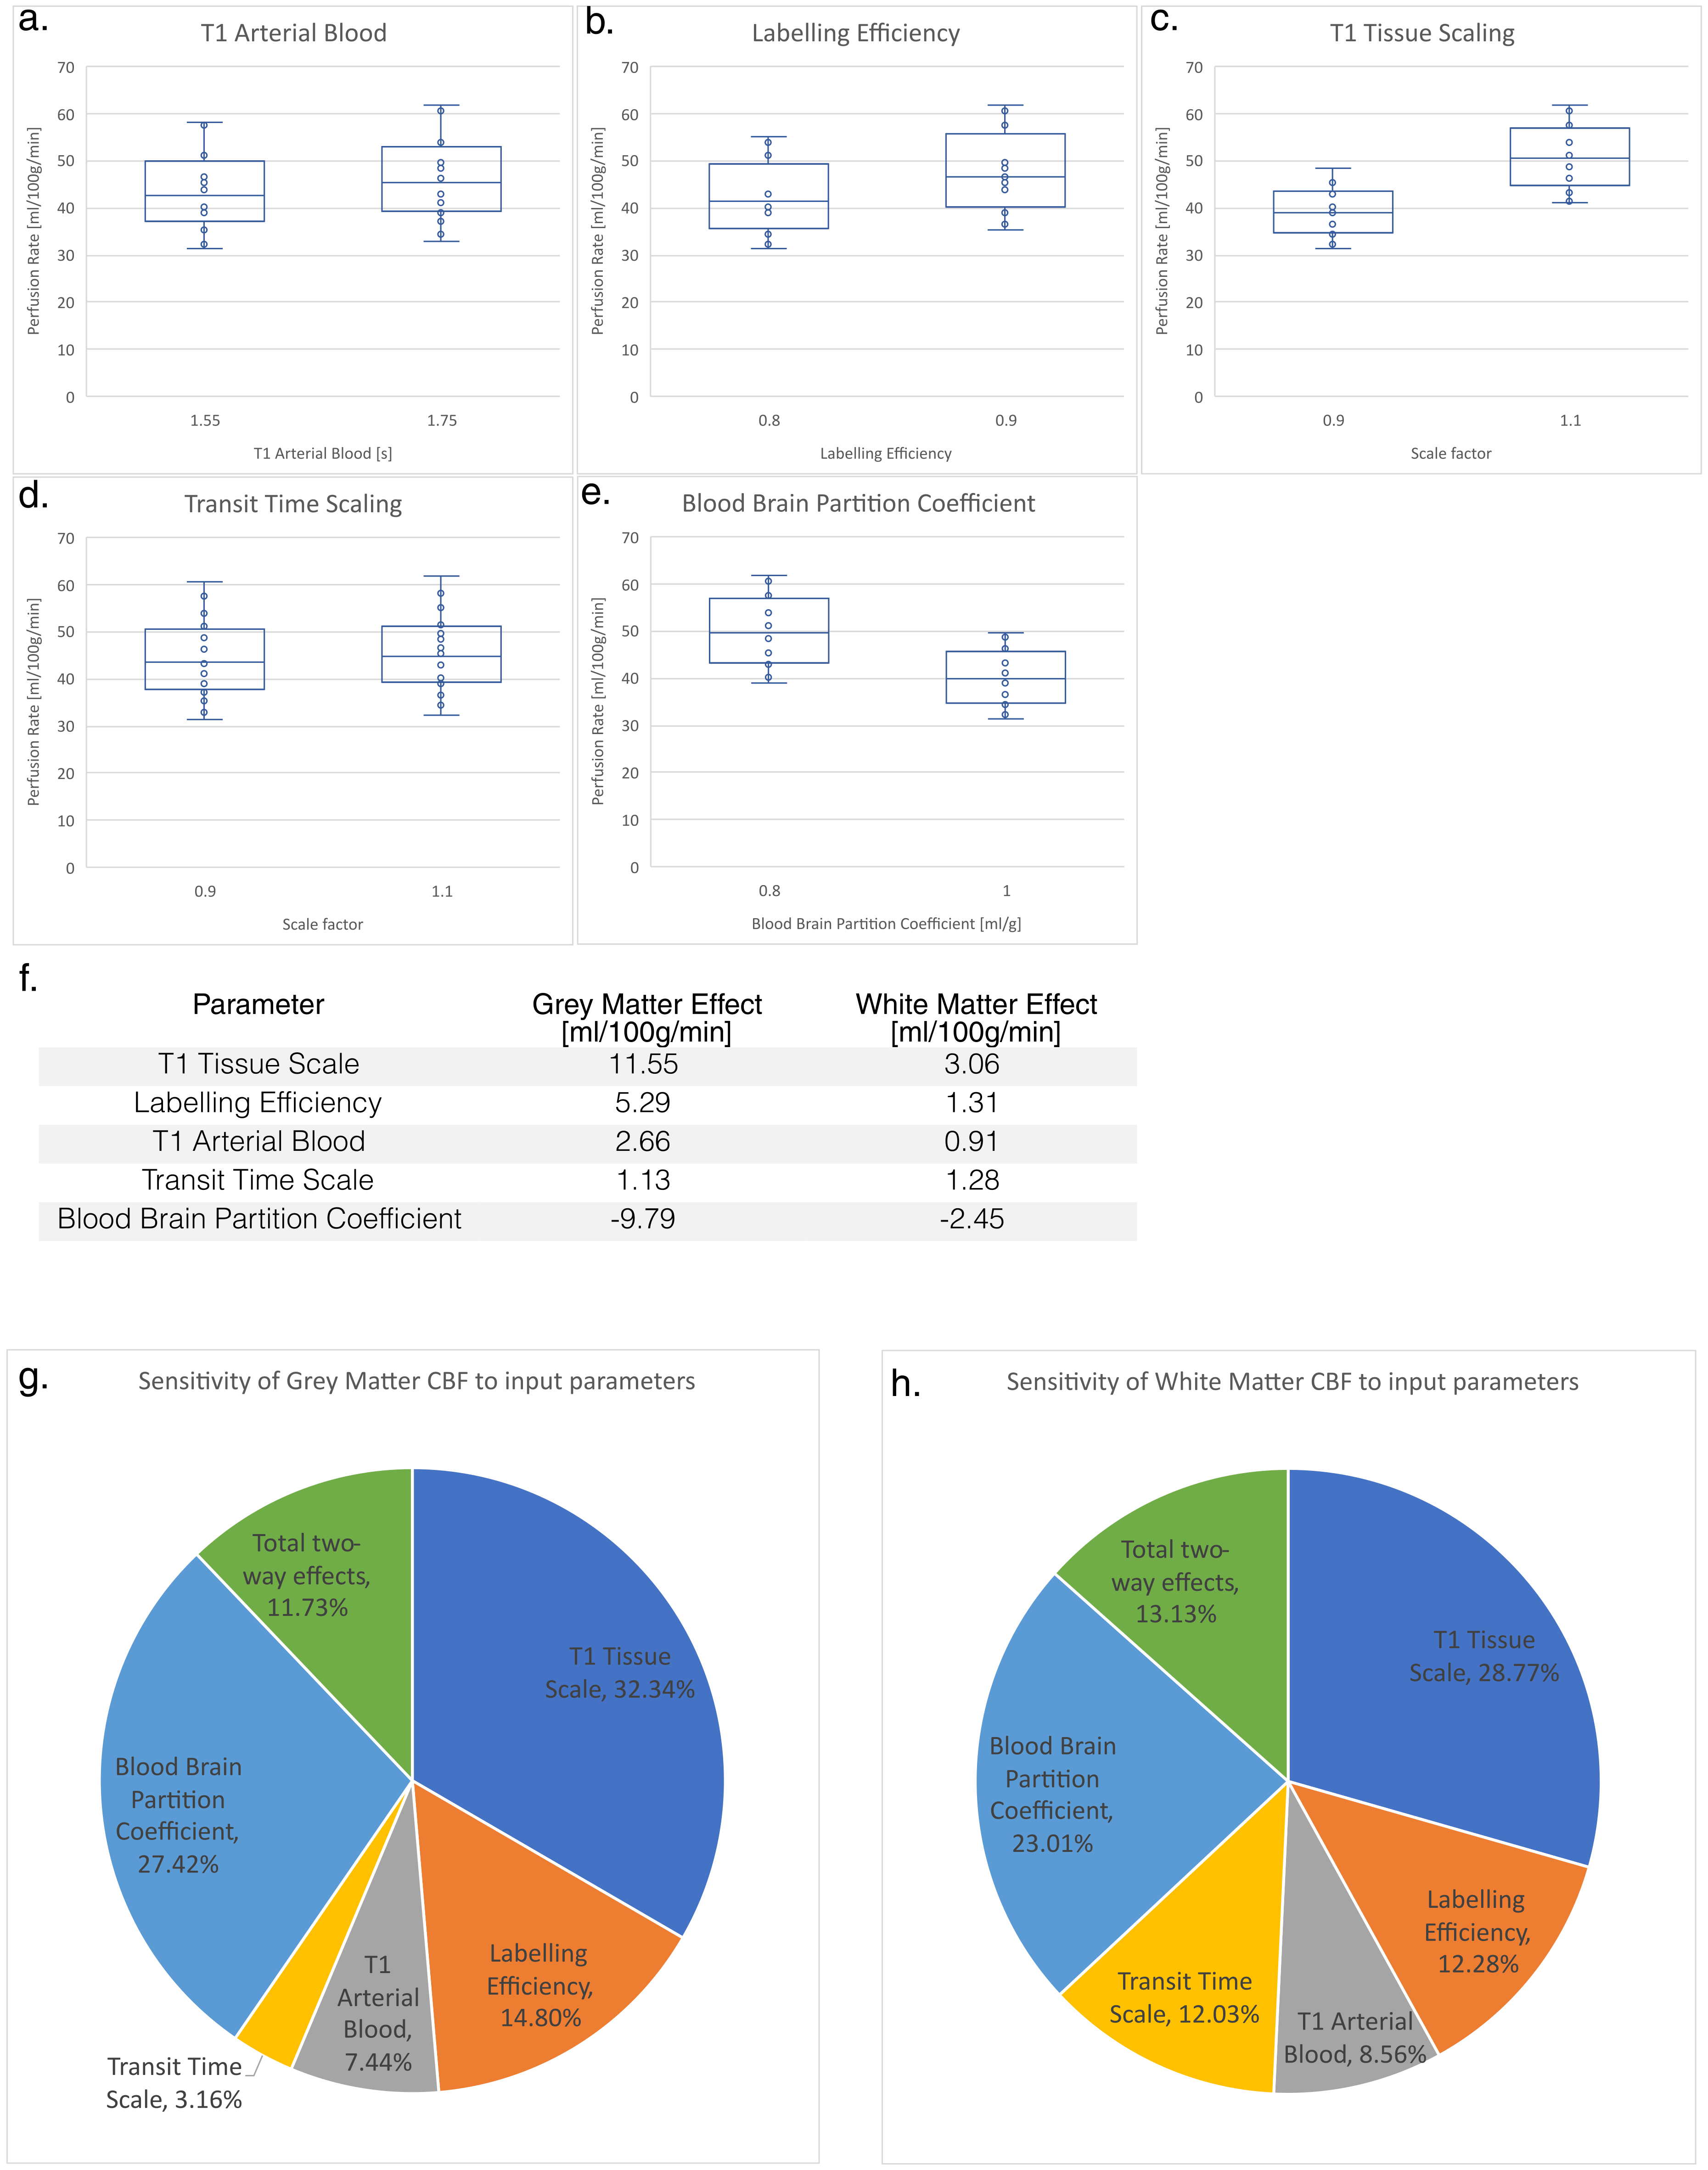
Box-whisker plots of the grey matter CBF for each high/low value of each of the input parameters (a-e), f. table with the effect size for the mean grey and mean white matter CBF, and pie charts showing the contributions of each of the primary effects, plus the combined two-way interactions for grey matter (g) and white matter (h).

Histograms (200 bins) of the randomly sampled input parameters (a-e). Labelling efficiency values were limited to a maximum of 1, resulting in an excess of samples with value 1.0. Histograms (200 bins) and fitted gaussians of the output mean CBF for grey matter (f) and white matter (g). Input-output graph showing the values of the mean CBF in each ROI for both the resampled ground truth, and the results form the Whitepaper equation calculation (h), error bars show one standard deviation.