2698
Recurrent U-Net Based Temporal Regularization for Dynamic Undersampled Reconstruction in OSSI fMRI1Electrical Engineering and Computer Science, University of Michigan, Ann Arbor, MI, United States, 2Biomedical Engineering, University of Michigan, Ann Arbor, MI, United States
Synopsis
Using deep learning for undersampled reconstruction has shown advantages for structural MRI and dynamic MRI, but is not commonly used for fMRI. In this work, we propose a neural network based reconstruction with temporal regularization to exploit the temporal redundancy of oscillating steady-state fMRI images. With a factor of 6 undersampling, the proposed method outperforms other approaches such as cascade of convolutional neural networks with high-resolution and high-quality fMRI results.
Introduction
Combining deep learning approaches with compressed sensing for undersampled MRI image reconstruction has the advantage of fast reconstruction and improved accuracy, and has become popular in recent years 1,2. However, there is limited work on deep learning based reconstruction for fMRI time series that exploits the temporal similarities/redundancy of fMRI images. In this work, we focus on a new fMRI acquisition method named “Oscillating Steady-State Imaging (OSSI)” 3. It can provide higher SNR than standard GRE fMRI and has two time dimensions with different dynamic patterns.We propose a neural network based reconstruction with two levels of temporal regularization for the two time dimensions of OSSI fMRI. We show that directly applying deep cascades of convolutional neural networks (CNNs) 1 to OSSI fMRI time series would substantially blur the functional signals, while the proposed approach almost fully recovers the high-resolution structures and functional activation of the images with a factor of 6 acceleration.Methods
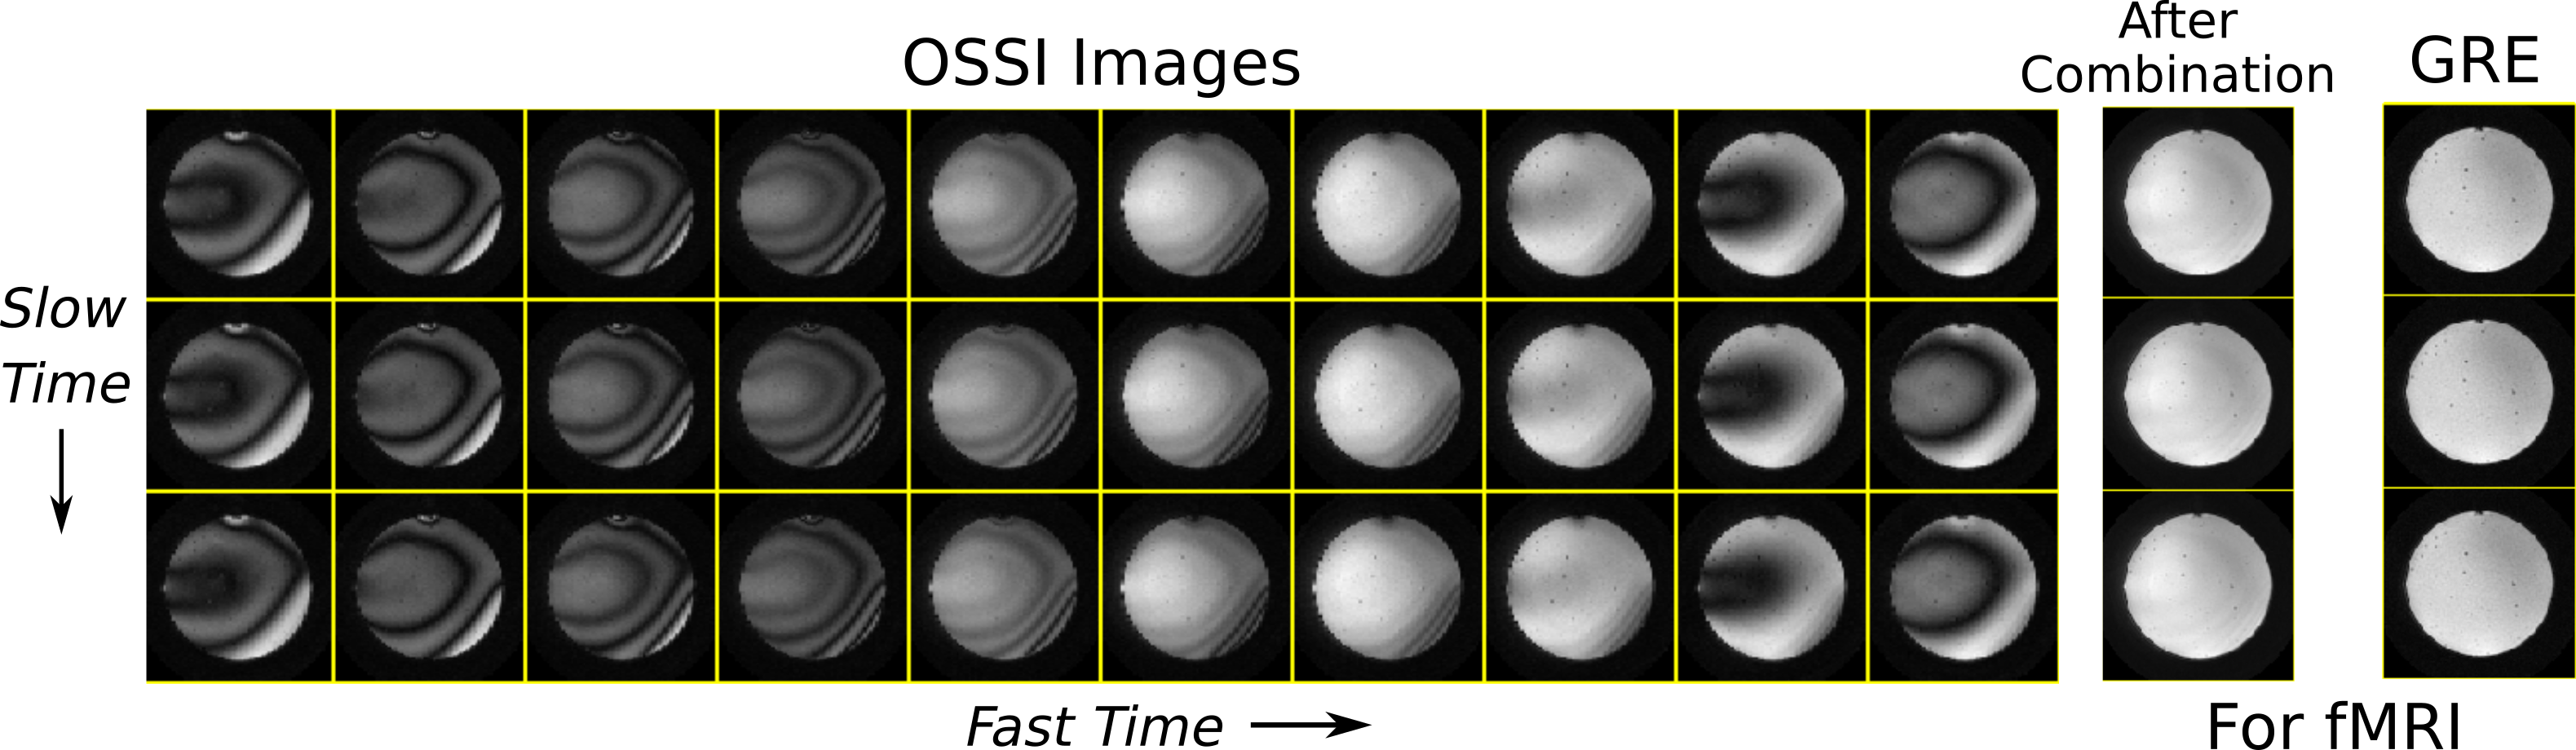
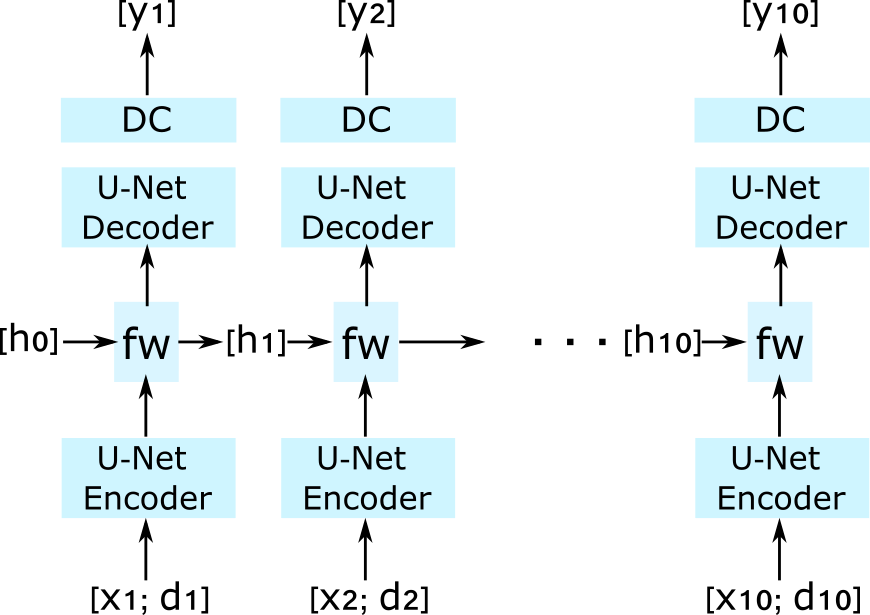
OSSI acquisition uses balanced gradients with quadratic RF phase cycling with cycle length $$$n_c$$$, accordingly, OSSI signal oscillates with a periodicity of $$$n_c$$$TR. In OSSI fMRI, every image in a regular fMRI time course is acquired $$$n_c$$$ times with different oscillation patterns, and this fast repetition dimension with length $$$n_c$$$ is called “fast time”. The time dimension comparable to standard fMRI after combining every $$$n_c$$$ images is called “slow time” as presented in Fig. 1.The first level of temporal regularization is incorporated in the neural network architecture. We use cascades of 3 U-Nets 4 with data consistency as the backbone of the network. Inspired by Yan LeCun 5, we impose temporal similarities of the fast time images using the convolutional recurrent layer at the bottleneck of every U-Net unit. The hidden state for encoded representations of one fast time image is passed along to the next fast time frame as illustrated in Fig. 2. The second level of temporal regularization is performed by modifying the inputs of the network. Because the neural network optimization is non-convex, instead of using zero-filled images as input, we concatenate two channels (real and imaginary) of zero-filled images with two channels (real and imaginary) of data shared images as the 4-channel input. The data shared images were reconstructed by combining retrospectively undersampled k-space data of every 10 slow time points.
We preprocessed the fMRI data by normalizing them using the maximum absolute value of data shared images. The single-coil k-space data were simulated and undersampled using Cartesian sampling by a factor of 6 as in 1 from fully sampled OSSI fMRI data. The training data contains 220 sets of $$$n_c$$$ = 10 2D fast time images from different subjects/slices (data augmented by circularly shifting 22 image sets along fast time). The testing data has 1480 fast time images for a 200 s OSSI fMRI scan. The loss function is L1 norm of the difference between fully sampled images and the outputs of the network. The functional task was a left/right reversing-checkerboard visual stimulus for 5 cycles (20 s L/20 s R). The network was trained end-to-end for 80 epochs.
Results
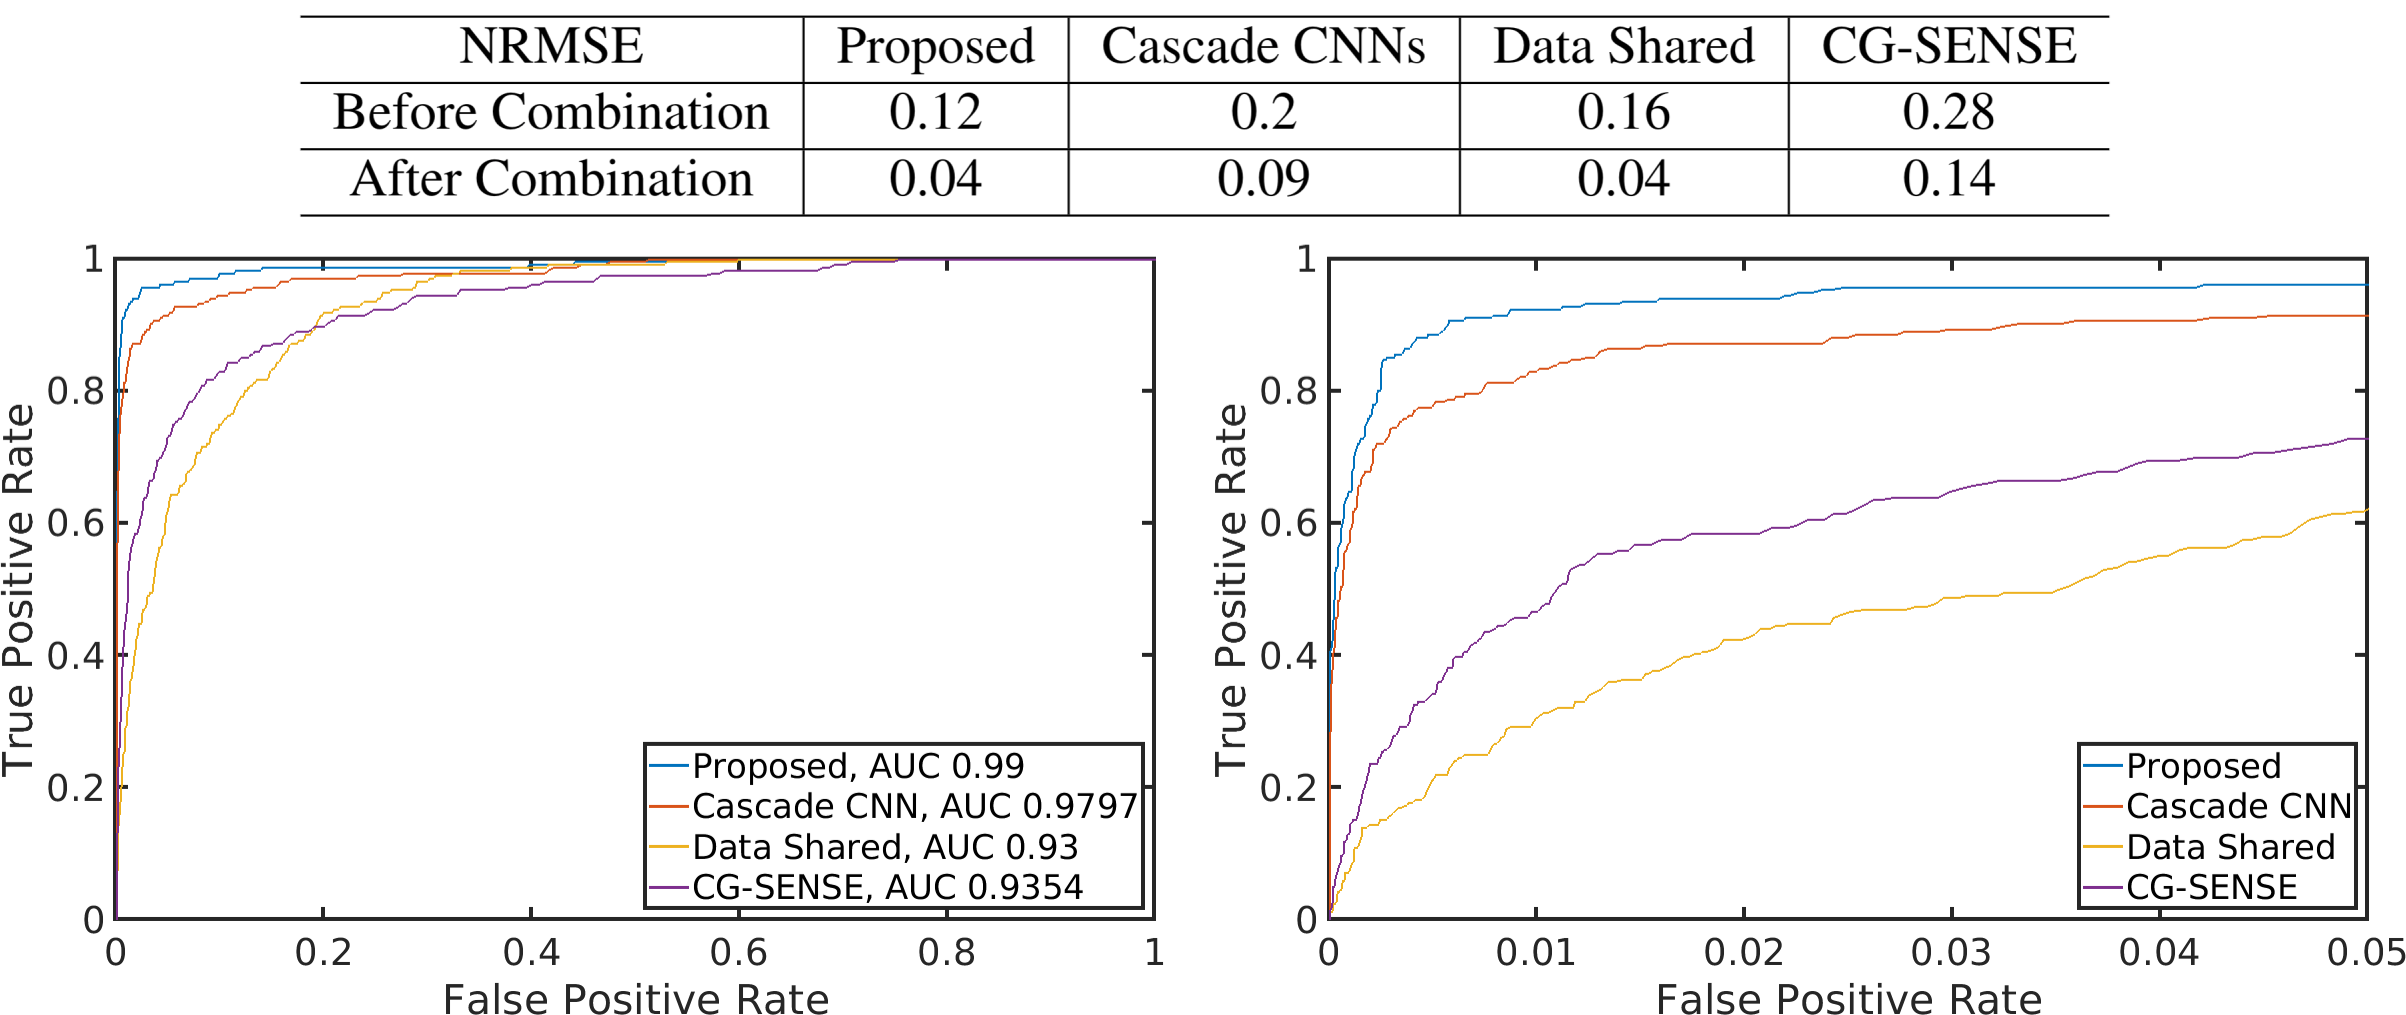
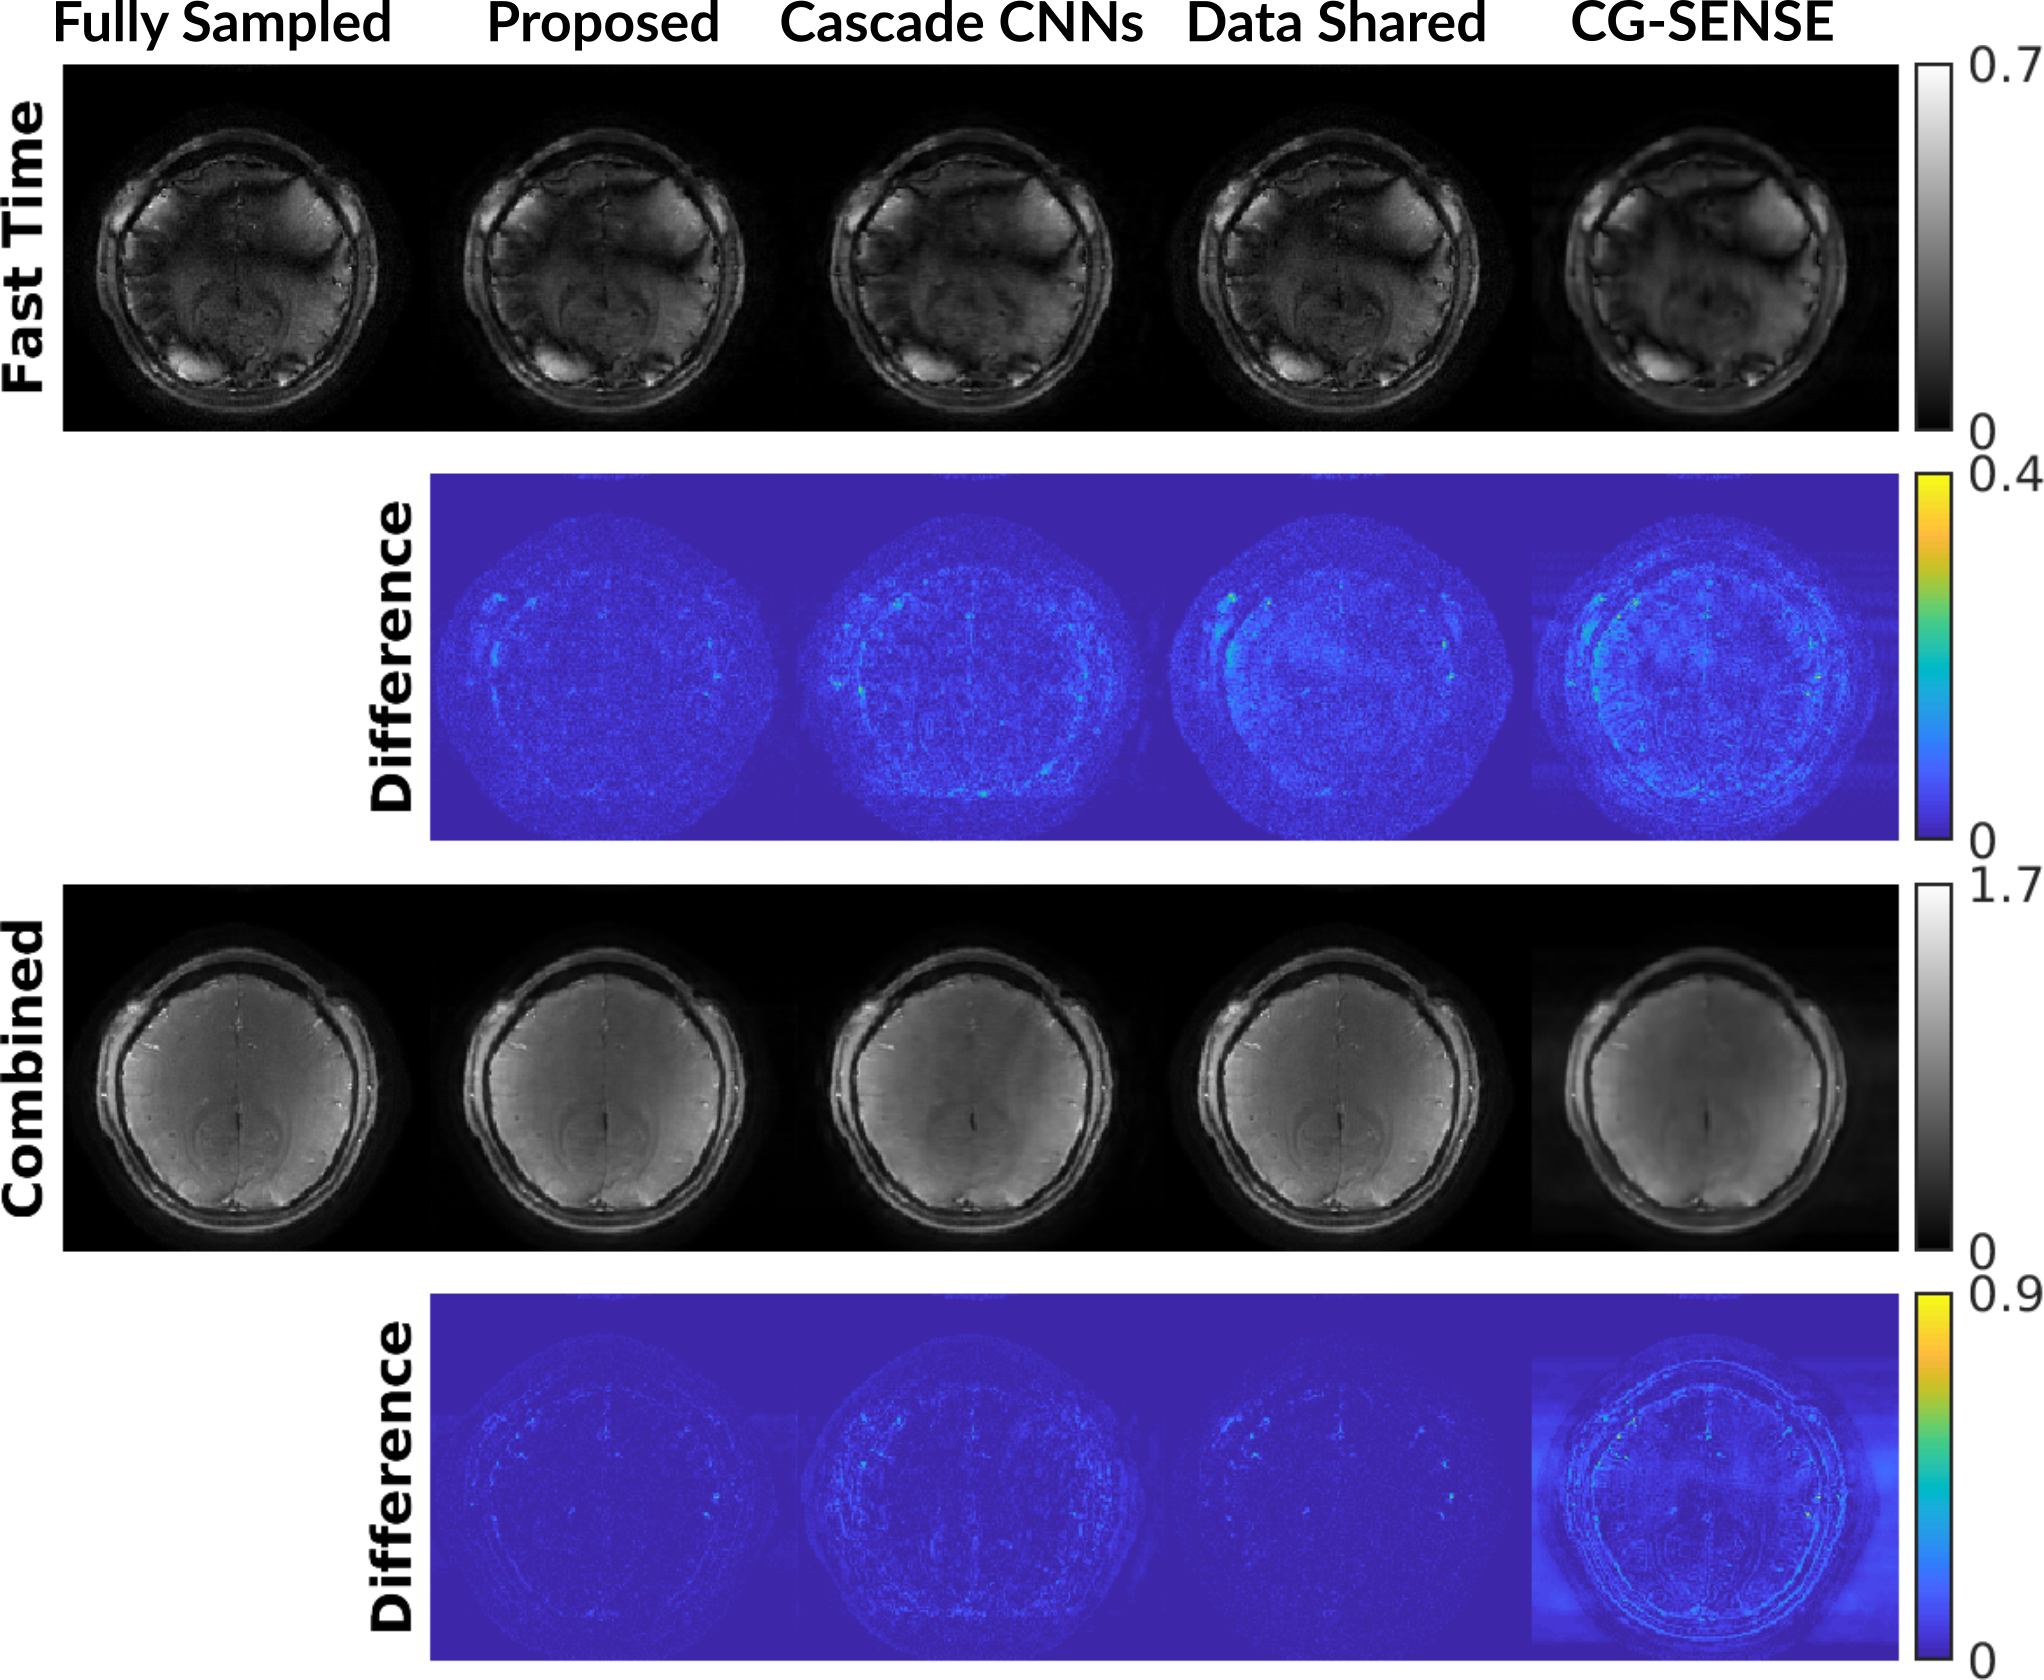
We compare the proposed undersampled reconstruction to fully sampled reconstruction, deep cascade of CNNs reconstruction 1, fMRI time-series containing only data shared images, and CG-SENSE reconstruction initialized with data-shared images. As shown in Fig. 3 and Fig. 4, the proposed method outperforms other approaches with less residual in the difference maps for both fast and slow images, and provides higher quality functional results including more accurate activation and temporal SNR maps, and cleaner time course. Quantitative evaluations including NRMSE values and ROC curves for the time-series reconstructions are in FIg. 5. The proposed method provides the largest area under the ROC curve.Conclusion
We proposed neural network based temporal regularization for OSSI fMRI reconstruction. With recurrent U-Nets for fast time regularization and slow time data shared images as part of the input, our method presents high-quality fMRI results with aggressive undersampling (R = 6). Future work will be focused on improving the network capacity for fast time regularization and multi-coil prospectively undersampled reconstruction.Acknowledgements
We wish to acknowledge the support of NIH Grants R01EB023618 and U01EB026977.References
[1] Schlemper, J., Caballero, J., Hajnal, J. V., Price, A. N., & Rueckert, D. (2018). A deep cascade of convolutional neural networks for dynamic MR image reconstruction. IEEE transactions on Medical Imaging, 37(2), 491-503.
[2] Qin, C., Schlemper, J., Caballero, J., Price, A. N., Hajnal, J. V., & Rueckert, D. (2019). Convolutional recurrent neural networks for dynamic MR image reconstruction. IEEE transactions on medical imaging, 38(1), 280-290.
[3] Guo, S., & Noll, D. C. (2020). Oscillating steady‐state imaging (OSSI): A novel method for functional MRI. Magnetic Resonance in Medicine, 84(2), 698-712.
[4] Ronneberger, O., Fischer, P., & Brox, T. (2015, October). U-net: Convolutional networks for biomedical image segmentation. In International Conference on Medical image computing and computer-assisted intervention (pp. 234-241). Springer, Cham.
[5] LeCun, Y. (2020). The Deep Learning - Applied Math Connection. SIAM Conference on Mathematics of Data Science, Cincinnati.
Figures
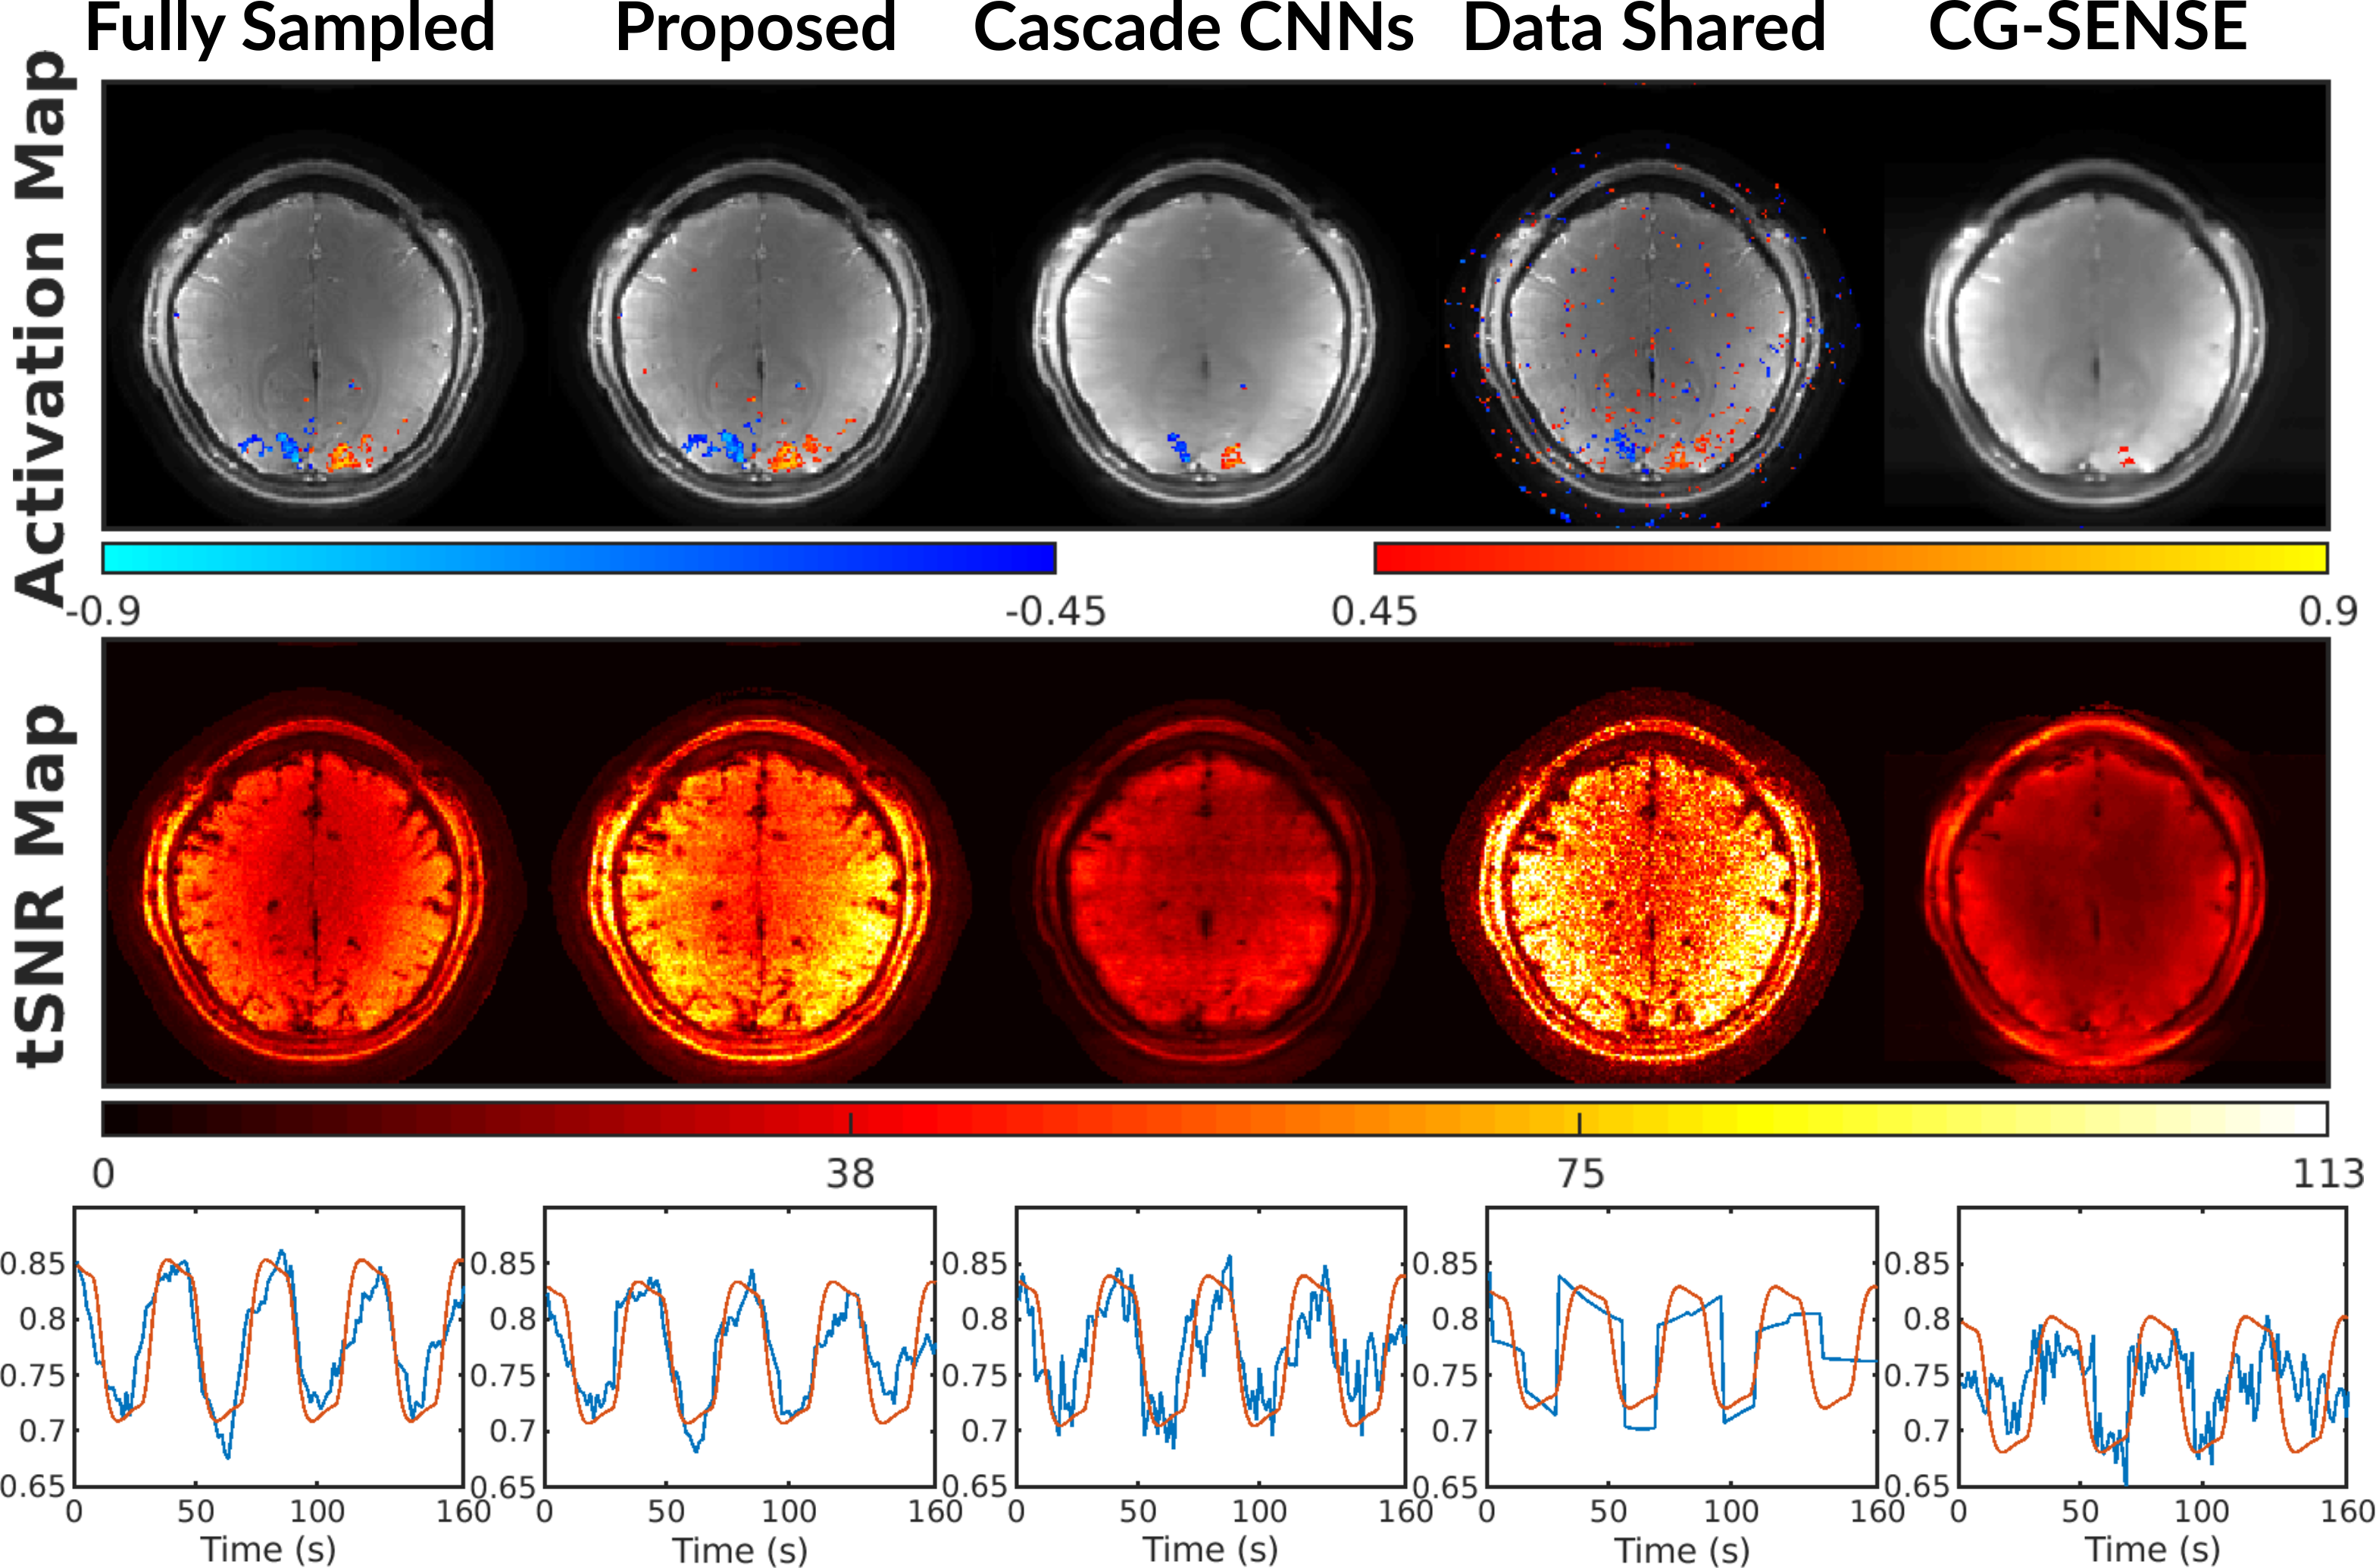
Functional results including activation maps, temporal SNR maps, and time courses. The proposed approach has well preserved functional signals with similar activation map and time course to the fully sampled case.
Because the data shared images were reconstructed by combining k-space of every 10 slow time points, the time-series of data shared images were generated by repeating each data shared image for 10 times along slow time.