2646
Exercise Effect in Human Brain Evaluated by 3D SWI Depiction of Lenticulostriate Artery with Denoising Deep Learning Reconstruction and 3D pCASL.1Radiology, UC San Diego, San Diego, CA, United States, 2Canon Medical, Tochigi, Japan
Synopsis
This study demonstrated that a mild exercise increases length and depiction of discernible lenticulostriate artery branches in 3D susceptibility weighted imaging, facilitated by applying denoising deep learning reconstruction (dDLR), and post-processed using vascular structure extraction algorithm (VSEA). Additionally, exercise increased intracranial perfusion, determined using 3D pCASL.
Introduction
Exercise has been thought to have positive effects on brain health. Exercise effect of cerebral blood flow using 3D pseudo-Continuous Arterial Spin Labeling (pCASL) has been reported among young subjects with a single bout of exercise [1]. However, there are no reports of exercise affecting intracranial vessel depiction. The aim of our study is to observe microvascular change using 3D susceptibility weighted imaging (SWI) with flow-sensitive black blood (FSBB) [2] and compare it with pCASL perfusion.Methods
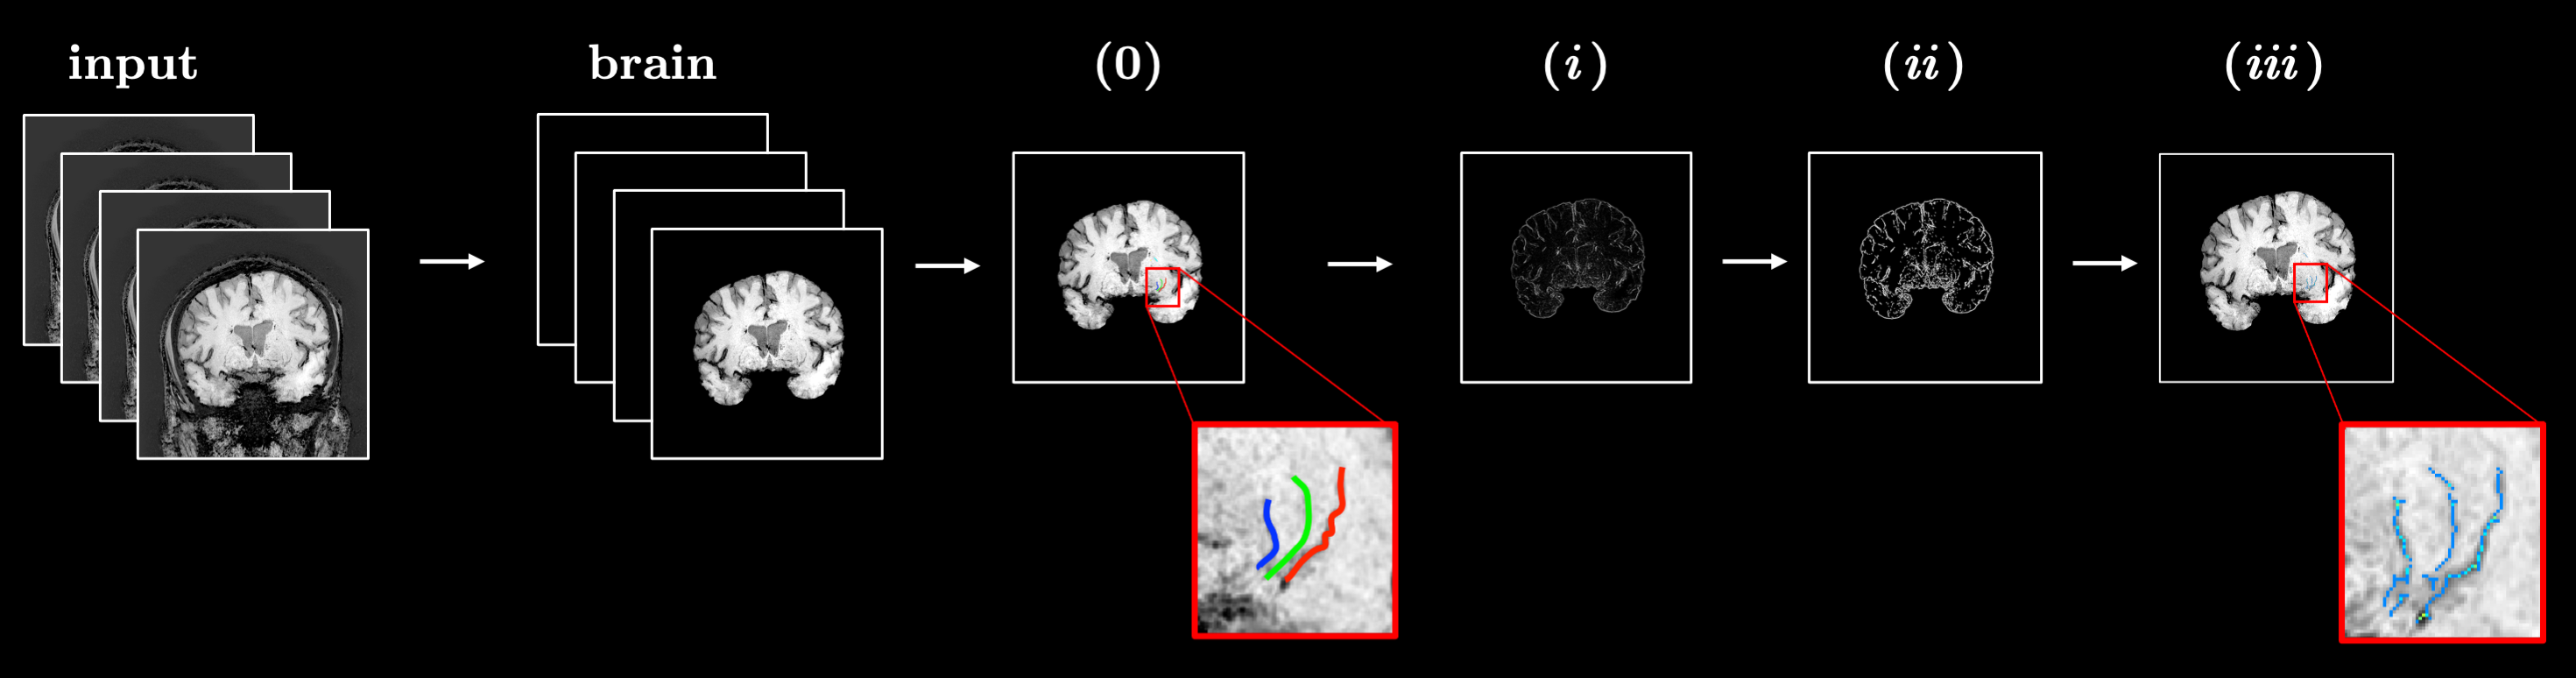
Five healthy volunteers (46 ± 16 y.o.) were recruited after obtaining IRB approval and scanned on a clinical 3T (Vantage Galan, version 6, Canon Medical, Japan) scanner with a 32-channel brain coil. The data acquisition protocol included 3D Susceptibility Weighted Imaging (SWI) [3] and 3D pseudo-Continuous Arterial Spin Labeling (pCASL) imaging sequence. 3D SWI used the following parameters: TE/TR = 14.5/35 ms, NEX = 1, FA = 20°, for the coronal orientation FOV = 20×22 cm, parallel imaging factor = 2.4, matrix size 320×462, motion sensitive gradients b = 0.53 s/mm2 and scan time of 5 min 19 s. Parameters of 3D pCASL: TE/TR = 12.3/5110 ms, NEX = 2, FA = 90°, for axial orientation FOV = 22×22 cm, parallel imaging factor = 1, matrix size 128×128, and post labeling delay = 800, 1216, 1474, and 1853 ms. For each subject acquisition protocol was repeated after a 20-min walk. SWI images were reconstructed with denoising deep learning reconstruction (dDLR) [4], slices were then grouped by 3, visualized using minimum intensity projection (mIPS), and analyzed using an in-house built vascular structure extraction algorithm (VSEA). The flowchart for the VSEA is shown in Figure 1. An entire brain volume was segmented from the images using BET (Brain Extraction Tool) [5] and image contrast was enhanced through histogram equalization procedure. The slice with the most prominent traces of blood vessels was chosen from the volume for the analysis. A set of three blood vessels was identified after visual inspection, for each of the vessels, a number of points were marked along its length and fitted into the cubic spline. A binary mask was created from the splines by interpolation and then dilated with the disc structural element with the 2 px radius. To perform automatic identification of vessel structures (i) a Hessian-based filter [6] was used to boost the contrast for the vessel-like structures, (ii) the filtered image was thresholded and pixel-wise multiplied with a 3-vessel binary mask to keep the tube-like structures only along the manually identified blood vessels, (iii) the result ii was skeletonized to produce a set of single pixel-wide binary objects that were used for width and length measurements. The width was measured for each pixel of iii as the shortest distance to the non-vessel pixel of ii and averaged for each of the 3 blood vessels. The length was calculated as the total number of non-zero pixels of iii and scaled according to in-plane resolution. Contrast to noise CNR was calculated as:$$\mathrm{CNR} = \frac{|S_{\mathrm{in}} - S_{\mathrm{out}}|}{\epsilon_{\mathrm{out}}} \quad \quad \quad \mathrm{(1)}$$
where S in is the average signal for the region of interest inside the blood vessel (average of iii), S out and are the average signal and standard deviation of the signal respectively for the region of interest placed manually right outside the blood vessel [7]. Perfusion values from pCASL were measured for the two ROI placed manually in the thalamus region.
Results
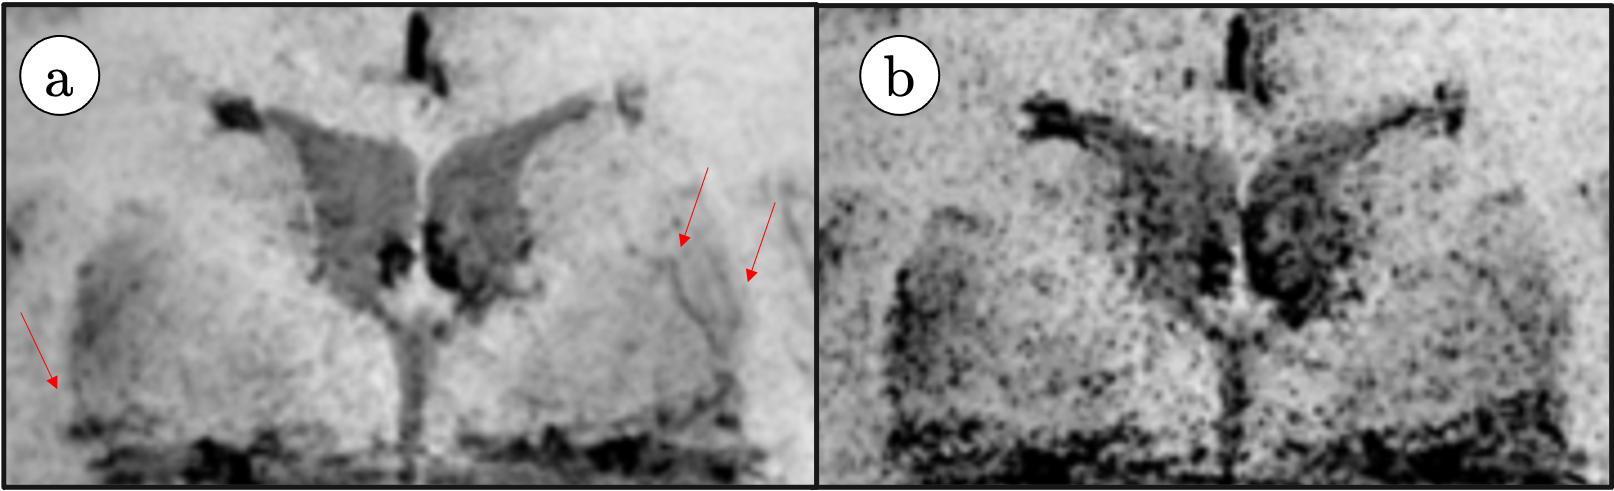
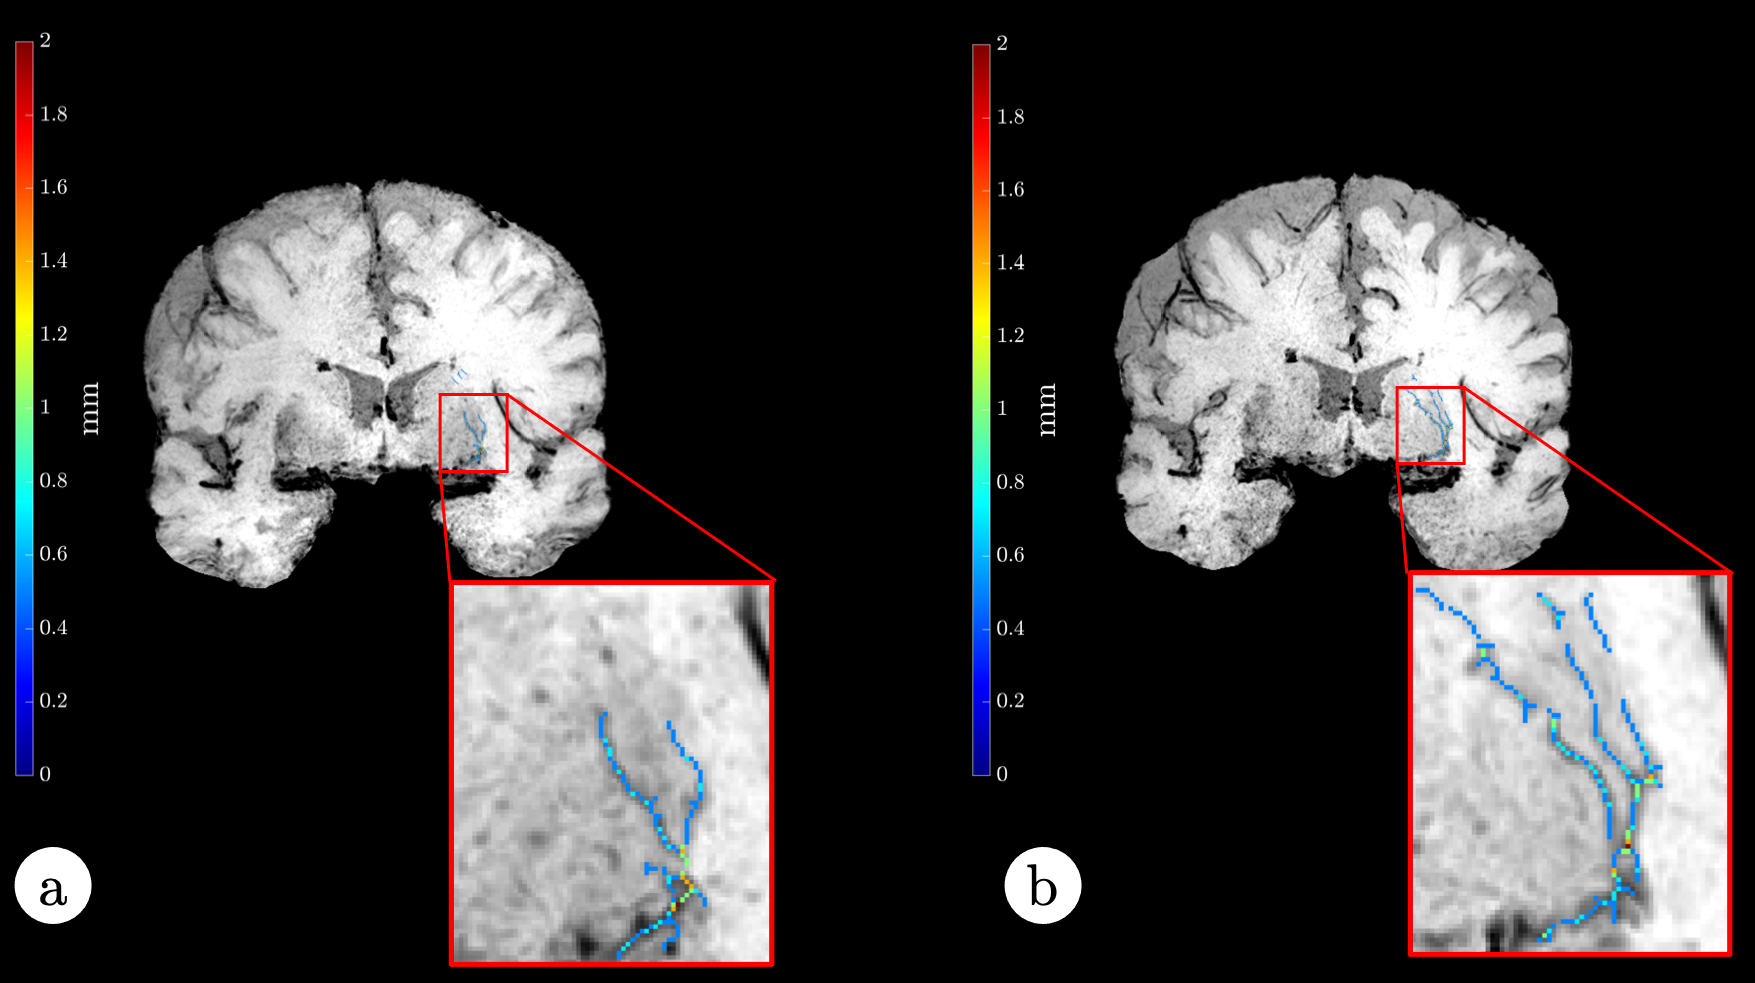
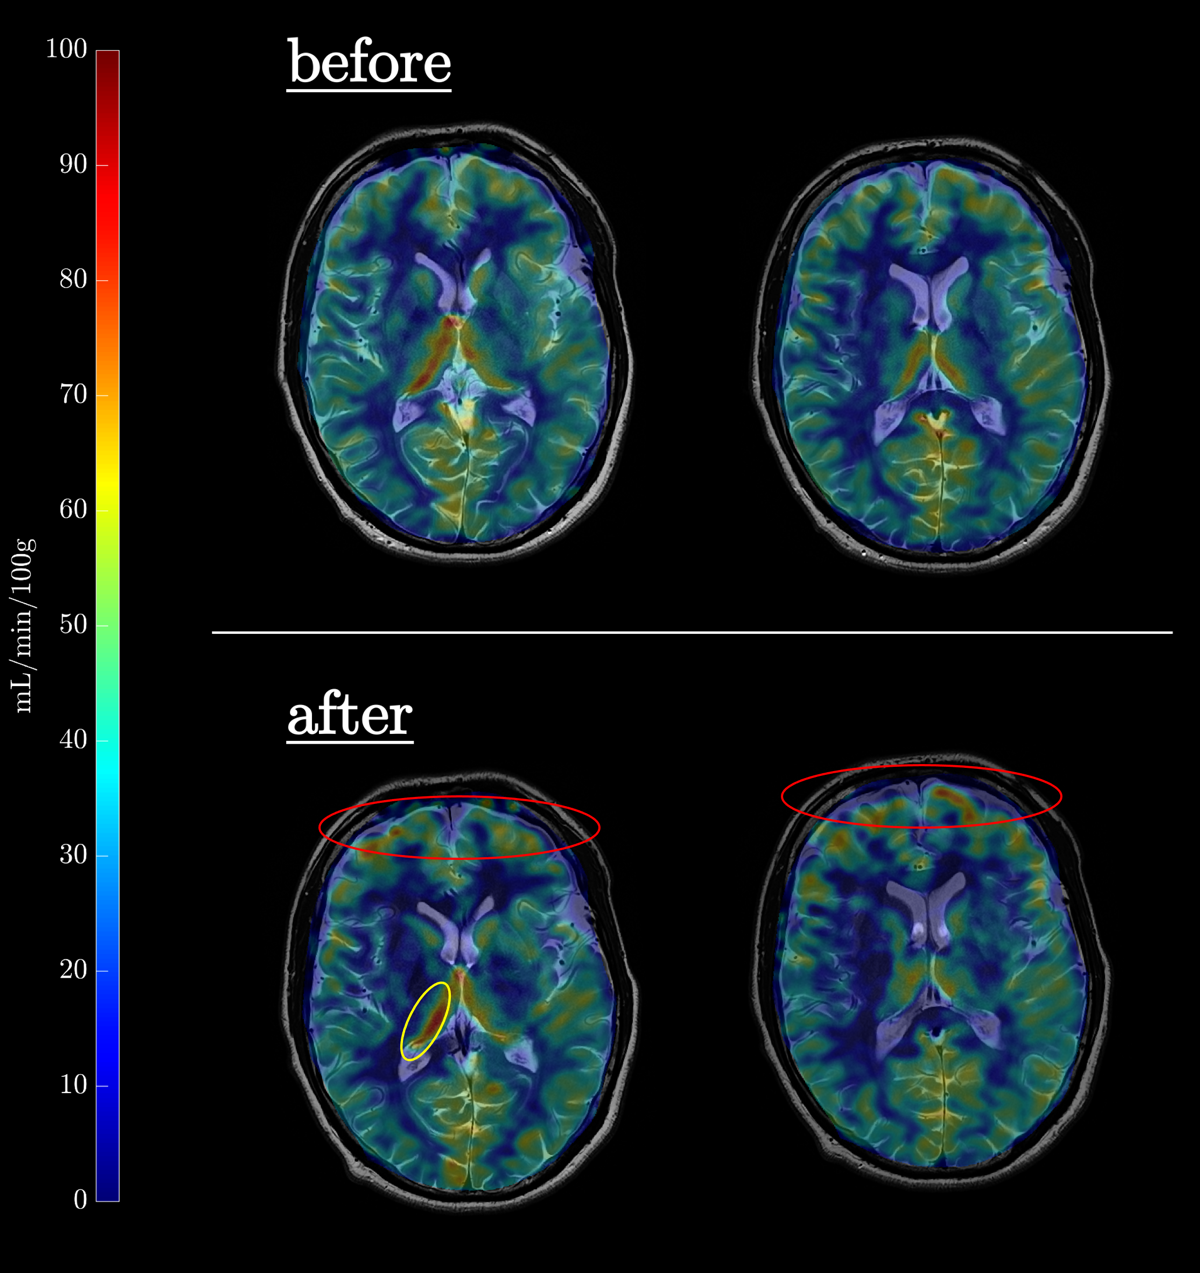
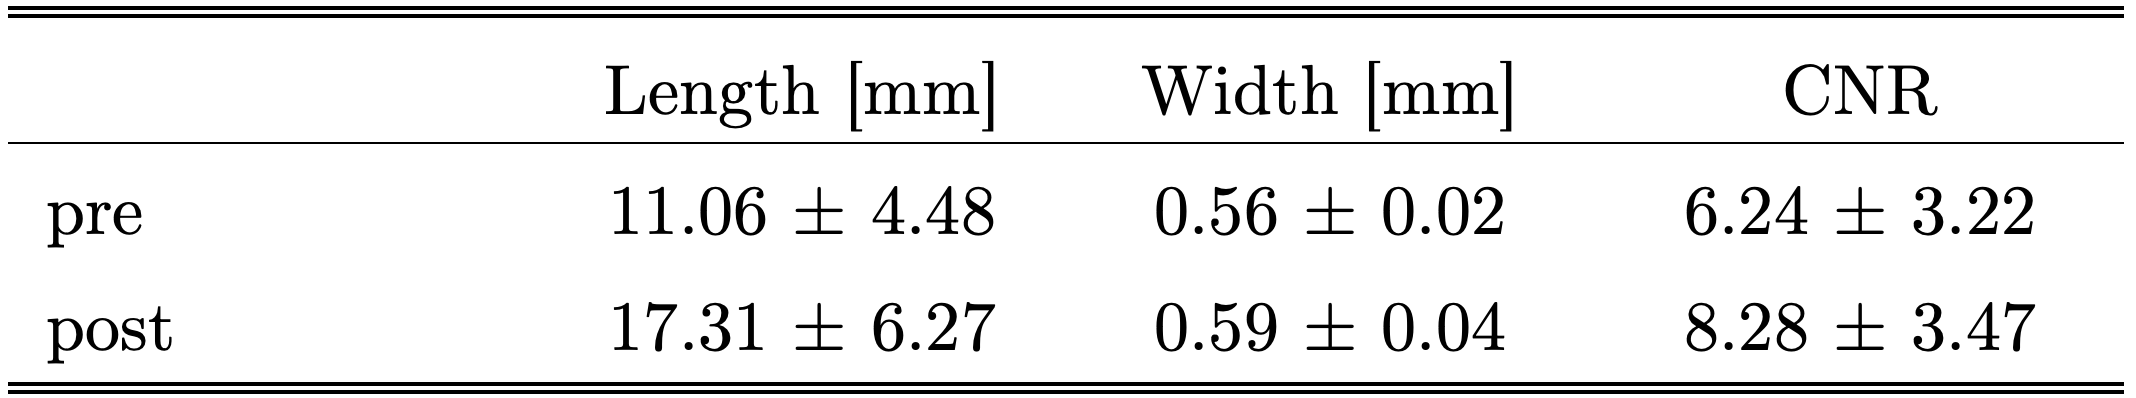
Figure 2 shows LSA images of late 60’s male with and without dDLR. With the dDLR, discernable LSA branches become visualized even in the older aged brain. Figure 3a and 3b show coronally acquired 3D SWI images of a volunteer subject with an overlay of VSEA identified vessels before and after exercise, respectively. An increase in length, as well as the width of the vessels, can be visually appreciated. Each pixel of the identified vessels is color-coded to visualize its’ width. Table 1 summarizes the discernable vessels, length, width, and CNR of each lenticulostriate artery (LSA) branch vessel as measured before and after exercise. Note the difference of the length and CNR pre- and post-exercise. Figure 4 shows pCASL colormaps overlayed on the top of high-resolution T2 images.Discussion
Exercise effect in intracranial blood flow by pCASL and increased in microvasculature by 3D SWI was demonstrated before and after the 20-min walk. Exercise has been known to improve intracranial health. Even with only a 20-min walk, length of LSA branches increased in all healthy subjects in a wide age range. Application of dDLR permits clear depiction of LSA branches by reducing the noise without removing other signals. Although entire brain cerebral blood flow (CBF) increased with exercise the values measured for the thalamus region were not consistently higher across the subjects. The effect of exercise at a peak CBF may vary in each individual.Conclusions
Application of dDLR and VSEA to SWI data enables quantification of changes in microvascular structures within a reasonable scan time. An increase in blood flow after physical activity was identified in both 3D SWI and 3D pCASL results.Acknowledgements
No acknowledgement found.References
[1] Maclntosh BJ., et al. Plos One. 2014; 9: e85163.
[2] Kimura T, et al. MRM 2011: 66: 437–447.
[3] Okuchi S., et al. Academic Radiology. 2014; 21(6): 812–6.
[4] Kidoh M, et al. Magn Reson Med Sci. 2020; 19(3): 195–206.
[5] Smith S. M., et al. Hum Brain Mapp. 2020; 17: 143–155.
[6] Jerman T., et al. IEEE T Med Imaging. 2016; 35: 2107–2118.
[7] Shen Y., et al. Magn Reson Imaging. 2020; 67: 90–100.
Figures