2600
Enhancing diffusion tensor distribution imaging via denoising of tensor-valued diffusion MRI data1Physical Chemistry, Lund University, Lund, Sweden, 2Random Walk Imaging AB, Lund, Sweden, 3NONPI Medical AB, Umeå, Sweden, 4Institute of Radiology, University Hospital Erlangen, Friedrich-Alexander-Universität Erlangen-Nürnberg (FAU), Erlangen, Germany
Synopsis
Diffusion tensor distribution imaging (DTD) is a versatile technique enabling to retrieve nonparametric intra-voxel diffusion tensor distributions from tensor-valued diffusion-encoded data. While DTD owes its versatility to the minimal set of assumptions on which it relies, such minimal constraints induce a high sensitivity to noise hindering DTD's potential clinical translation. In this work, we demonstrate within a brain-like numerical phantom that generalized singular-value shrinkage (GSVS) denoising of the data prior to DTD analysis drastically improves DTD's accuracy, mitigating the aforementioned issue.
Introduction
Over the past decade, enhanced specificity in diffusion MRI has been achieved within the framework of tensor-valued diffusion encoding.1-3 Among the multiple inversion techniques available for such data, diffusion tensor distribution imaging4-6 (DTD) outputs the most diverse microstructural information. DTD consists in a Monte-Carlo inversion7,8 of the diffusion MR signal $$$\mathcal{S}$$$, characterizing the voxel content in terms of a nonparametric distribution of diffusion tensors9 $$$\mathcal{P}(\mathbf{D})$$$. This inversion technique, also applicable to the diffusion-relaxation signals,10-12 enables the estimation of any statistical descriptor of the retrieved intra-voxel distributions. Besides, it has recently been employed to isolate sub-parts of the retrieved distributions related to individual fiber populations, allowing for the estimation of fiber-specific diffusion-relaxation measures.12-14 However, DTD is known to be noise-sensitive (mostly in terms of estimation biases),15 making its use challenging in the clinical setting where signal-to-noise ratios (SNRs) are typically low.In this work, we compare the accuracy and precision of DTD run on noisy and denoised datasets generated within a brain-like numerical phantom at a clinically relevant SNR=30.
Methods
Brain-like numerical phantom:Unlike in silico data, in vivo data does not lend itself to straightforward studies of the accuracy and precision of any given signal inversion, with the exception of stratified bootstrap strategies (to assess precision), which require repeated acquisitions. However, given that the denoising method investigated in this work (see below) employs a 5x5x5-voxel sliding window to estimate local noise levels, any relevant numerical phantom must, in this context, exhibit a realistic degree of in vivo "texture".
Consequently, we acquired a single in vivo dataset (see below) and designed a brain-like numerical phantom by running DTD on this dataset and by then using it as a forward model to compute the diffusion signals associated with the output DTD distributions and the in vivo sampling scheme. The DTD solution and its corresponding signals were then considered as "ground-truth" solution/signals for the following in silico analysis:
- add Rician noise with SNR=30 (as would be measured in the posterior centrum semiovale) to the ground-truth signals, obtaining 50 distinct "original" signals.
- denoise these noise realizations, obtaining 50 "denoised" signals.
- run DTD on the original/denoised signals.
- quantify DTD's accuracy in the original/denoised case by computing the absolute difference between the ground-truth values of various statistical descriptors and their medians (Med) across noise realizations.
- quantify DTD's precision in the original/denoised case by computing the interquartile range (IQR) of various statistical descriptors across noise realizations.
In vivo acquisition:
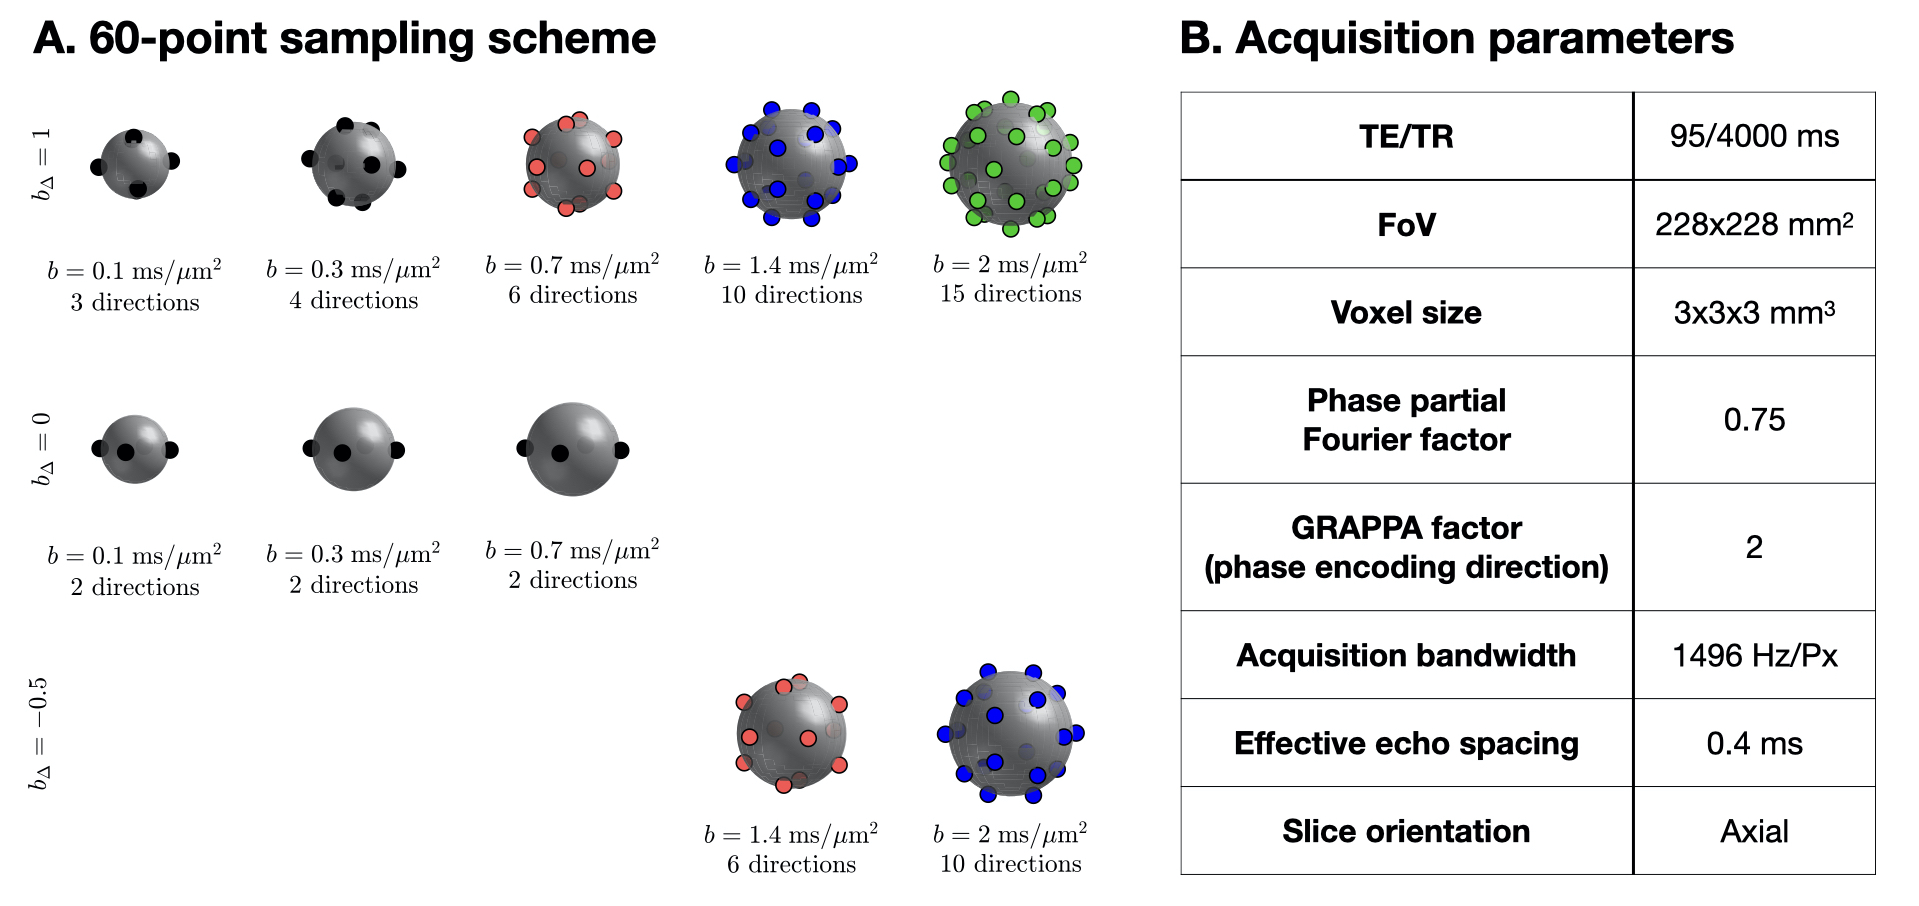
The study was approved by the local institutional review board. A healthy volunteer was measured on a 3T system (MAGNETOM Prisma, Siemens Healthcare AG, Erlangen, Germany) equipped with a 20-channel head coil. Data was acquired using an in-house developed single-shot spin-echo EPI sequence modified for tensor-valued diffusion encoding.16 While the chosen sampling scheme, whose direction sets are drawn from electrostatic repulsion17 and platonic solids,18 is presented in Figure 1.A, the parameters of the associated 6-minute 60-point acquisition are shown in Figure 1.B.
Denoising:
Images were denoised using the Marchenko-Pastur principal component analysis approach first introduced in Veraart et al.19,20 and later improved in Cordero-Grande et al.21 as generalized singular-value shrinkage (GSVS), as implemented in MRtrix3 (command dwidenoise).22
Diffusion tensor distribution imaging:
DTD4 inverts a discretized version of the following equation:9$$\mathcal{S}(\mathbf{b})=\mathcal{S}_0\int\!\mathcal{P}(\mathbf{D})\,\exp(-\mathbf{b}:\mathbf{D})\,\mathrm{d}\mathbf{D}\,,$$where $$$\mathbf{b}$$$ is any acquired b-tensor, $$$\mathcal{S}_0=\mathcal{S}(\mathbf{b}=\mathbf{0})$$$ is the non diffusion-weighted signal, and "$$$:$$$" is the Frobenius inner product. Images were processed using the DTD algorithm implemented in dVIEWR powered by MICE ToolkitTM.23
Results and discussion
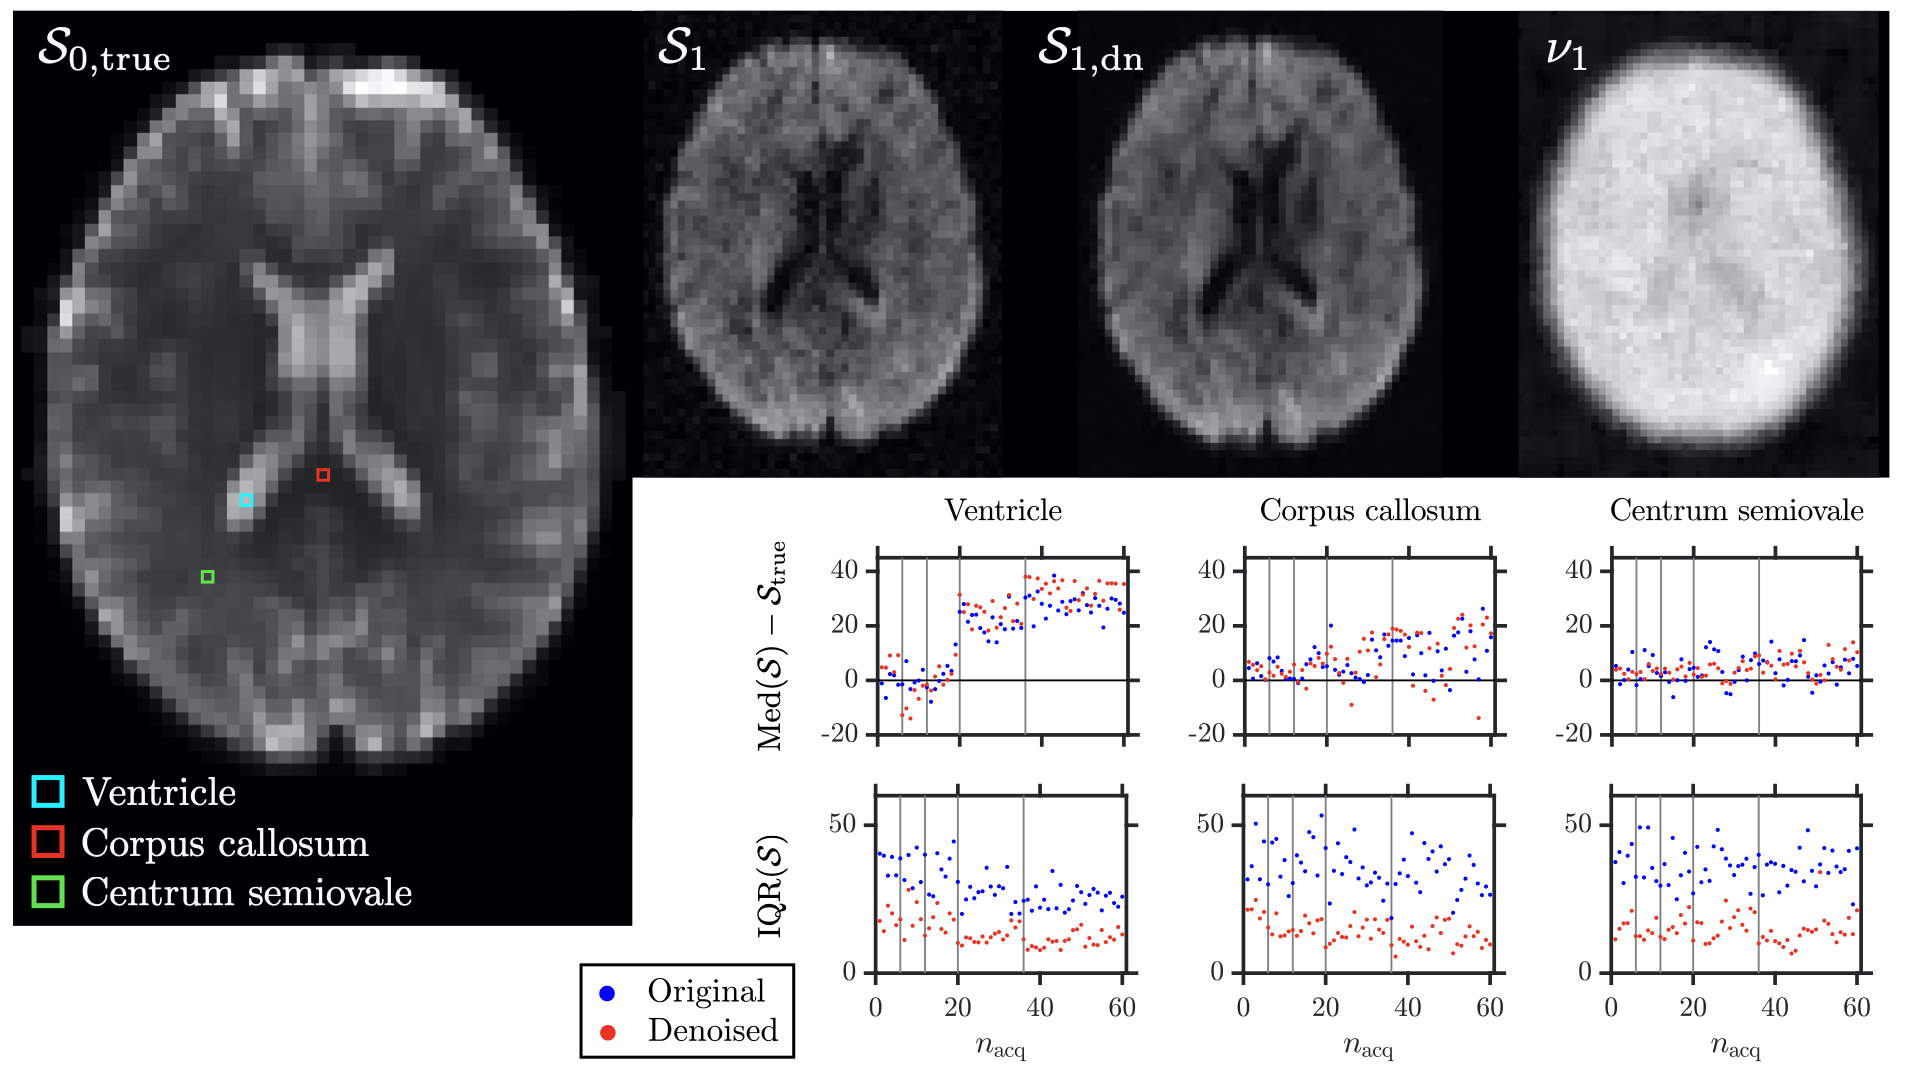
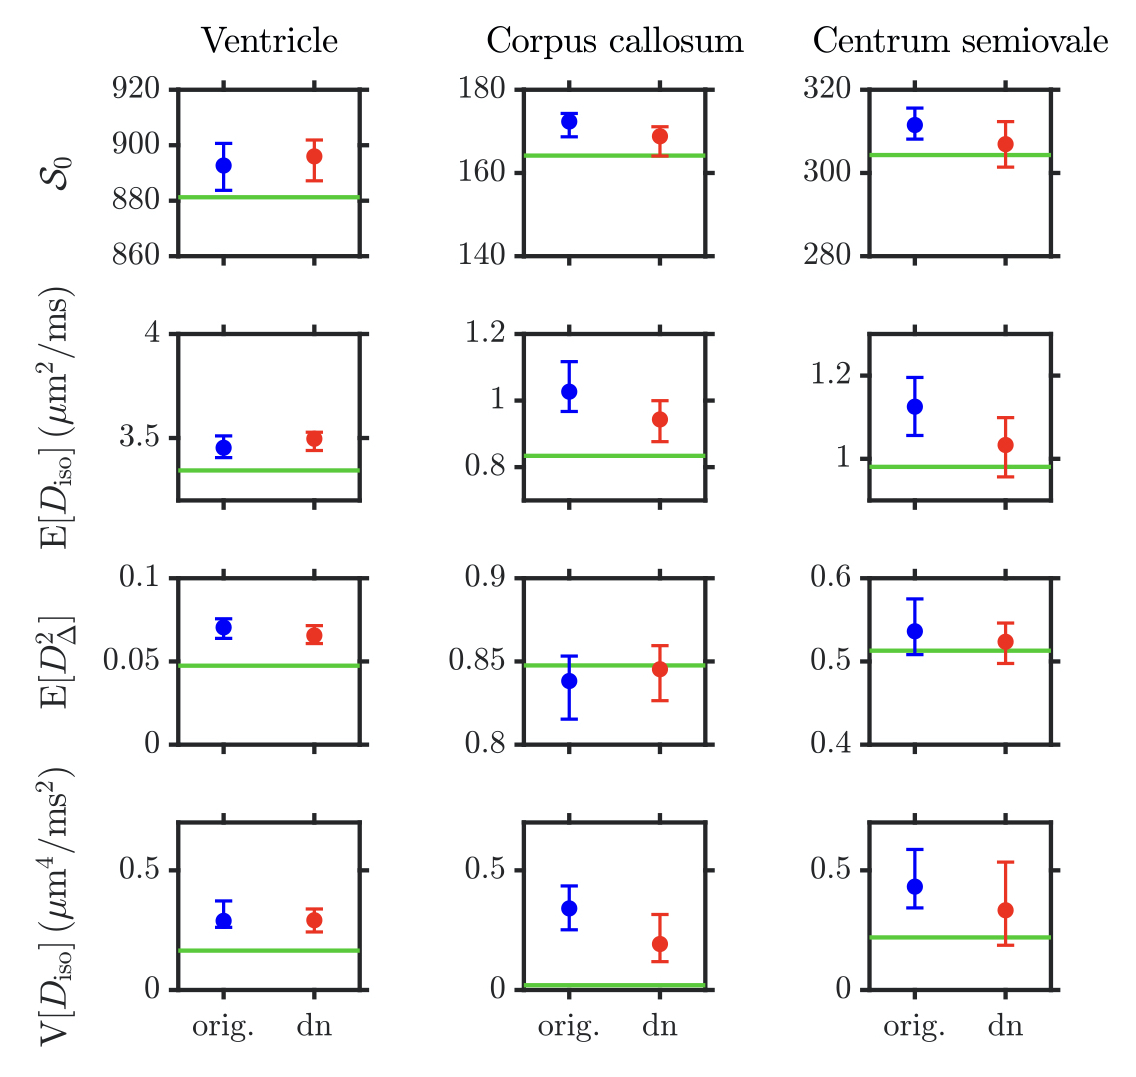
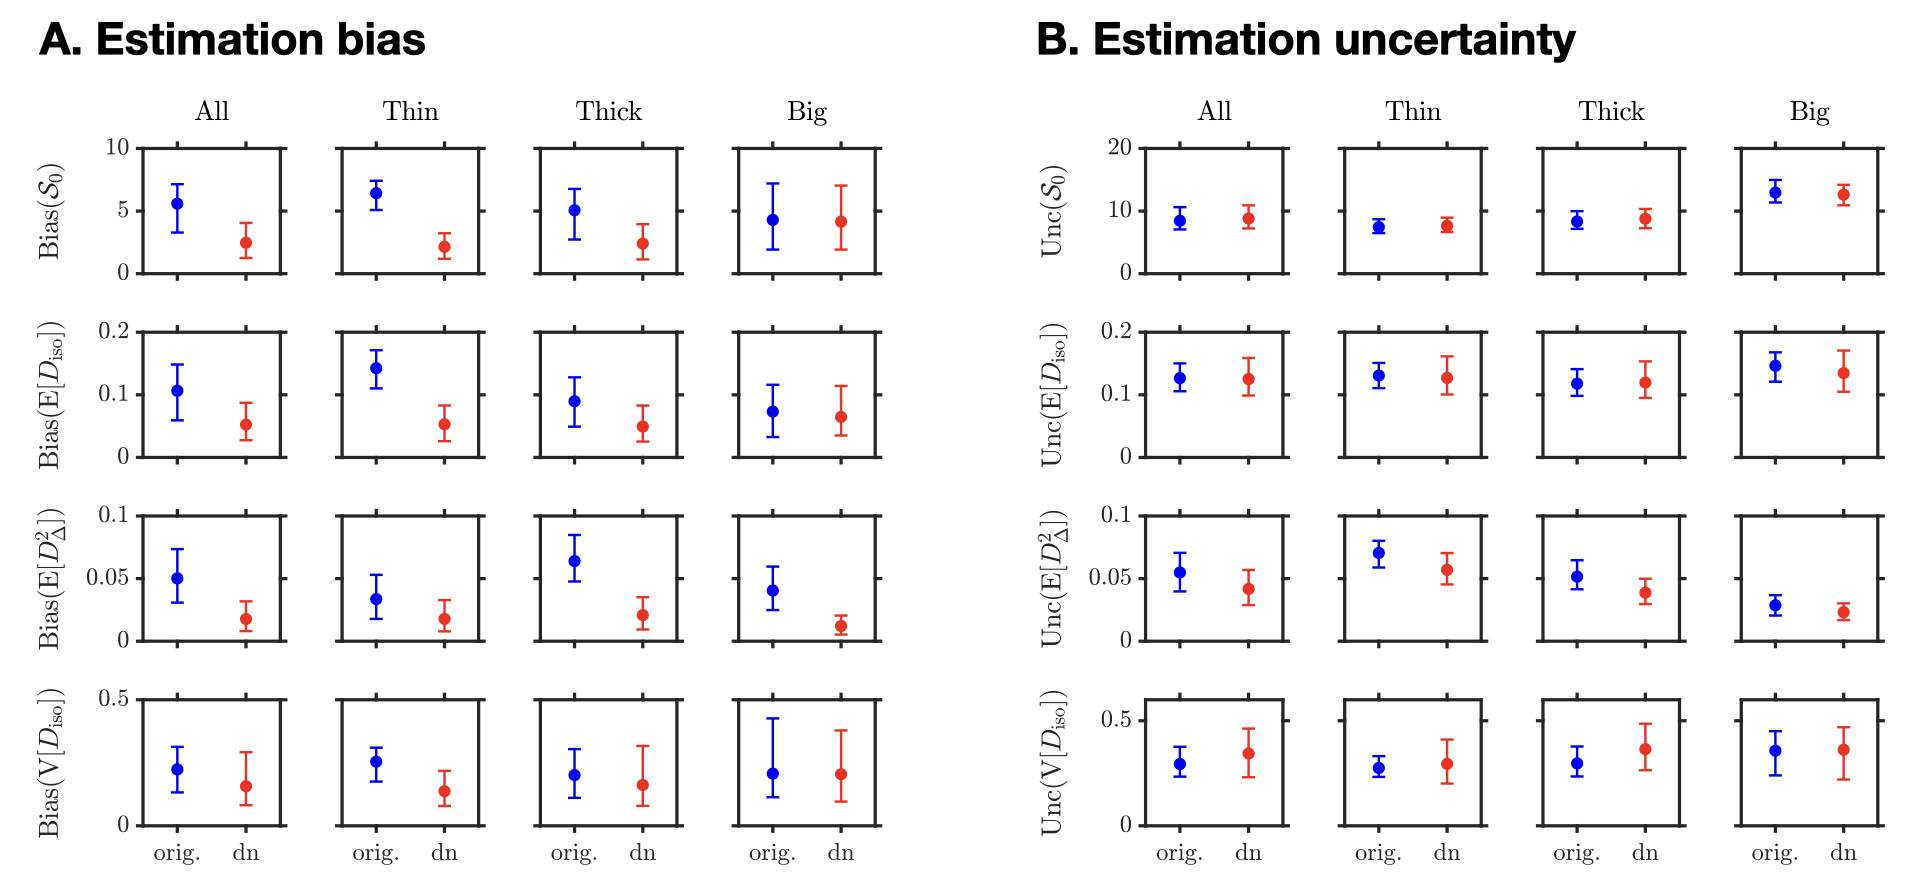
Figure 2 presents a typical axial signal map before/after GSVS denoising, along with the estimated noise map, which features a consistent underestimation in the ventricles. The statistics across noise realizations of diffusion signals from voxels of interest delineated on the ground-truth non diffusion-weighted signal map are also shown, demonstrating that GSVS renders diffusion signals less variable without affecting their noise bias.Figure 3 presents four DTD-derived statistical descriptors estimated in the voxels of interest of Figure 2:
- $$$\mathcal{S}_0$$$.
- mean diffusivity $$$\mathrm{E}[D_\mathrm{iso}]$$$.
- squared normalized anisotropy $$$\mathrm{E}[D_\Delta^2]$$$.
- variance of isotropic diffusivities $$$\mathrm{V}[D_\mathrm{iso}]$$$.
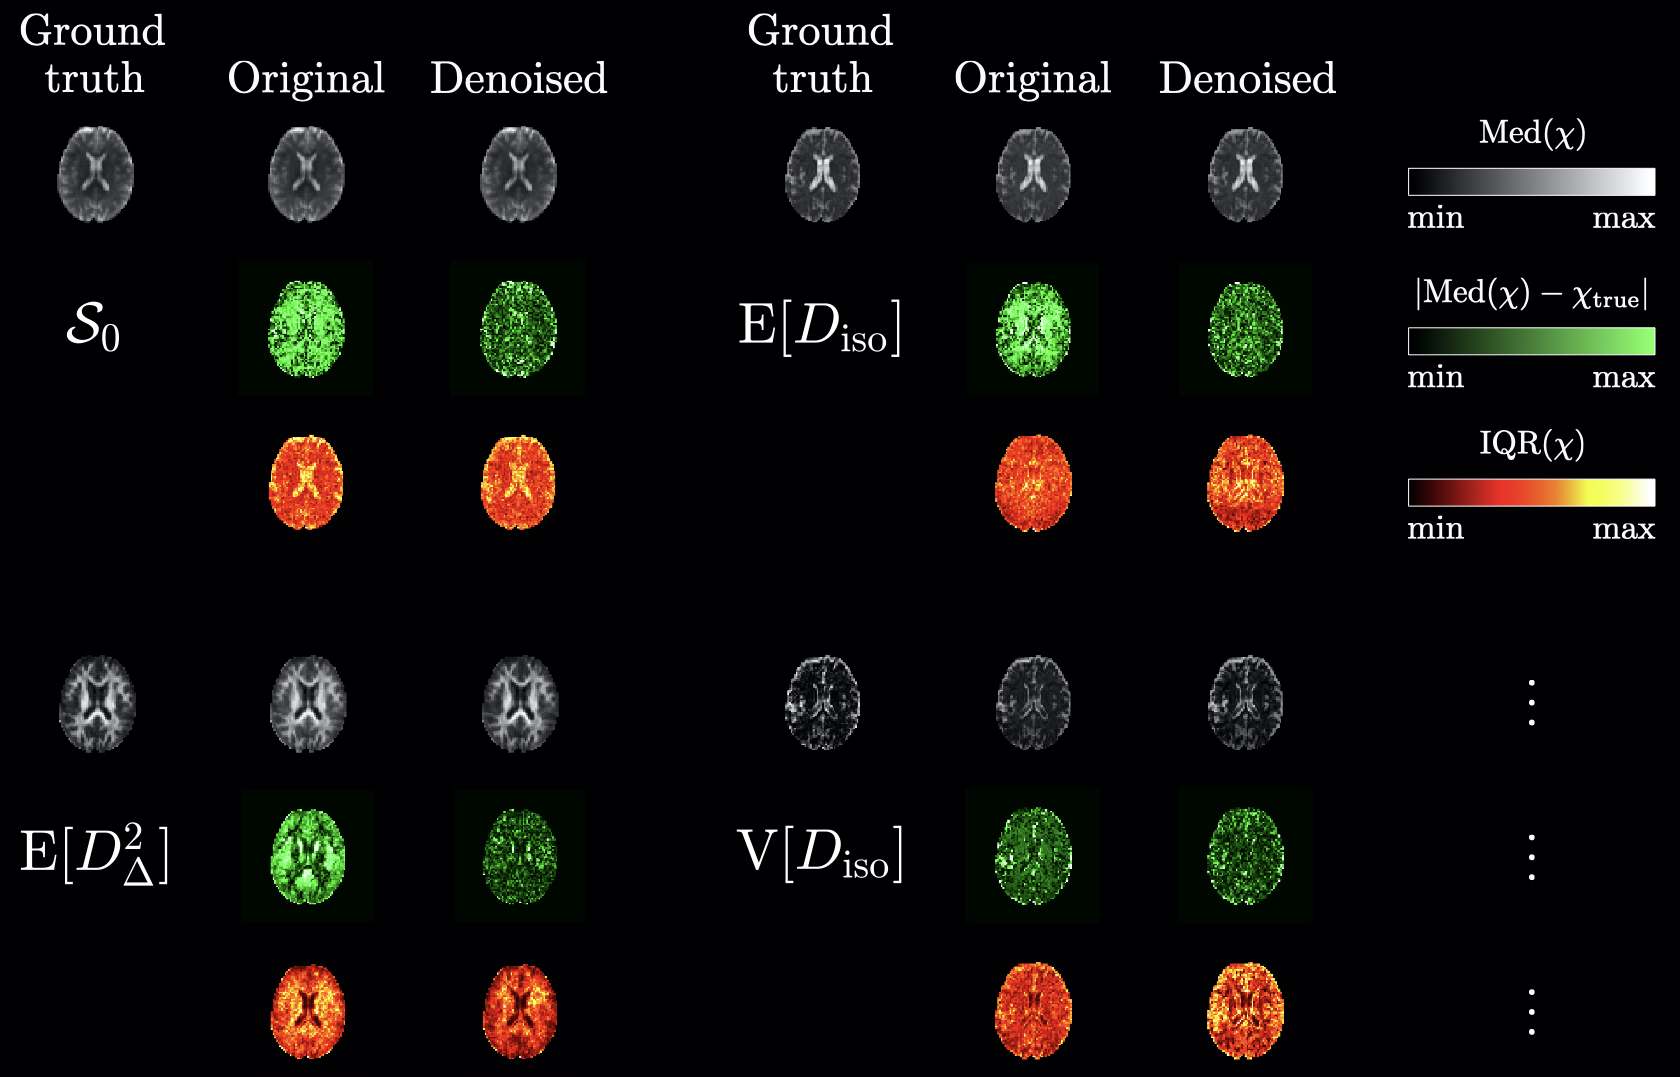
Figures 4 and 5 extend the above accuracy statement to an entire axial slice of our brain-like phantom, with the exception of two cases: only the accuracy of $$$\mathrm{E}[D_\Delta^2]$$$ improves upon denoising in fast-diffusing voxel contents (e.g. cerebrospinal fluid), and the accuracy of $$$\mathrm{V}[D_\mathrm{iso}]$$$ only improves upon denoising in white-matter-like voxel contents. As for precision, only that of $$$\mathrm{E}[D_\Delta^2]$$$ may improve in a consistent fashion.
Conclusion
This preliminary numerical study indicates that GSVS denoising has the potential to alleviate DTD's noise sensitivity at clinically relevant noise levels, opening the way toward versatile nonparametric microstructural studies in the clinic. Although requiring further investigation, GSVS may also improve the accuracy of higher-dimensional versions of DTD10-12 and its fiber-specific extensions,12-14 in particular when acquiring complex diffusion data enabling efficient debiasing strategies.21,24,25 Finally, this study may be translated in vitro via measuring calibrated phantoms (for accuracy and precision), and in vivo via stratified bootstrap (for precision).Acknowledgements
This work was financially supported by the Swedish Foundation for Strategic Research (ITM17-0267) and the Swedish Research Council (2018-03697). Funding for the position of F. B. Laun by the DFG is gratefully acknowledged (LA 2804/12-1). We thank the Imaging Science Institute (Erlangen, Germany) for providing us with measurement time.
P. Brynolfsson and A. Reymbaut are employees of Random Walk Imaging AB (Lund, Sweden, http://www.rwi.se/), which holds patents related to the described methods. P. Brynolfsson is also co-founder and shareholder of NONPI Medical AB (Umeå, Sweden, http://www.rwi.se/), which, along with Random Walk Imaging AB, own the source code of the dVIEWR software used for data analysis. D. Topgaard owns shares in Random Walk Imaging AB, holding patents related to the described methods.
References
1. D. Topgaard, Multidimensional diffusion MRI, Journal of Magnetic Resonance 275, 98-113 (2017).
2. H. Lundell and S. Lasič, Diffusion Encoding with General Gradient Waveforms. In: Topgaard D, (Ed.). Advanced Diffusion Encoding Methods in MRI. Cambridge, UK: Royal Society of Chemistry, (2020).
3. A. Reymbaut, Diffusion Anisotropy and Tensor-valued Encoding. In: Topgaard D, (Ed.). Advanced Diffusion Encoding Methods in MRI. Cambridge, UK: Royal Society of Chemistry, (2020).
4. D. Topgaard, Diffusion tensor distribution imaging, NMR in Biomedicine 32, e4066 (2019).
5. M. Yon et al., Diffusion tensor distribution imaging of an in vivo mouse brain at ultrahigh magnetic field by spatiotemporal encoding, 33 (11), e4355 (2020).
6. A. Reymbaut et al., Clinical research with advanced diffusion encoding methods in MRI. In: Topgaard D, (Ed.). Advanced Diffusion Encoding Methods in MRI. Cambridge, UK: Royal Society of Chemistry, (2020).
7. M. Prange and Y.-Q. Song, Quantifying uncertainty in NMR T2 spectra using Monte Carlo inversion. Journal of Magnetic Resonance 196, 54-60 (2009).
8. M. Prange and Y.-Q. Song, Understanding NMR T2 spectral uncertainty. Journal of Magnetic Resonance 204, 118-123 (2010).
9. B. Jian et al., A novel tensor distribution model for the diffusion-weighted MR signal, Neuroimage 37, 1, 164-176 (2007).
10. J. P. de Almeida Martins and D. Topgaard, Multidimensional correlation of nuclear relaxation rates and diffusion tensors for model-free investigations of heterogeneous anisotropic porous materials. Scientific Reports 8, 2488 (2018).
11. J. P. de Almeida Martins et al., Transferring principles of solid-state and Laplace NMR to the field of in vivo brain MRI, Magnetic Resonance 1, 27-43 (2020).
12. A. Reymbaut et al., Toward nonparametric diffusion‐T1 characterization of crossing fibers in the human brain, Magnetic Resonance in Medicine, 1-13, https://doi.org/10.1002/mrm.28604 (2020).
13. J. P. de Almeida Martins et al., Computing and visualising intra‐voxel orientation‐specific relaxation–diffusion features in the human brain, Human Brain Mapping, 1-19, https://doi.org/10.1002/hbm.25224 (2020).
14. A. Reymbaut et al., Resolving orientation-specific diffusion-relaxation features via Monte-Carlo density-peak clustering in heterogeneous brain tissue, arXiv:2004.08626 (2020).
15. A. Reymbaut et al., Accuracy and precision of statistical descriptors obtained from multidimensional diffusion signal inversion algorithms, NMR in Biomedicine 33, e4267 (2020).
16. J. Martin et al., Contrast-to-noise ratio analysis of microscopic diffusion anisotropy indices in q-space trajectory imaging, Zeitschrift für Medizinische Physik 30, 1, 4-16 (2020).
17. D. K. Jones et al., Optimal strategies for measuring diffusion in anisotropic systems by magnetic resonance imaging. Magnetic Resonance in Medicine 42, 515-525 (1999).
18. C.-F. Westin et al., Q-space trajectory imaging for multidimensional diffusion MRI of the human brain, Neuroimage 135, 345-362 (2016).
19. J. Veraart et al., Denoising of diffusion MRI using random matrix theory, Neuroimage 142, 394-406 (2016).
20. J. Veraart et al., Diffusion MRI noise mapping using random matrix theory, Magnetic Resonance in Medicine 76 (5), 1582-1593 (2016).
21. L. Cordero-Grande et al., Complex diffusion-weighted image estimation via matrix recovery under general noise models, Neuroimage 200, 391-404 (2019).
22. J.-D. Tournier et al., MRtrix3: A fast, flexible and open software framework for medical image processing and visualisation, Neuroimage 202, 116-137 (2019).
23. dVIEWR powered by MICE ToolkitTM, multidimensional diffusion MR data analysis software, Random Walk Imaging AB and NONPI Medical AB (Sweden), www.dviewr.com & www.micetoolkit.com (last accessed: 16th of December 2020).
24. C. Eichner et al., Real diffusion-weighted MRI enabling true signal averaging and increased diffusion contrast, Neuroimage 122, 373-384 (2015).
25. M. Pizzolato et al., Adaptive phase correction of diffusion-weighted images, Neuroimage 206, 116274 (2020).
26. T.E. Conturo et al., Encoding of anisotropic diffusion with tetrahedral gradients: A general mathematical diffusion formalism and experimental results, Magnetic Resonance in Medicine 35, 399-412 (1996).
Figures