2230
Hippocampal Single-Voxel MR Spectroscopy with Long Echo Time at 3 Tesla1Department of Biomedical Engineering, Columbia University, New York City, NY, United States, 2Bernard and Irene Schwartz Center for Biomedical Imaging, Department of Radiology, New York University Grossman School of Medicine, New York City, NY, United States, 3High-Field MR Center, Department of Biomedical Imaging and Image-Guided Therapy, Medical University of Vienna, Vienna, Austria, 4Department of Radiology, Columbia University Medical Center, New York City, NY, United States, 5Department of Neurology, New York University Grossman School of Medicine, New York City, NY, United States, 6Center for Advanced Imaging Innovation and Research, Department of Radiology, New York University Grossman School of Medicine, New York City, NY, United States
Synopsis
The hippocampus is one of the most challenging brain regions for proton MR spectroscopy (MRS) applications. Moreover, quantification of J-coupled species such as myo-inositol (m-Ins) and glutamate + glutamine (Glx) is affected by the presence of macromolecular background. Here we investigate the feasibility of reproducibly measuring their concentrations at long TE of 120 ms, using sLASER localization.
Introduction
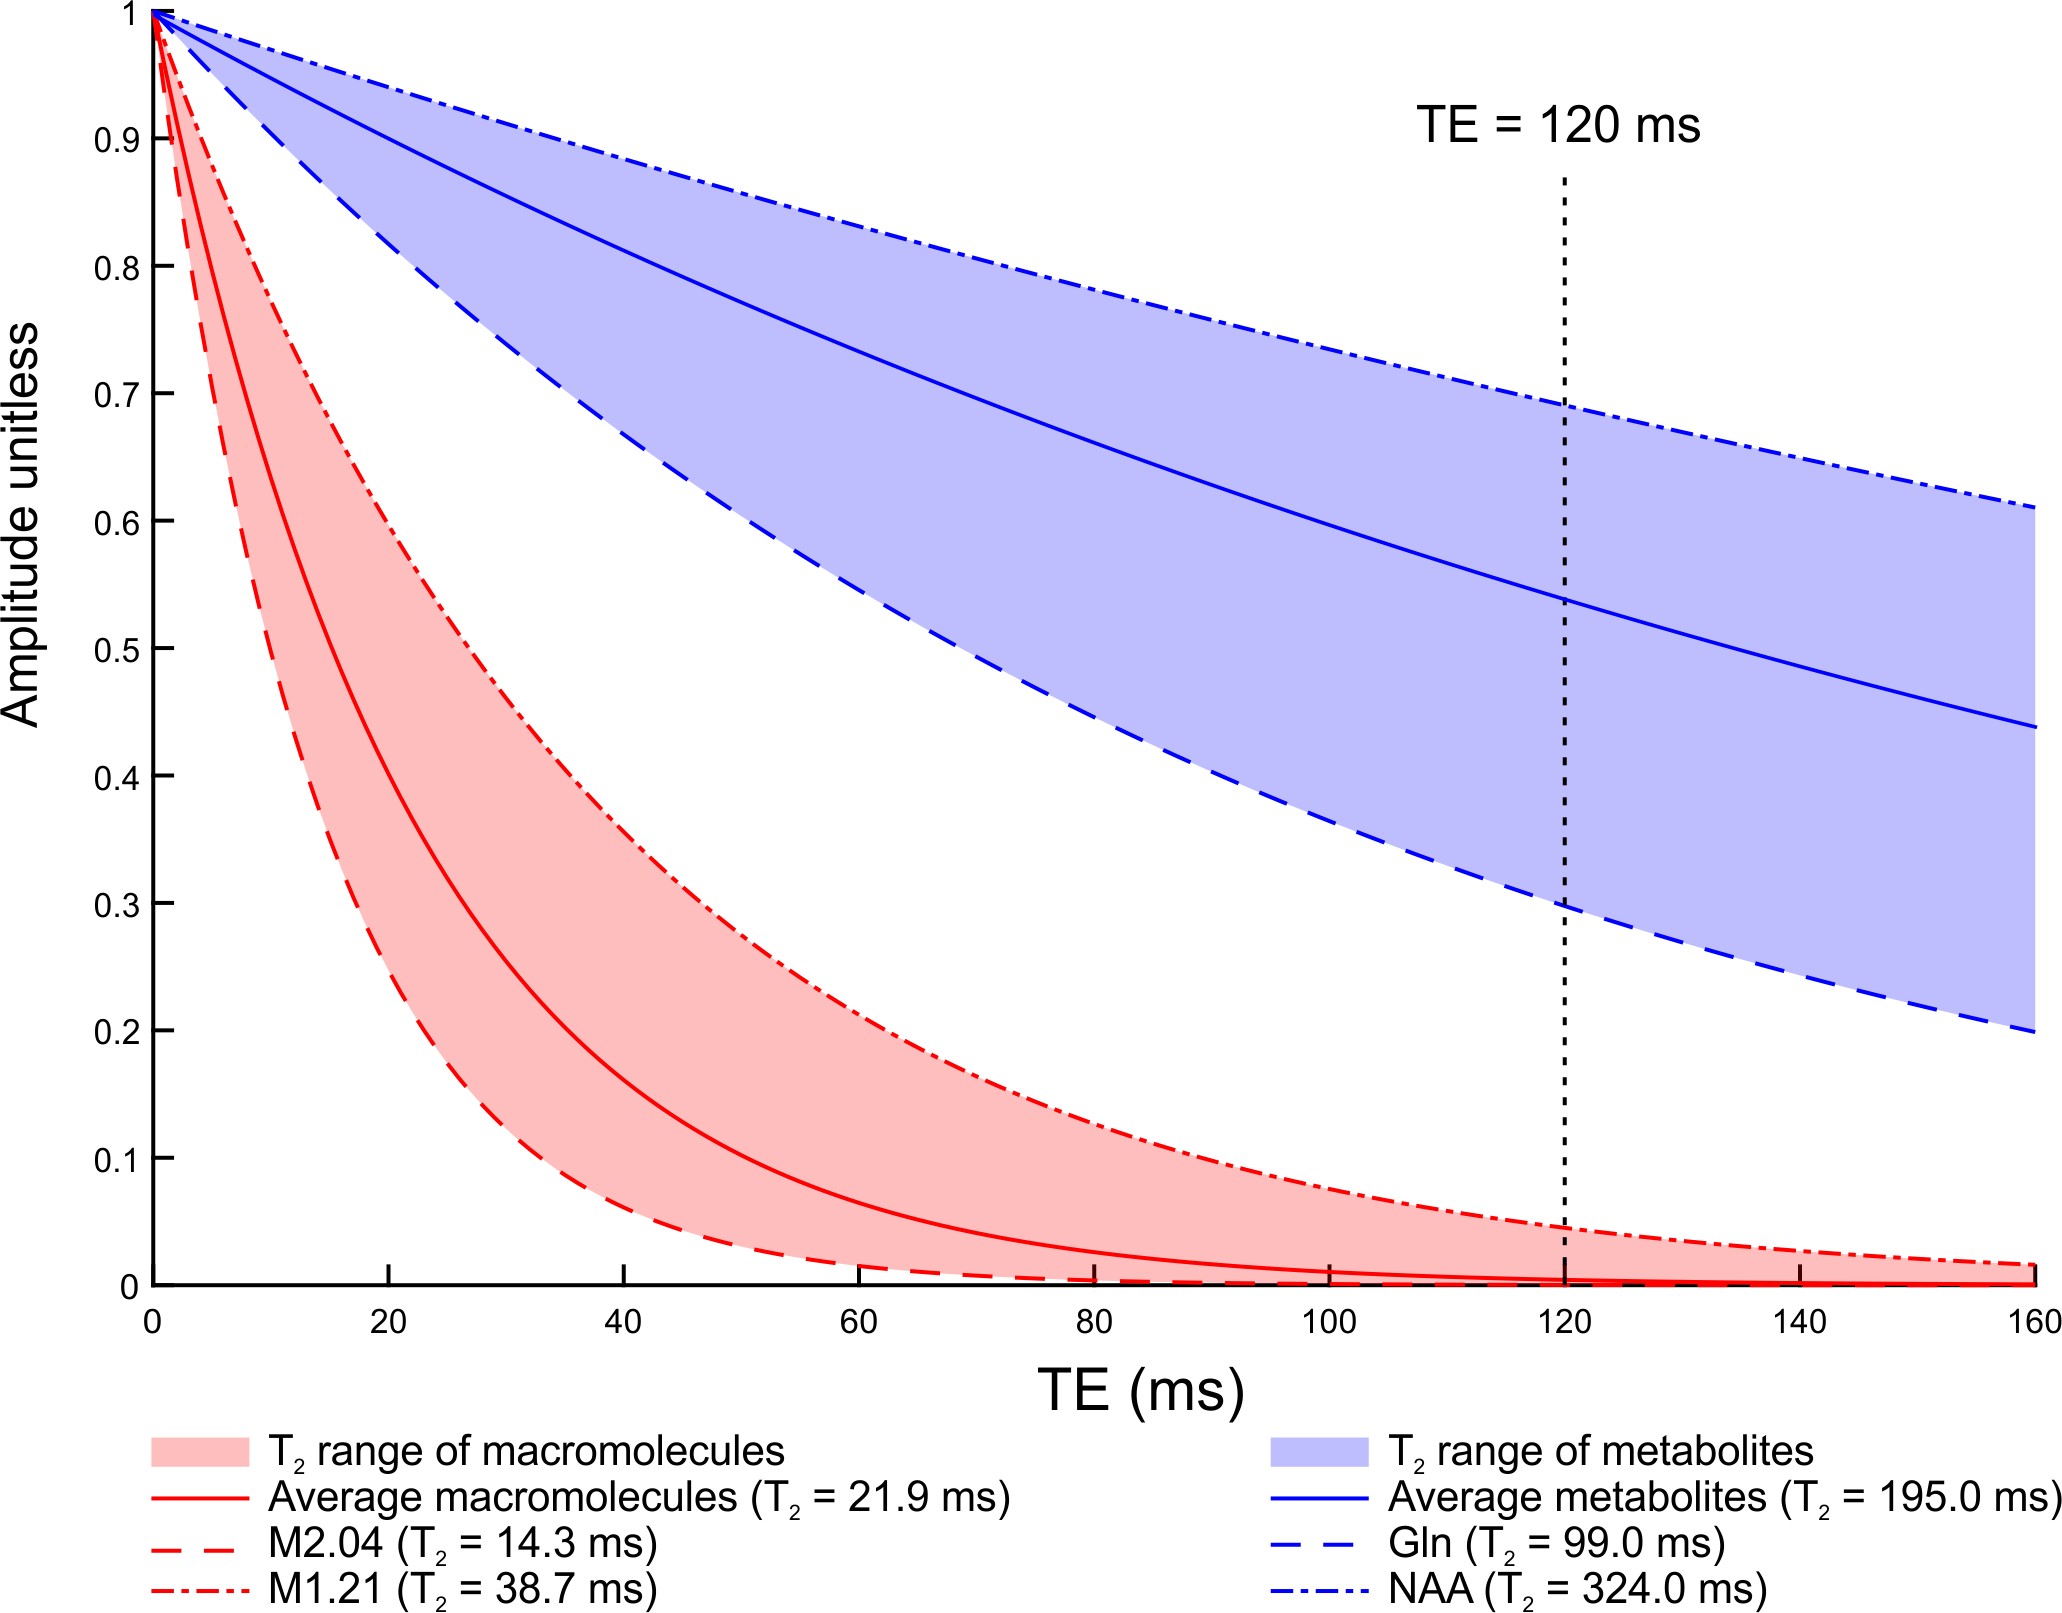
The hippocampus is one of the most challenging brain regions for obtaining reliable MRS data. Short echo time MRS (TE < 50 ms) is generally preferred due to increased SNR and limited J-evolution (i.e. signal complication) of metabolites1. However, resolving spectral overlap at short TE remains a challenge, and the optimal way to report systematic error sources such as the macromolecular (MM) background is still under debate2. The effective T2 relaxation times of 10 different macromolecular resonances were recently reported, enabling the selection of the shortest possible TE at which the MM background has decayed to the noise level3 (Figure 1).The two objectives of this work were:
- to minimize chemical shift displacement errors and minimize macromolecular background by employing a semi-adiabatic localization by adiabatic selective refocusing (sLASER) sequence4 with 120 ms TE.
- to establish the signal variability of the resulting long-TE sLASER approach in terms of coefficients of variation (CVs) of metabolite concentrations.
Methods
Subjects & HardwareSix subjects (3 males; mean ± standard deviation 32.5 ± 10.2 years)) were scanned as follows: three (1 male) at the Center for Biomedical Imaging (CBI) at New York University Langone Health, and three (2 males) at the Jerome L. Greene Science Center at Columbia University, part of the Columbia MR Research Center (CMRRC). All subjects were scanned in Siemens Prisma 3 T systems (Siemens Healthineers, Erlangen, Germany) using a standard clinical 20-channel head coil (Siemens).
MRI, MRS & Data processing
Hippocampi were localized to a 3.4-mL VOI (26x10x13 mm3) in left hippocampus referencing 3D MP-RAGE sequence. VOI brain tissue was segmented from the resultant images with SPM125. Metabolites were measured using sLASER with an optimized sinc excitation pulse and four GOIA-W(16,4) refocusing pulses (6) (TE = 120 ms, TR = 1.5 s, number of excitations = 256 with 4 dummy scans). All spectra were acquired as 2048 complex points, with a spectral bandwidth of 2000 Hz and 32-step phase cycling7. Spectral processing and linear combination modeling with a MARSS-simulated8,9 basis set (myi-inositol: m-Ins, scyllo-inositol: s-Ins, choline-containing compounds: Cho, creatine: Cr, glutamine: Gln, glutamate: Glu, N-acetyl aspartate: NAA and lactate: Lac) were done in INSPECTOR10–12. Since several amino acids resonate close to the signal of lactate13, detected signal from this frequency range was termed Lac+. Sum of Glu and Gln was termed Glx. Fit parameter precision was estimated with Cramér-Rao lower bounds (CRLB)14. Absolute metabolite concentrations were calculated using the measured water signal15, taking into account published water and metabolic relaxation times16–22.
Signal variability
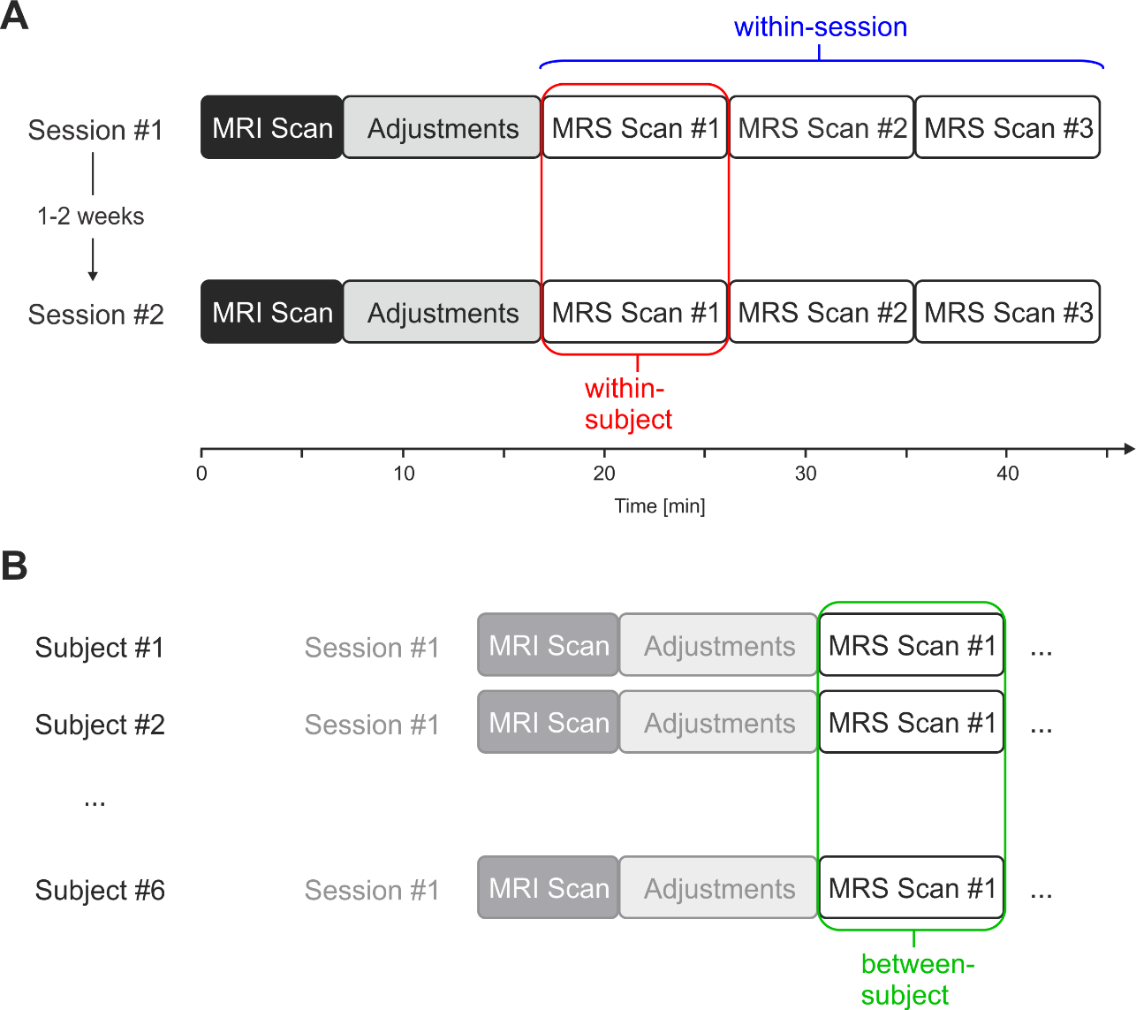
Variability of metabolite concentrations within sessions, within subjects, and between subjects were assessed with coefficients of variation (CV), defined as the ratio of the standard deviation to the mean. “Within-session” refers to variability among three consecutive scans in one session of the same subject. “Within-subject” was defined as variability between the first scan from both distinct sessions in the same subject. “Between-subject” was defined as variability among all subject scans, where subject scan was defined as only the first scan from the first session. Overview of the experimental setup and illustration of calculation of the three variances is shown in Figure 2. Metabolite concentrations for all subjects were reported from session #1 and scan #1.
Results & Discussion
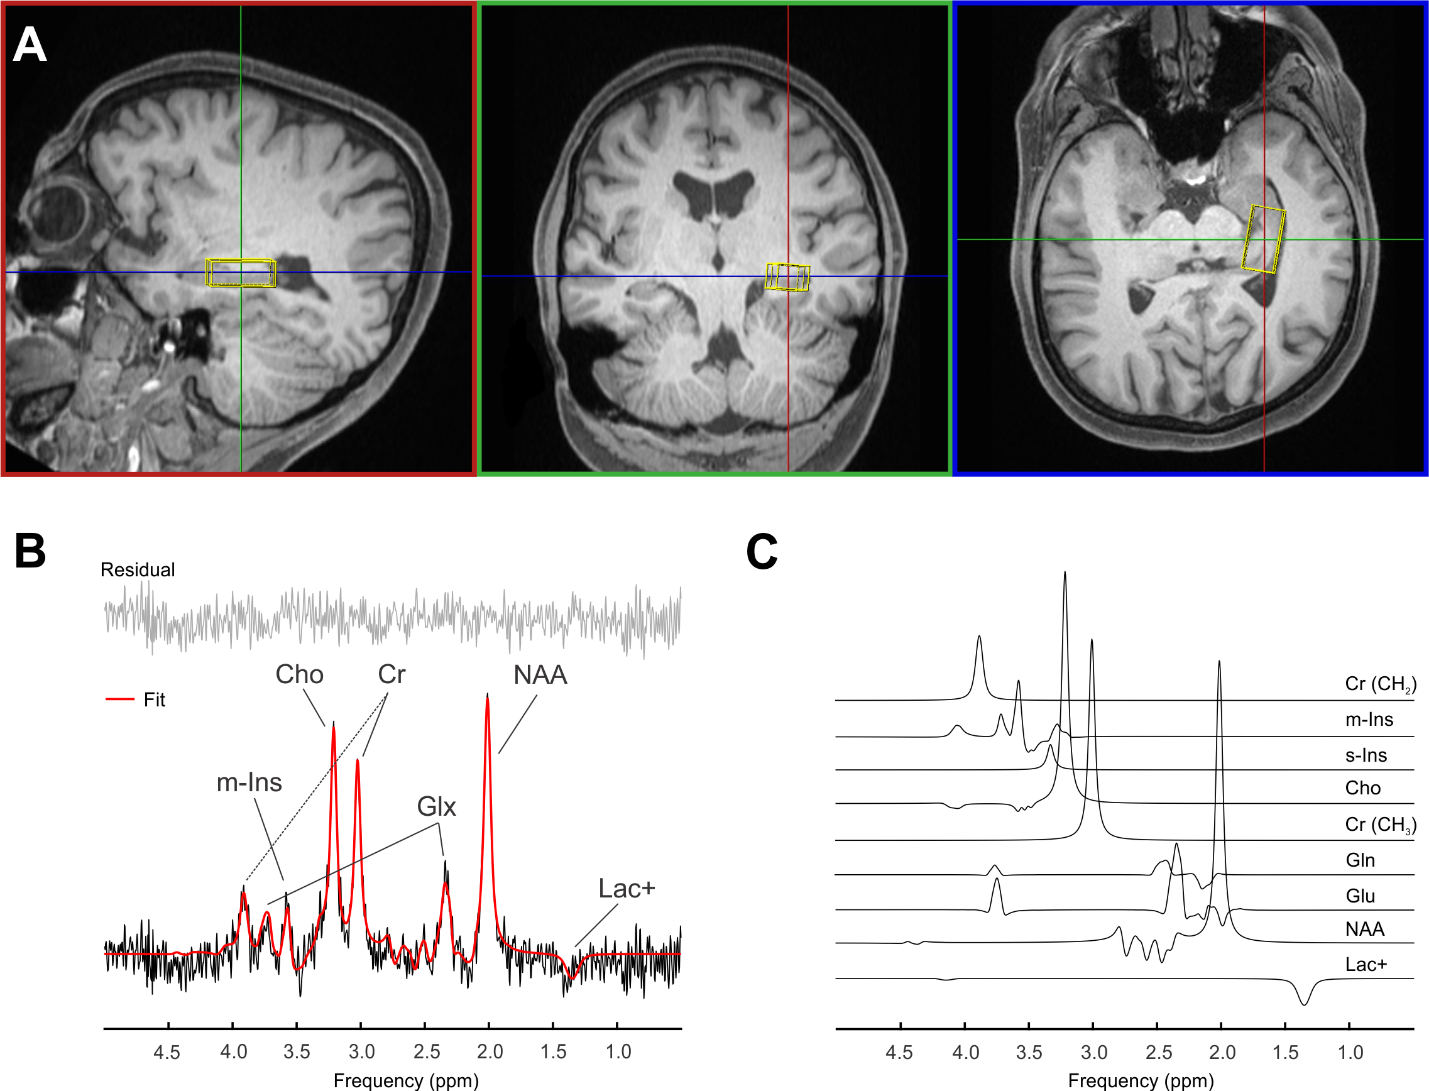
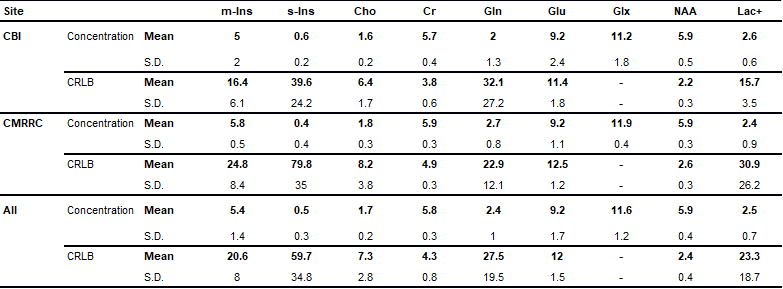
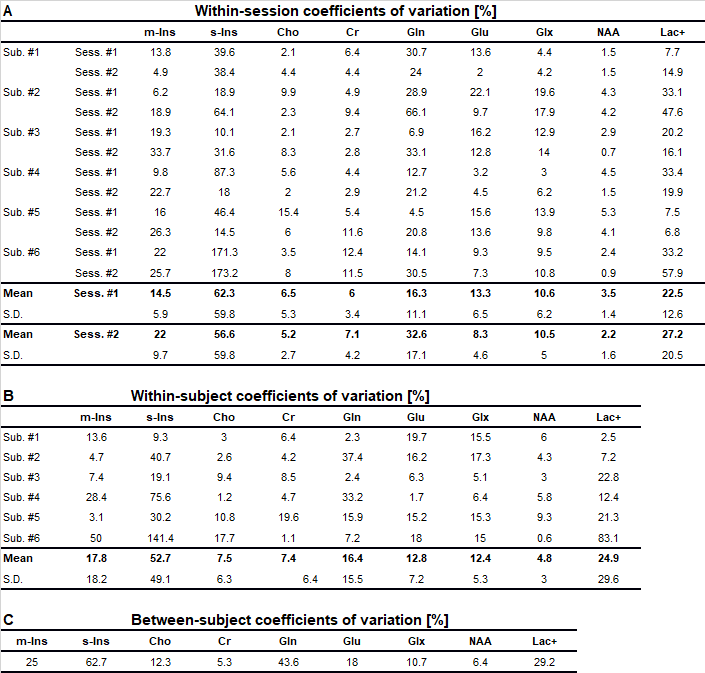
Voxel placement for the left hippocampus is shown in Figure 3A. A hippocampal spectrum acquired at 120 ms TE is shown with its fitted linear combination model in Figure 3B and basis set for quantification in Figure 3C. Mean metabolite concentrations (reported from session #1 and scan #1) from all subjects measured at both sites are summarized with their corresponding mean CRBLs in Table 1.The within-session CVs ranged from low values for NAA (across all six subjects: session one 3.5 ± 1.4%; session two 2.2 ± 1.6%) to high values for s-Ins (62.3 ± 59.8%; 56.6 ± 59.8%, respectively). The within-session CVs of all basis set metabolites are shown in Table 2A. Within-subject CVs ranged from a minimum of 0.6% for NAA in subject #6 to a maximum of 141.4% for s-Ins in the same subject (Table 2B). Between-subject CVs of volume fractions and metabolite concentrations from session 1 and scan 1 of all subjects are summarized in Table 2C.
Conclusion
We showed that presented sLASER sequence can be used to reliably measure metabolites in the hippocampus, a key region affected in many neurological disorders, using the shortest TE at which macromolecules have been shown in cortical regions to decay to the noise level. We report the CVs of all major metabolites including Glx and m-Ins to inform sample size estimations for future studies of the hippocampus in which the presence of MM baseline is undesirable.Acknowledgements
This study was funded by the National Institutes of Health (NIH) through the following grants: P30AG008051, R21NS112853 and P41EB017183. This work was performed at the Center for Biomedical Imaging at New York University Langone Health and at the Zuckerman Mind Brain Behavior Institute MRI Platform, a shared resource.References
1. Landheer K, Gajdošík M, Juchem C. A semi-LASER, single-voxel spectroscopic sequence with a minimal echo time of 20.1 ms in the human brain at 3 T. NMR Biomed. 2020:e4324 doi: 10.1002/nbm.4324.
2. Giapitzakis I, Borbath T, Murali‐Manohar S, Avdievich N, Henning A. Investigation of the influence of macromolecules and spline baseline in the fitting model of human brain spectra at 9.4T. Magn. Reson. Med. 2019;81:746–758 doi: 10.1002/mrm.27467.
3. Landheer K, Gajdošík M, Treacy M, Juchem C. Concentration and effective T2 relaxation times of macromolecules at 3T. Magn. Reson. Med. 2020:mrm.28282 doi: 10.1002/mrm.28282.
4. Scheenen TWJ, Klomp DWJ, Wijnen JP, Heerschap A. Short echo time 1H-MRSI of the human brain at 3T with minimal chemical shift displacement errors using adiabatic refocusing pulses. Magn. Reson. Med. 2008;59:1–6 doi: 10.1002/mrm.21302.
5. Ashburner J, Friston KJ. Unified segmentation. Neuroimage 2005;26:839–851 doi: 10.1016/j.neuroimage.2005.02.018.
6. Andronesi OC, Ramadan S, Ratai E, Jennings D. Spectroscopic Imaging with Improved Gradient Modulated Constant Adiabaticity Pulses on High-Field Clinical Scanners. J Magn Reson 2010;203:283–293 doi: 10.1016/j.jmr.2010.01.010.Spectroscopic.
7. Neji R, Schuster C. Phase Cycling for Semi-Laser Single Voxel Spectroscopy. In: Proceedings of Annual Meeting of International Society for Magnetic Resonance in Medicine. ; 2014. p. 3723.
8. Landheer K, Juchem C. Magnetic Resonance Spectrum Simulator - MARSS. http://innovation.columbia.edu/technologies/CU19215_MARSS.
9. Landheer K, Swanberg KM, Juchem C. Magnetic resonance Spectrum simulator (MARSS), a novel software package for fast and computationally efficient basis set simulation. NMR Biomed. 2019:1–13 doi: 10.1002/nbm.4129.
10. Juchem C. INSPECTOR: Magnetic resonance spectroscopy software for optimized data extraction. innovation.columbia.edu/technologies/cu17130_inspector. Published 2020.
11. Juchem C. INSPECTOR: “The New Kid on the Block.” ISMRM Virtual Study Group Meeting - MR Spectroscopy. https://ismrm.adobeconnect.com/_a1156337412/pvzkfszv1l4s/. Published 2017.
12. Gajdošík M, Landheer K, Swanberg KM, Juchem C. INSPECTOR: Free Software for Magnetic Resonance Spectroscopy Data Inspection, Processing, Simulation and Analysis. Sci. Rep.:In revision.
13. Grand S, Passaro G, Ziegler A, et al. Necrotic Tumor versus Brain Abscess: Importance of Amino Acids Detected at 1 H MR Spectroscopy—Initial Results. Radiology 1999;213:785–793 doi: 10.1148/radiology.213.3.r99dc10785.
14. Cavassila S, Deval S, Huegen C, Van Ormondt D, Graveron-Demilly D. Cramer-Rao Bound Expressions for Parametric Estimation of Overlapping Peaks: Influence of Prior Knowledge. J. Magn. Reson. 2000;143:311–320 doi: 10.1006/jmre.1999.2002.
15. Brief EE, Moll R, Li DKB, MacKay AL. Absolute metabolite concentrations calibrated using the total water signal in brain 1 H MRS. NMR Biomed. 2009;22:349–354 doi: 10.1002/nbm.1349.
16. Lu H, Nagae-Poetscher LM, Golay X, Lin D, Pomper M, van Zijl PCM. Routine clinical brain MRI sequences for use at 3.0 Tesla. J. Magn. Reson. Imaging 2005;22:13–22 doi: 10.1002/jmri.20356.
17. Terpstra M, Cheong I, Lyu, Tianmeng L, et al. Test-retest reproducibility of neurochemical profiles with short-echo, single voxel MRS at 3T and 7T. Magn Reson Med 2016;76:1083–1091 doi: 10.1016/j.physbeh.2017.03.040.
18. Deelchand DK, Adanyeguh IM, Emir, U E, et al. Two-site reproducibility of cerebellar and brainstem neurochemical profiles with short-echo, single voxel MRS at 3 T. Magn Reson Med 2015;73:1718–1725 doi: 10.1016/j.physbeh.2017.03.040.
19. Ernst T, Kreis R, Ross BD. Absolute Quantitation of Water and Metabolites in the Human Brain. I. Compartments and Water. J. Magn. Reson. Ser. B 1993;102:1–8 doi: 10.1006/jmrb.1993.1055.
20. Mlynarik V, Gruber S, Moser E. Proton T1 and T2 relaxation times of human brain metabolites at 3 Tesla. NMR Biomed. 2001;14:325–331 doi: 10.1002/nbm.713.
21. Wyss PO, Bianchini C, Scheidegger M, et al. In vivo estimation of transverse relaxation time constant (T 2 ) of 17 human brain metabolites at 3T. Magn. Reson. Med. 2018;80:452–461 doi: 10.1002/mrm.27067.
22. Allaïli N, Valabrègue R, Auerbach EJ, et al. Single-voxel 1 H spectroscopy in the human hippocampus at 3 T using the LASER sequence: characterization of neurochemical profile and reproducibility. NMR Biomed. 2015;28:1209–1217 doi: 10.1002/nbm.3364.
23. Wyss PO, Huber E, Curt A, Kollias S, Freund P, Henning A. MR Spectroscopy of the Cervical Spinal Cord in Chronic Spinal Cord Injury. Radiology 2019:181037 doi: 10.1148/radiol.2018181037.
Figures