2035
Adapted Microscopy Estimation of Axon Diameters for Diffusion MRI Comparison1Neuropsychology, Max Planck Institute for Human Cognitive and Brain Sciences, Leipzig, Germany
Synopsis
The quantification of axon diameter from electron microscopy (EM) images requires a choice of heuristics to approximate the dimensions. This choice impacts the resulting size distributions and should be adapted to the task. In diffusion MRI, complex shapes are encoded based on their directional mean squared displacement. We compute diffusion-specific ground truth diameters using Monte-Carlo simulations and evaluate typical choices of EM image analysis heuristics against them. Further, we propose a new and simple heuristic based on the mean square displacement inside an ellipse to compute better axon diameter quantifications from electron microscopy.
Introduction
The feasibility of axonal diameter quantification using dMRI is a debated subject1. Even in situations where it might be physically possible (large axons, high resolution ex-vivo data), a ground truth against which to validate dMRI results is still missing. Electron microscopy (EM) is able to distinguish individual axons on small tissue samples, making it an ideal candidate for quantitative comparisons. However, current methods for axon diameter estimation from EM images are based on heuristics - each differently affected by the axon shape. In this work, we utilize manually labeled EM data from the White Matter Microscopy Database2,3 and 2D Monte-Carlo diffusion simulations (MC) to compute model-agnostic ground truth distributions of axon diameters for dMRI. We use this to evaluate EM heuristics, as well as a here suggested diffusion-based heuristic.Methods
Our experiments were performed using the manually labeled datasets used to train AxonDeepSeg3,4. Overall, the data covered three orders of magnitude in resolution (from 2.36 nm to 180 nm) and comprises 6318 axons, measured by transmission electron microscopy (TEM) (mice brain, Striatum and Splenium5) and 6453 axons measured by electron microscopy (SEM) (rats spinal cord, cervical) (Fig.1).We reconstructed the smoothed contour of each axon by computing an alpha-shape6 (concave hull) from the segmented intra-axonal masks. We estimated axon diameter using the following commonly employed heuristics7: equivalent-perimeter, equivalent-area, biggest inscribed-circle, smallest enclosing-circle8 and, long- and short-axis of fitted ellipse to the contour (Fig.2). Further, we propose a new diffusion-specific heuristic: the diameter corresponding to the mean squared displacement (MSD) inside the fitted ellipse to the contour. For an ellipse with axis lengths $$$2a$$$ and $$$2b$$$, we compute a theoretical 2D MSD of $$$\frac{a^2+b^2}{4}$$$, which correspond to a diameter of $$$\sqrt{8\text{MSD}}=\sqrt{2(a^2+b^2)}$$$.
$$\text{MSD}=\frac{1}{ab\pi}\int_{p^{\prime}\in A}\left(\frac{1}{ab\pi}\int_{p\in A}(p-p^{\prime})^2\,dA\right)\,dA=\frac{a^2+b^2}{4}\,\,\,\text{with}\,\,A=\left\{(x, y)\,\Big|\,\frac{x^2}{a^2}+\frac{y^2}{b^2}\le 1\right\}$$
We computed the diffusion-specific ground-truth for each axon as the diameter corresponding to the average directional-MSD. We performed Monte-Carlo diffusion simulations using a 2D lattice created from the segmented axon mask interpolated to a resolution at worst 100 nm. The simulation timesteps were adjusted to correspond to an intra-axonal water diffusivity of 0.66 $$$\mu$$$m$$$^2$$$/ms to emulate fixed tissue properties. We computed the MSD time curves from the MC trajectories for orientations spanning the half-circle and estimated the MSD limit as the mean MSD for the last 5 ms of each curve (Fig.2). The ground truth MC diameter was the diameter corresponding to the mean MSD $$$d_{\text{MC}}=\sqrt{(8\overline{\text{MSD}})}$$$.
Results
Fig.3 shows the axon count distribution for each heuristic and the MC-based ground-truth for the aggregated TEM and SEM datasets. Fig.4 shows the average error metrics for both aggregated datasets for each heuristics. We computed the mean absolute deviation (MAD) and mean squared error (MSE) between each diameter estimation and the MC ground-truth. We also reported error metrics over the distributions; the MAD and MSE between the histograms computed with bin size of 50 nm and the earth-mover distance (EMD). Finally, we report the percentage error of the estimated effective diameter9,10 for each distribution. In the case of high resolution TEM, the proposed MSD-ellipse method outperformed every other heuristic for every error metric. As expected, the inscribed- and enclosing-circle acted as lower and upper bound over the full axon shape and performed poorly. The perimeter and area heuristics perform well. However, visual inspection of the distribution revealed that perimeter tended to overestimate while area underestimated axon sizes. On the SEM datasets, the proposed method tended toward underestimation and was outperformed by the perimeter method and/or the ellipse long-axis everywhere except for the effective diameter estimation. Overall, the results between metrics are closer than for TEM, except for the heavily underestimating methods of inscribed-circle and ellipse short-axis. We suspect this to be a consequence of our axon contour definition from the centers of pixels. This tends to "erode" up to half a voxel on the outer edge of the shape, which can be significant at the resolution of SEM (Fig.5). However, solving this problem involves injecting boundary smoothness prior in the form of some elastic boundary estimation which might then overestimate.Discussion
In this work, we assessed the impact of image analysis heuristics on diffusion specific descriptions of axonal shape. Hence, we believe the results to be relevant for human brains, even if they were computed from rodent brains and spinal cords. One important aspect of translating microscopy axon diameter for dMRI is the assumption that our 2D planes are perpendicularly slicing the axons. The ellipse short-axis and inscribed-circle heuristic were previously used to correct for this effect11,12, as they correspond to the real un-tilted diameter under cylindrical axon assumption. We do not attempt to account for this effect but a similar MC approach with 3D EM data might be utilized in the future.Conclusion
In conclusion, we've shown the impact of common heuristics on the computed axon diameter distribution. If the end-goal is to compare the distribution to dMRI, it is recommended to use a MSD "flavored" method such as the proposed one. The MC MSD based diameter distribution is the most "model-agnostic" dMRI distribution, as it fundamentally corresponds to the way diffusion encodes shapes and sizes before any sequence or model particularities apply.Acknowledgements
MP is supported by the SPP2041 program "Computational Connectomics" of the German Research Foundation (DFG).
References
1. Paquette, M., et al., "Axon Diameter Measurements using Diffusion MRI are Infeasible", bioRxiv, 2020, https://doi.org/10.1101/2020.10.01.320507.
2. White Matter Microscopy Database, https://osf.io/yp4qg/
3. AxonDeepSeg, https://osf.io/bj9eu/
4. Zaimi, A., et al., "AxonDeepSeg: automatic axon and myelin segmentation from microscopy data using convolutional neural networks". Sci Rep, 2018.
5. Jelescu, I.O., et al., "In vivo quantification of demyelination and recovery using compartment-specific diffusion MRI metrics validated by electron microscopy", Neuroimage, 2016.
6. Edelsbrunner, H., et al., "On the shape of a set of points in the plane", IEEE Transactions on Information Theory, 1983.
7. Lee, H.H., et al., "Along-axon diameter variation and axonal orientation dispersion revealed with 3D electron microscopy: implications for quantifying brain white matter microstructure with histology and diffusion MRI", Brain structure & function, 2019.
8. Skyum, S., "A simple algorithm for computing the smallest enclosing circle", Information Processing Letters, 1991.
9. Burcaw, L.M., et al. "Mesoscopic structure of neuronal tracts from time-dependent diffusion", NeuroImage, 2015.
10. Veraart, J., et al., "Noninvasive quantification of axon radii using diffusion MRI", eLife, 2020.
11. Aboitiz, F., et al., "Fiber composition of the human corpus callosum", Brain Research, 1992.
12. Liewald, D., et al., "Distribution of axon diameters in cortical white matter: an electron-microscopic study on three human brains and a macaque.", Biological Cybernetics, 2014.
Figures
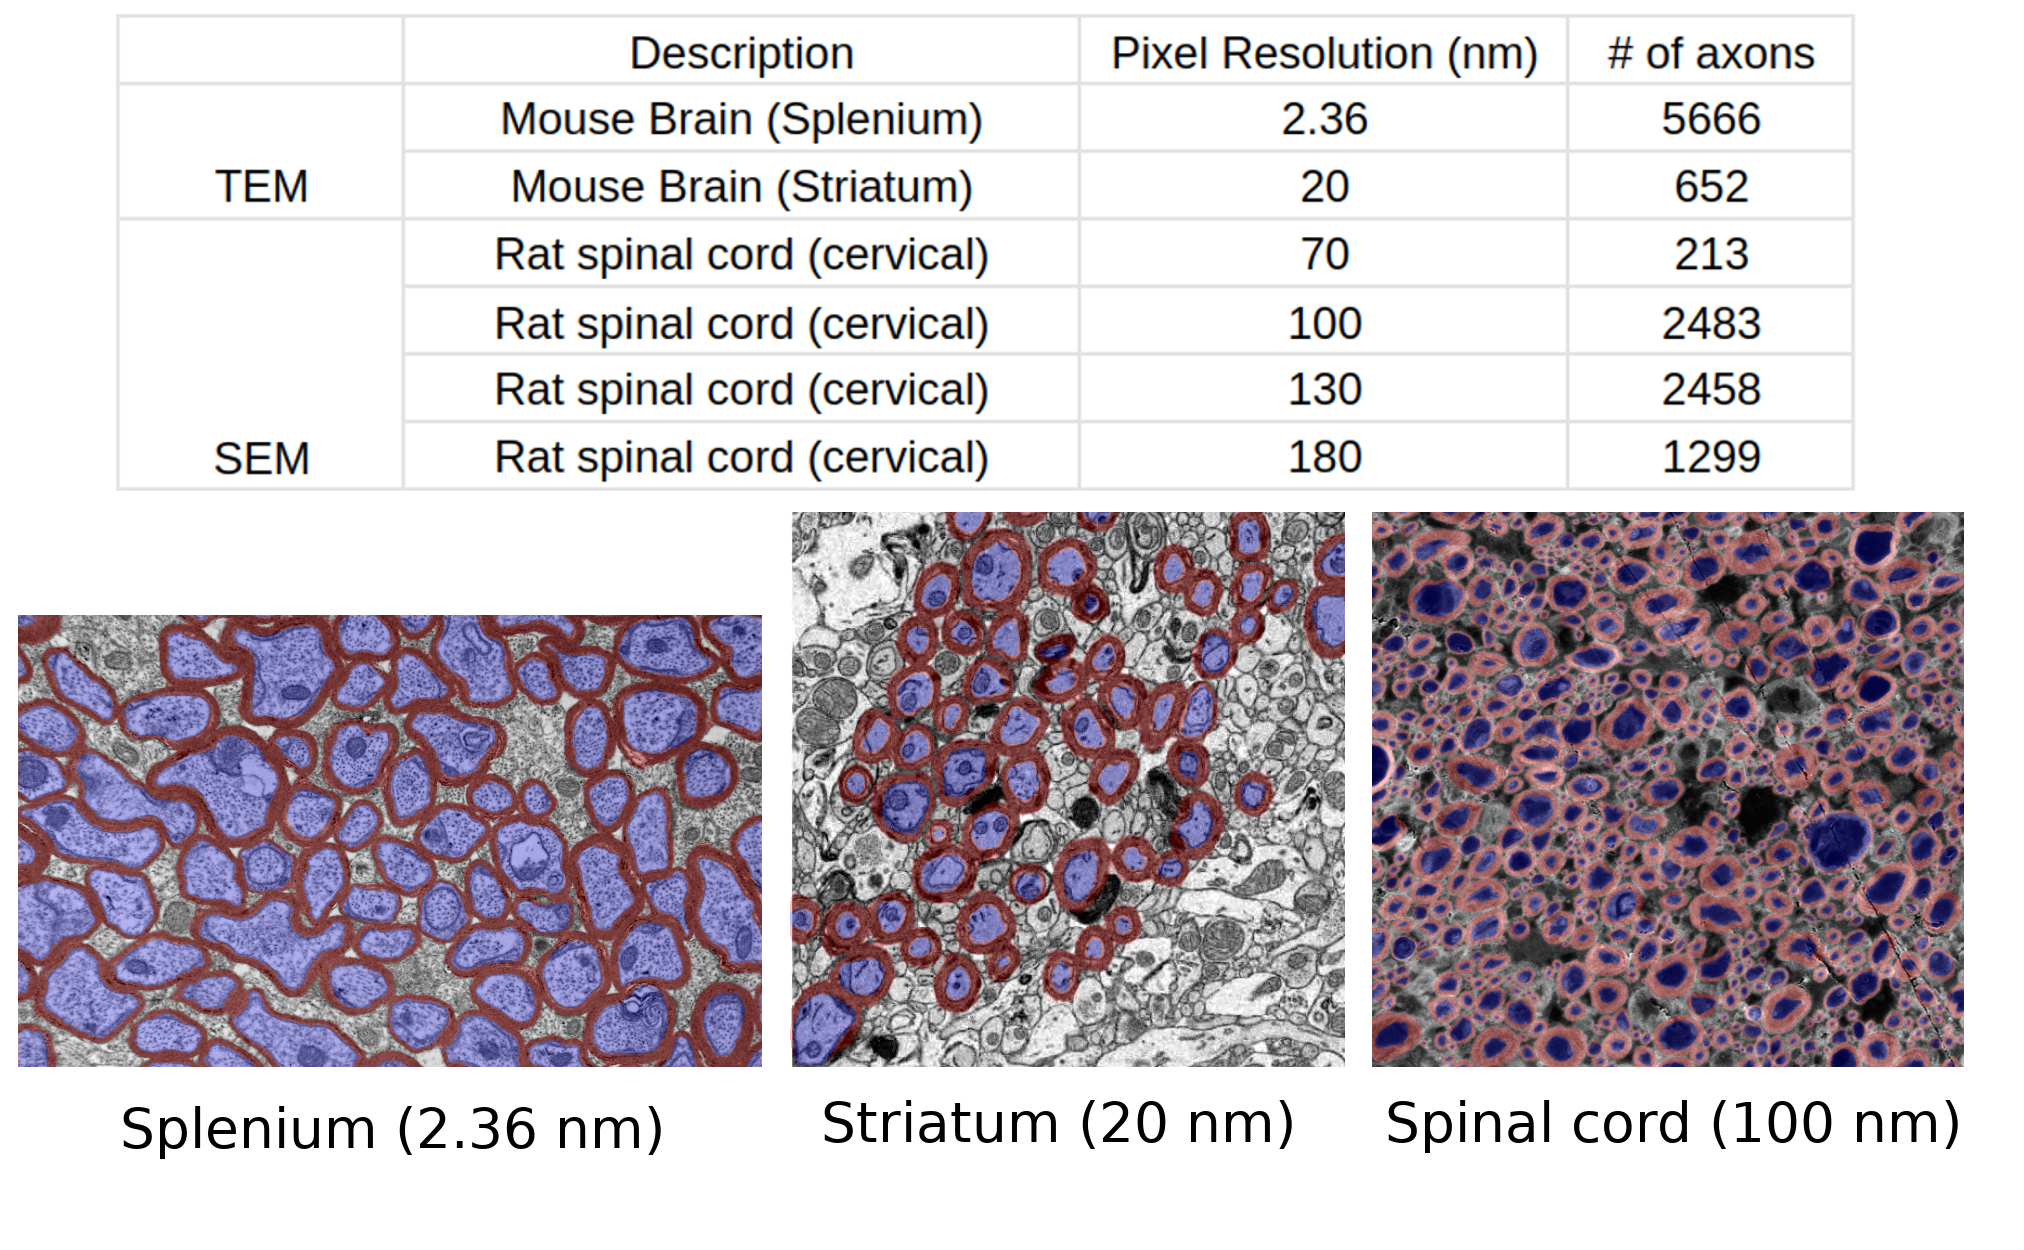
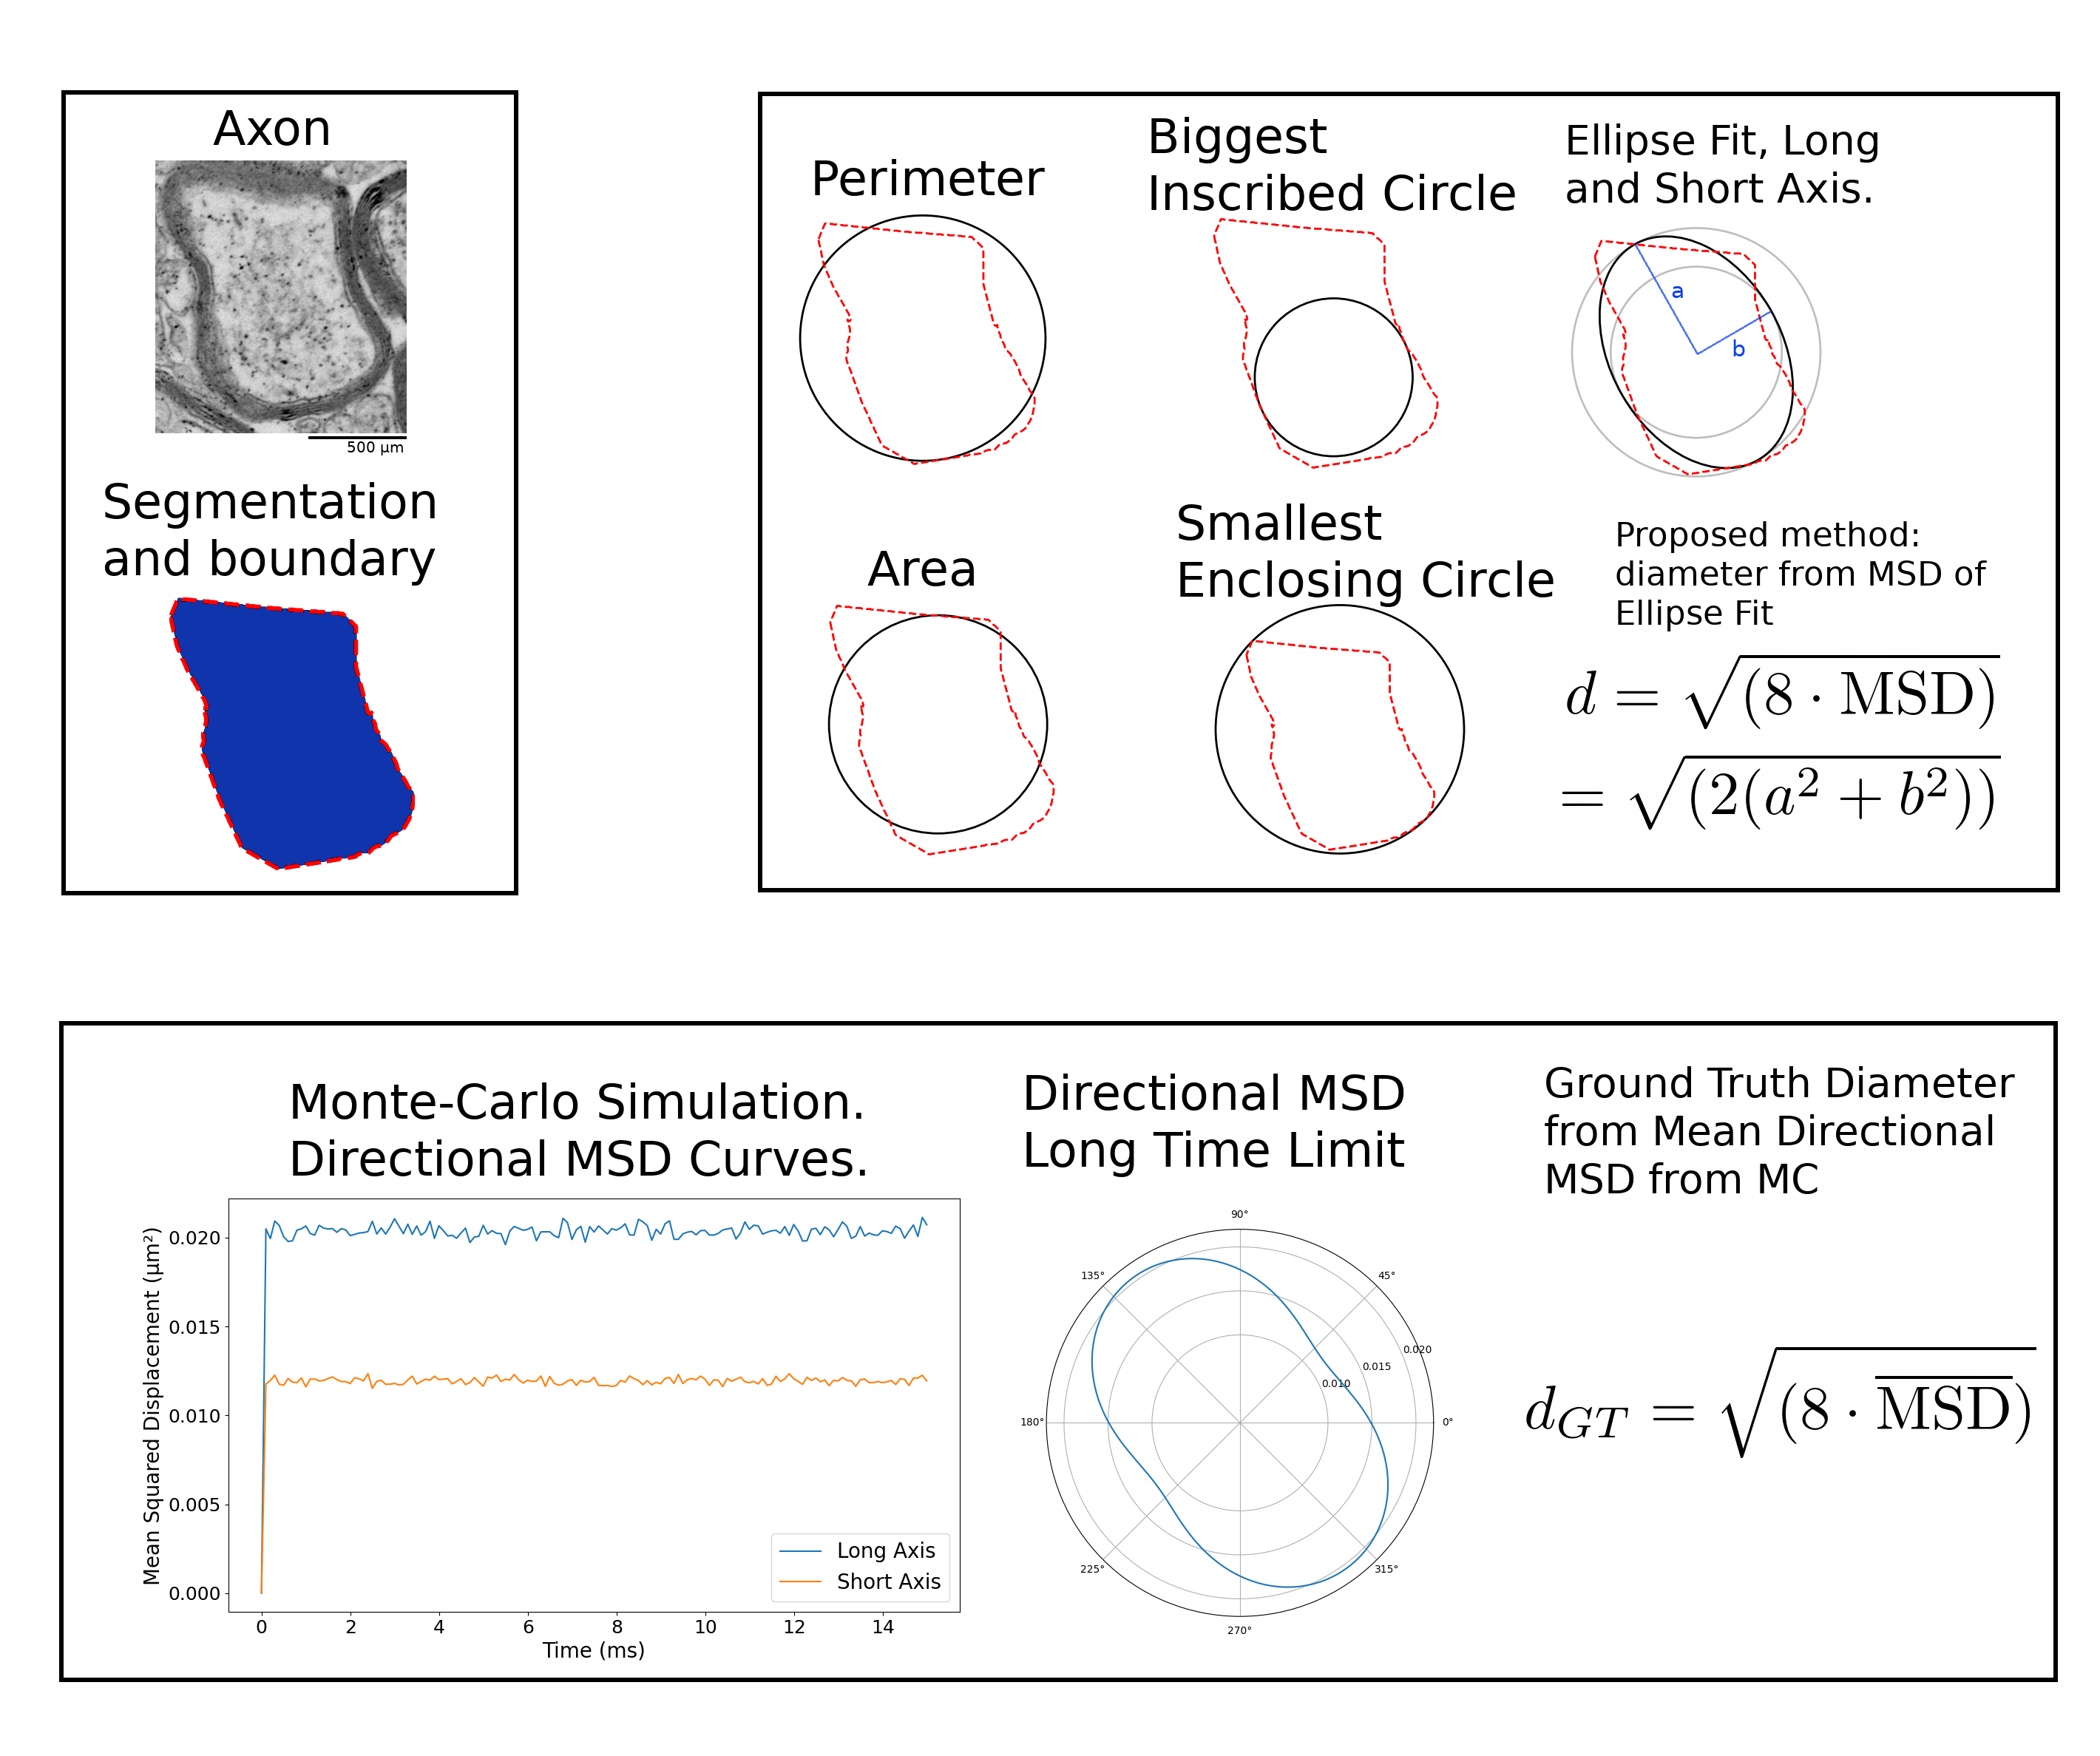
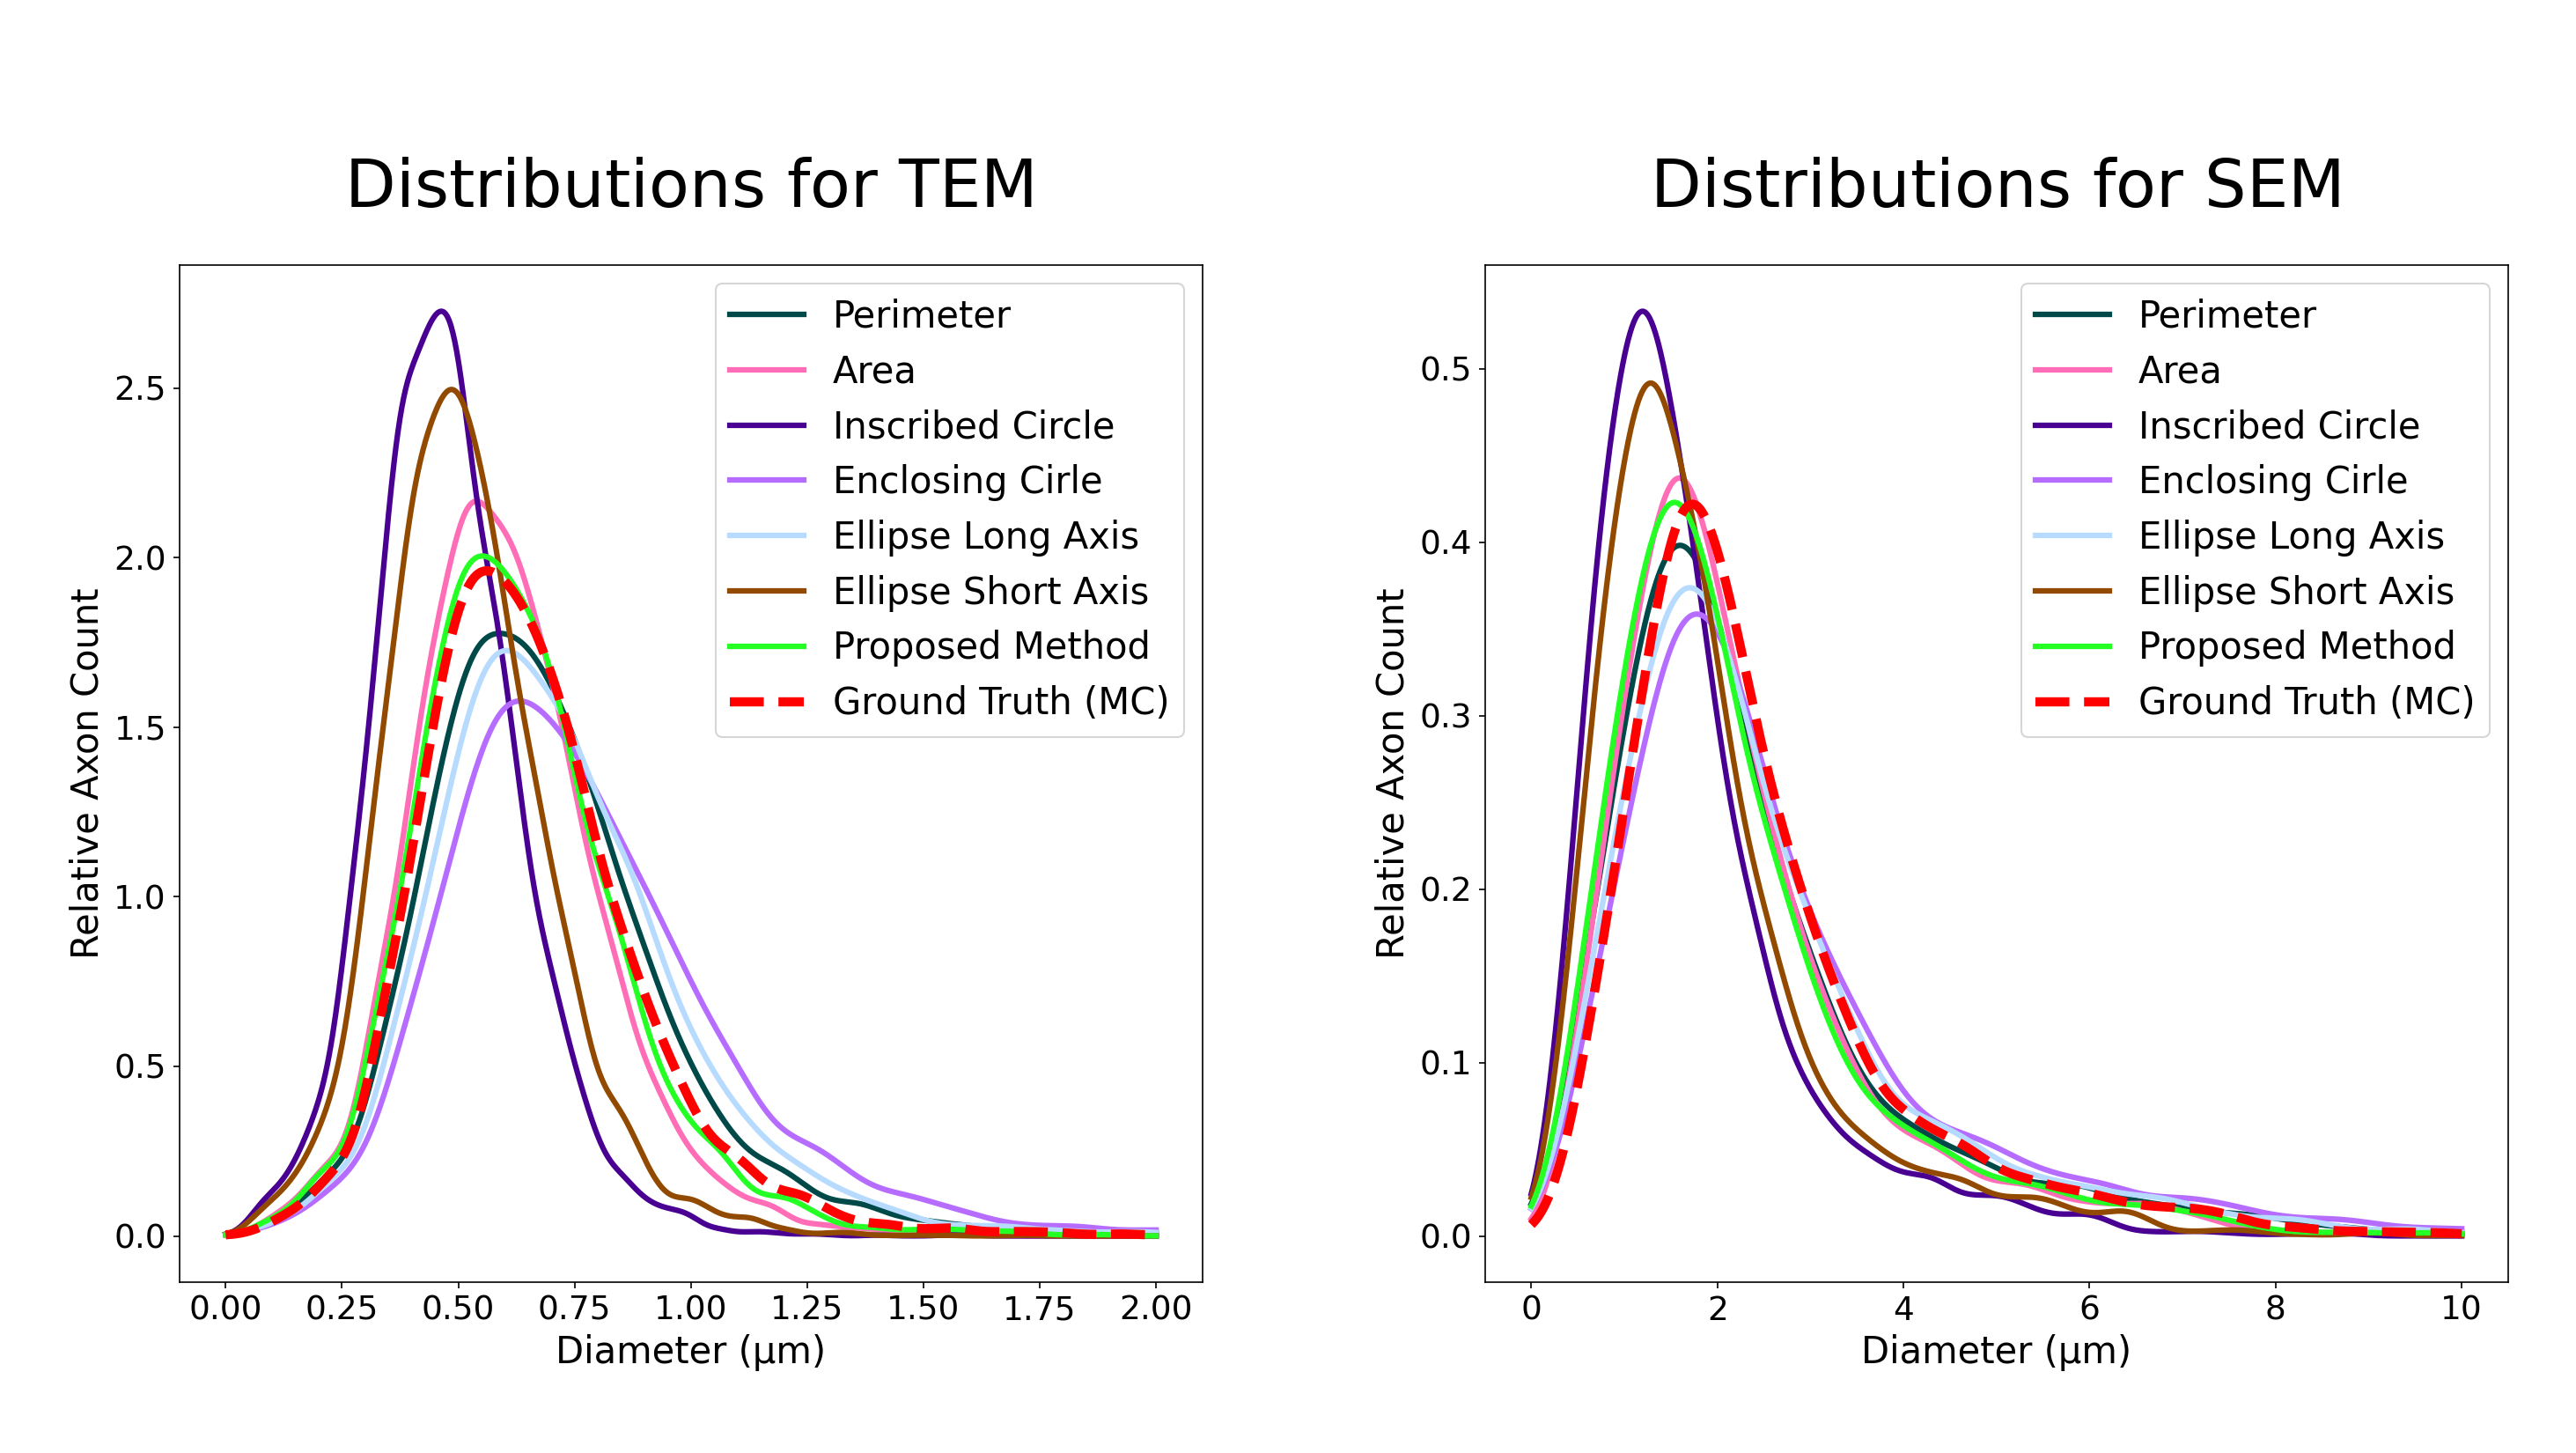

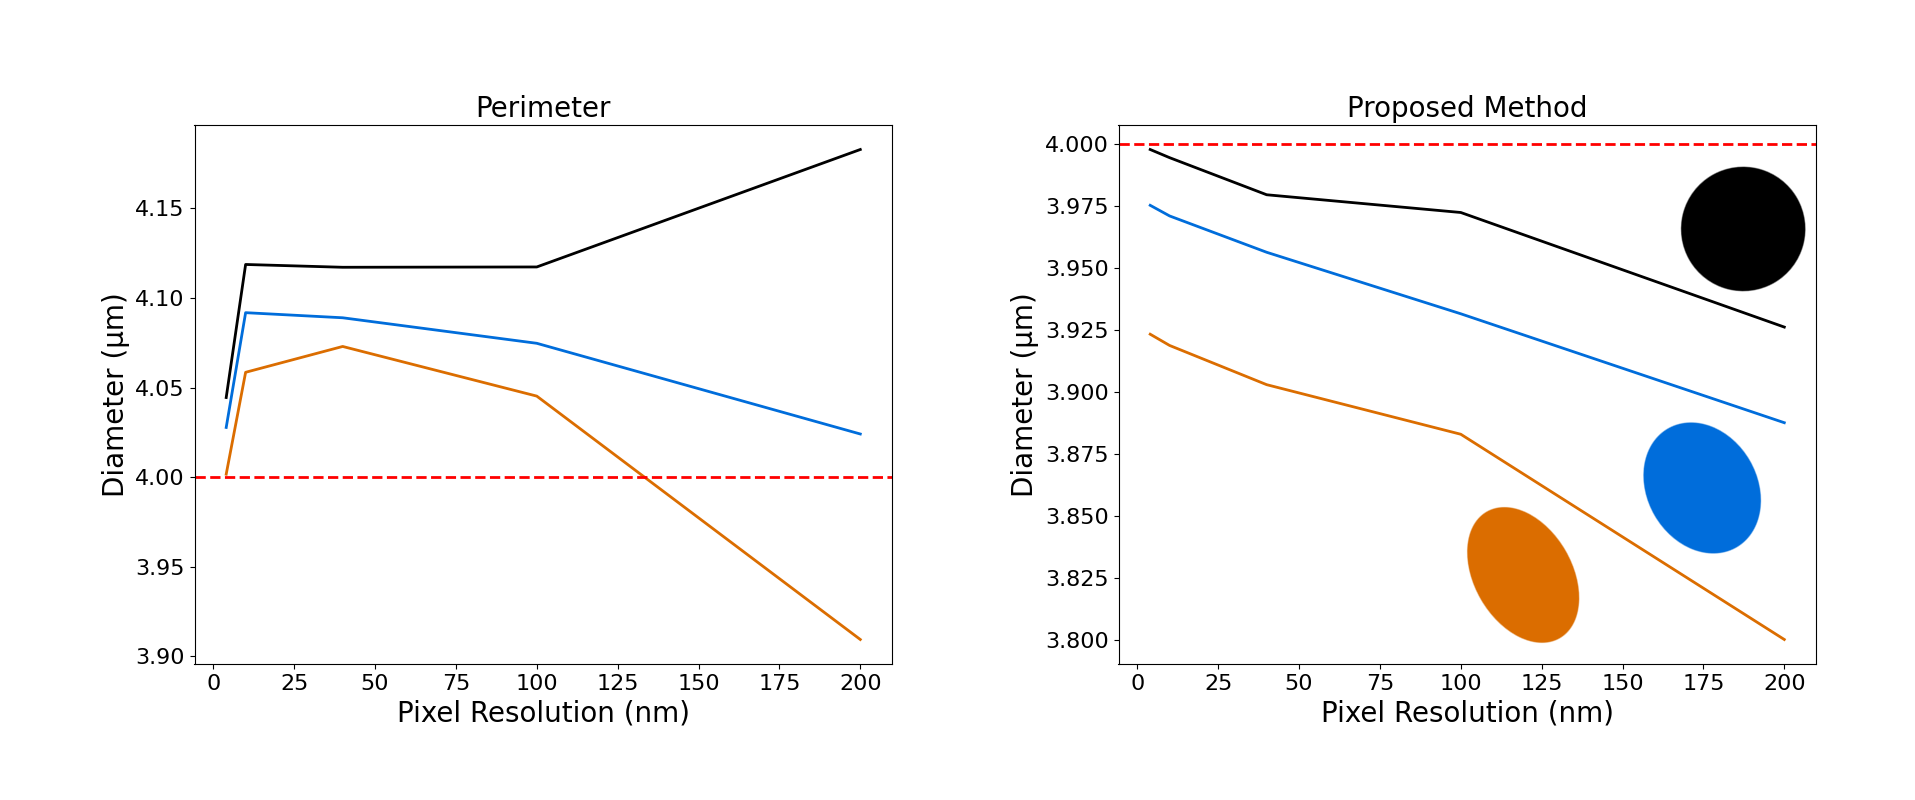
Figure 5: Impact of the resolution for the perimeter heuristic and proposed method. We generated three elliptical "axons'' with long over short axis ratios of 1, 1.25 and 1.5 (colored glyphs matching the curves). All the ellipses produce a diameter of 4 μm when using the analytical ellipse MSD method (red). The masks were generated with pixel resolution from 4 nm to 200 nm. Since the contours are estimated from the pixel's center, the proposed method slightly underestimates the diameters while the perimeter heuristic oscillates as the resolution and ellipse eccentricity change.