2013
The effect of basis sets on the analysis of in vivo brain MRS data obtained with standard PRESS sequences1Department of Biomedical Engineering, Columbia University, New York City, NY, United States, 2Department of Psychiatry, Columbia University College of Physicians and Surgeons, New York City, NY, United States, 3New York State Psychiatric Institute, New York City, NY, United States, 4Department of Radiology, Columbia University Medical Center, New York City, NY, United States, 5Weill Cornell Medicine, New York City, NY, United States, 6Laboratory of Experimental Psychiatry, Instituto Nacional de Neurología y Neurocirugía, Mexico City, Mexico, 7Department of Neuropsychiatry, Instituto Nacional de Neurología y Neurocirugía, Mexico City, Mexico
Synopsis
Point resolved spectroscopy sequence (PRESS) is the most commonly used sequence for in vivo magnetic resonance spectroscopy. While implemented by all major vendors, implementation details like timings, durations and shapes of the RF pulses differ among them. Here, we investigate the impact that inappropriate basis information can have on MRS metabolite quantification with linear combination modeling for quantification.
Introduction
Point resolved spectroscopy sequence (PRESS)1 is the most commonly used sequence for in vivo magnetic resonance spectroscopy. While implemented by all major vendors (i.e., Siemens, Philips and General Electric (GE)), implementation details like exact timings, durations and shapes of the RF pulses differ among them2,3. Thus, a PRESS acquisition with echo time (TE) of 35 ms from one vendor may be similar but not identical to that from another. Here, we investigate the impact that inappropriate basis information can have on MRS metabolite quantification with linear combination modeling software.Methods
Subjects & ScannersSpectra from 100 subjects obtained at the National Institute of Neurology and Neurosurgery in Mexico City were analyzed retrospectively. Of the 100 spectra, 50 were recorded with a Siemens Skyra 3 T (Siemens Healthineers, Erlangen, Germany) with a 20-channel head coil (Siemens) in medial prefrontal cortex, and the other 50 with a GE Signa Excite HDxt 3 T (GE Healthcare, Waukesha, WI) with an 8-channel head coil (GE) in the right dorsal caudate nucleus (5).
MRS Sequence
All brain spectra were measured with the vendors’ standard product PRESS sequence with TE/TR 35/2000 ms, and:
- GE: volume of interest (VOI) = 2.0x2.0x2.0 cm3 (8 mL), number of excitations (NEX) = 128, bandwidth (BW) = 5000 Hz, number of points = 4096.
- Siemens: VOI = 3.0x2.5x2.5 cm3 (19 mL), NEX = 128, BW = 2500 Hz, number of points = 4096.
The recorded spectra were fitted with the matched basis set using the correct timings, durations and shape of RF pulses, a basis set generated with the matched timings and durations, but with the hard-pulse approximation, as well as basis sets corresponding to the PRESS implementations of the same TE from the two other vendors.
Simulation of basis sets
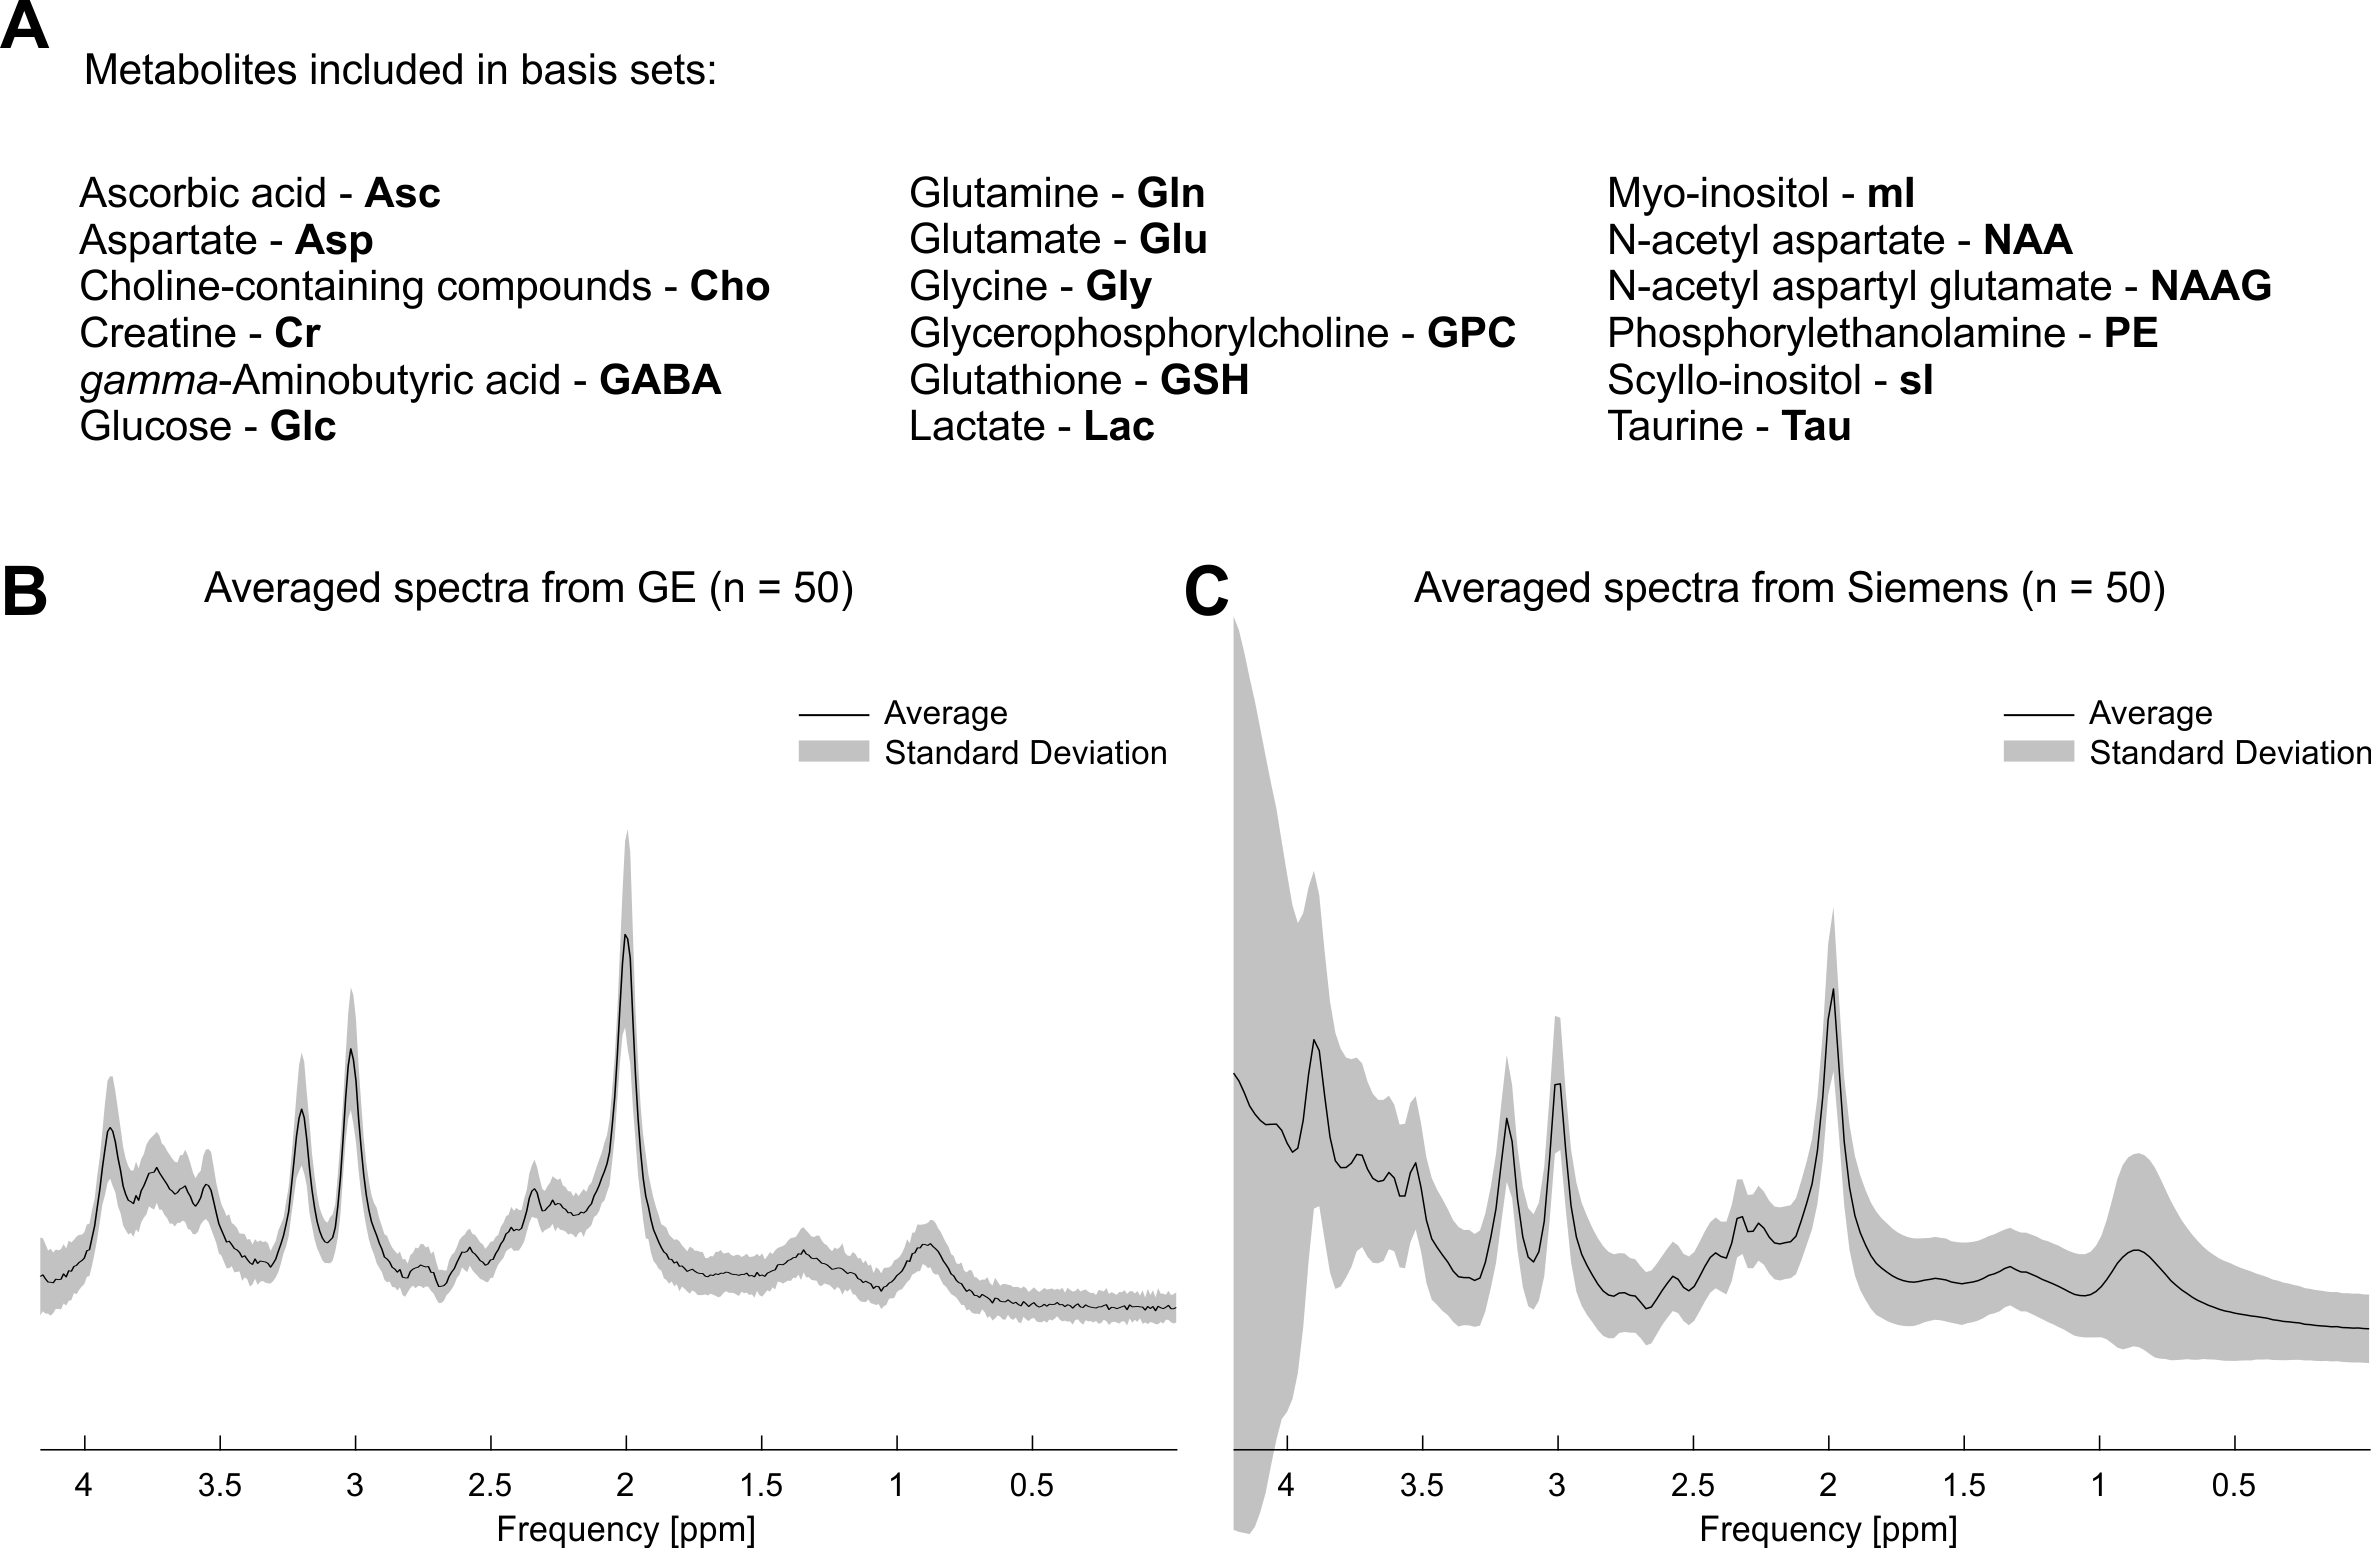
Basis sets comprising 18 metabolites (Fig. 1A), Asc, Asp, Cho, Cr, GABA, GPC, GSH, Glc, Gln, Glu, Gly, Lac, NAA, NAAG, PE, Tau, mI, and sI, were simulated with 1283 spatial points in MAgnetic Resonance Spectrum Simulator (MARSS)2,3. The hard-pulse basis sets were generated using experimental details specific to the particular vendor (i.e., Siemens for Siemens data or GE for GE data), but used only a single spatial point thereby not modeling the spatial transition bands of the RF pulses.
Analysis
Experimental spectra were processed with INSPECTOR6–9 and analyzed with LCModel4 (version 6.3-1P). Each spectrum was fitted with four different basis sets using standard .CONTROL parameters.
- GE spectra: matched GE, GE with hard pulses, Philips and Siemens.
- Siemens spectra: matched Siemens, Siemens with hard pulses, Philips and GE.
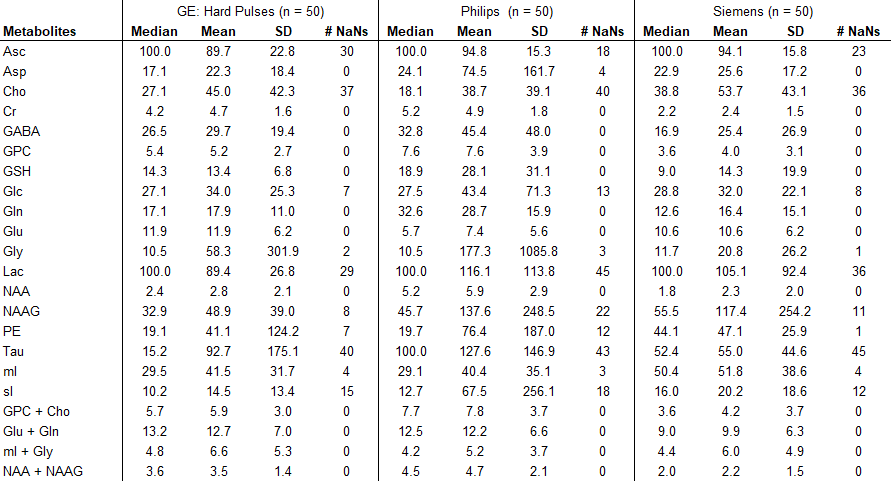
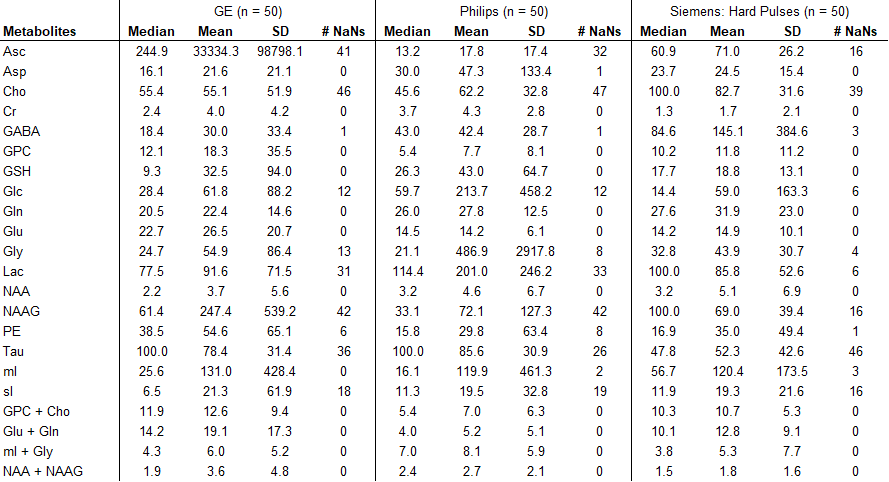
True metabolite concentrations encountered in vivo cannot be measured, thus the analysis focused on apparent concentration differences between the reference fit, which was obtained with the matched basis set, e.g. matched GE basis set for spectrum acquired with GE sequence, and the fit outcomes considering the three other conditions, i.e. GE hard pulse, Siemens, and Philips. The differences were calculated as errors relative to the matched basis fits (in percent). Median, mean, standard deviation (SD) of percent errors and number of undefined numbers due to metabolite concentrations of zero in the reference fit (# NaN) were determined for all spectral analyses.
Results & Discussion
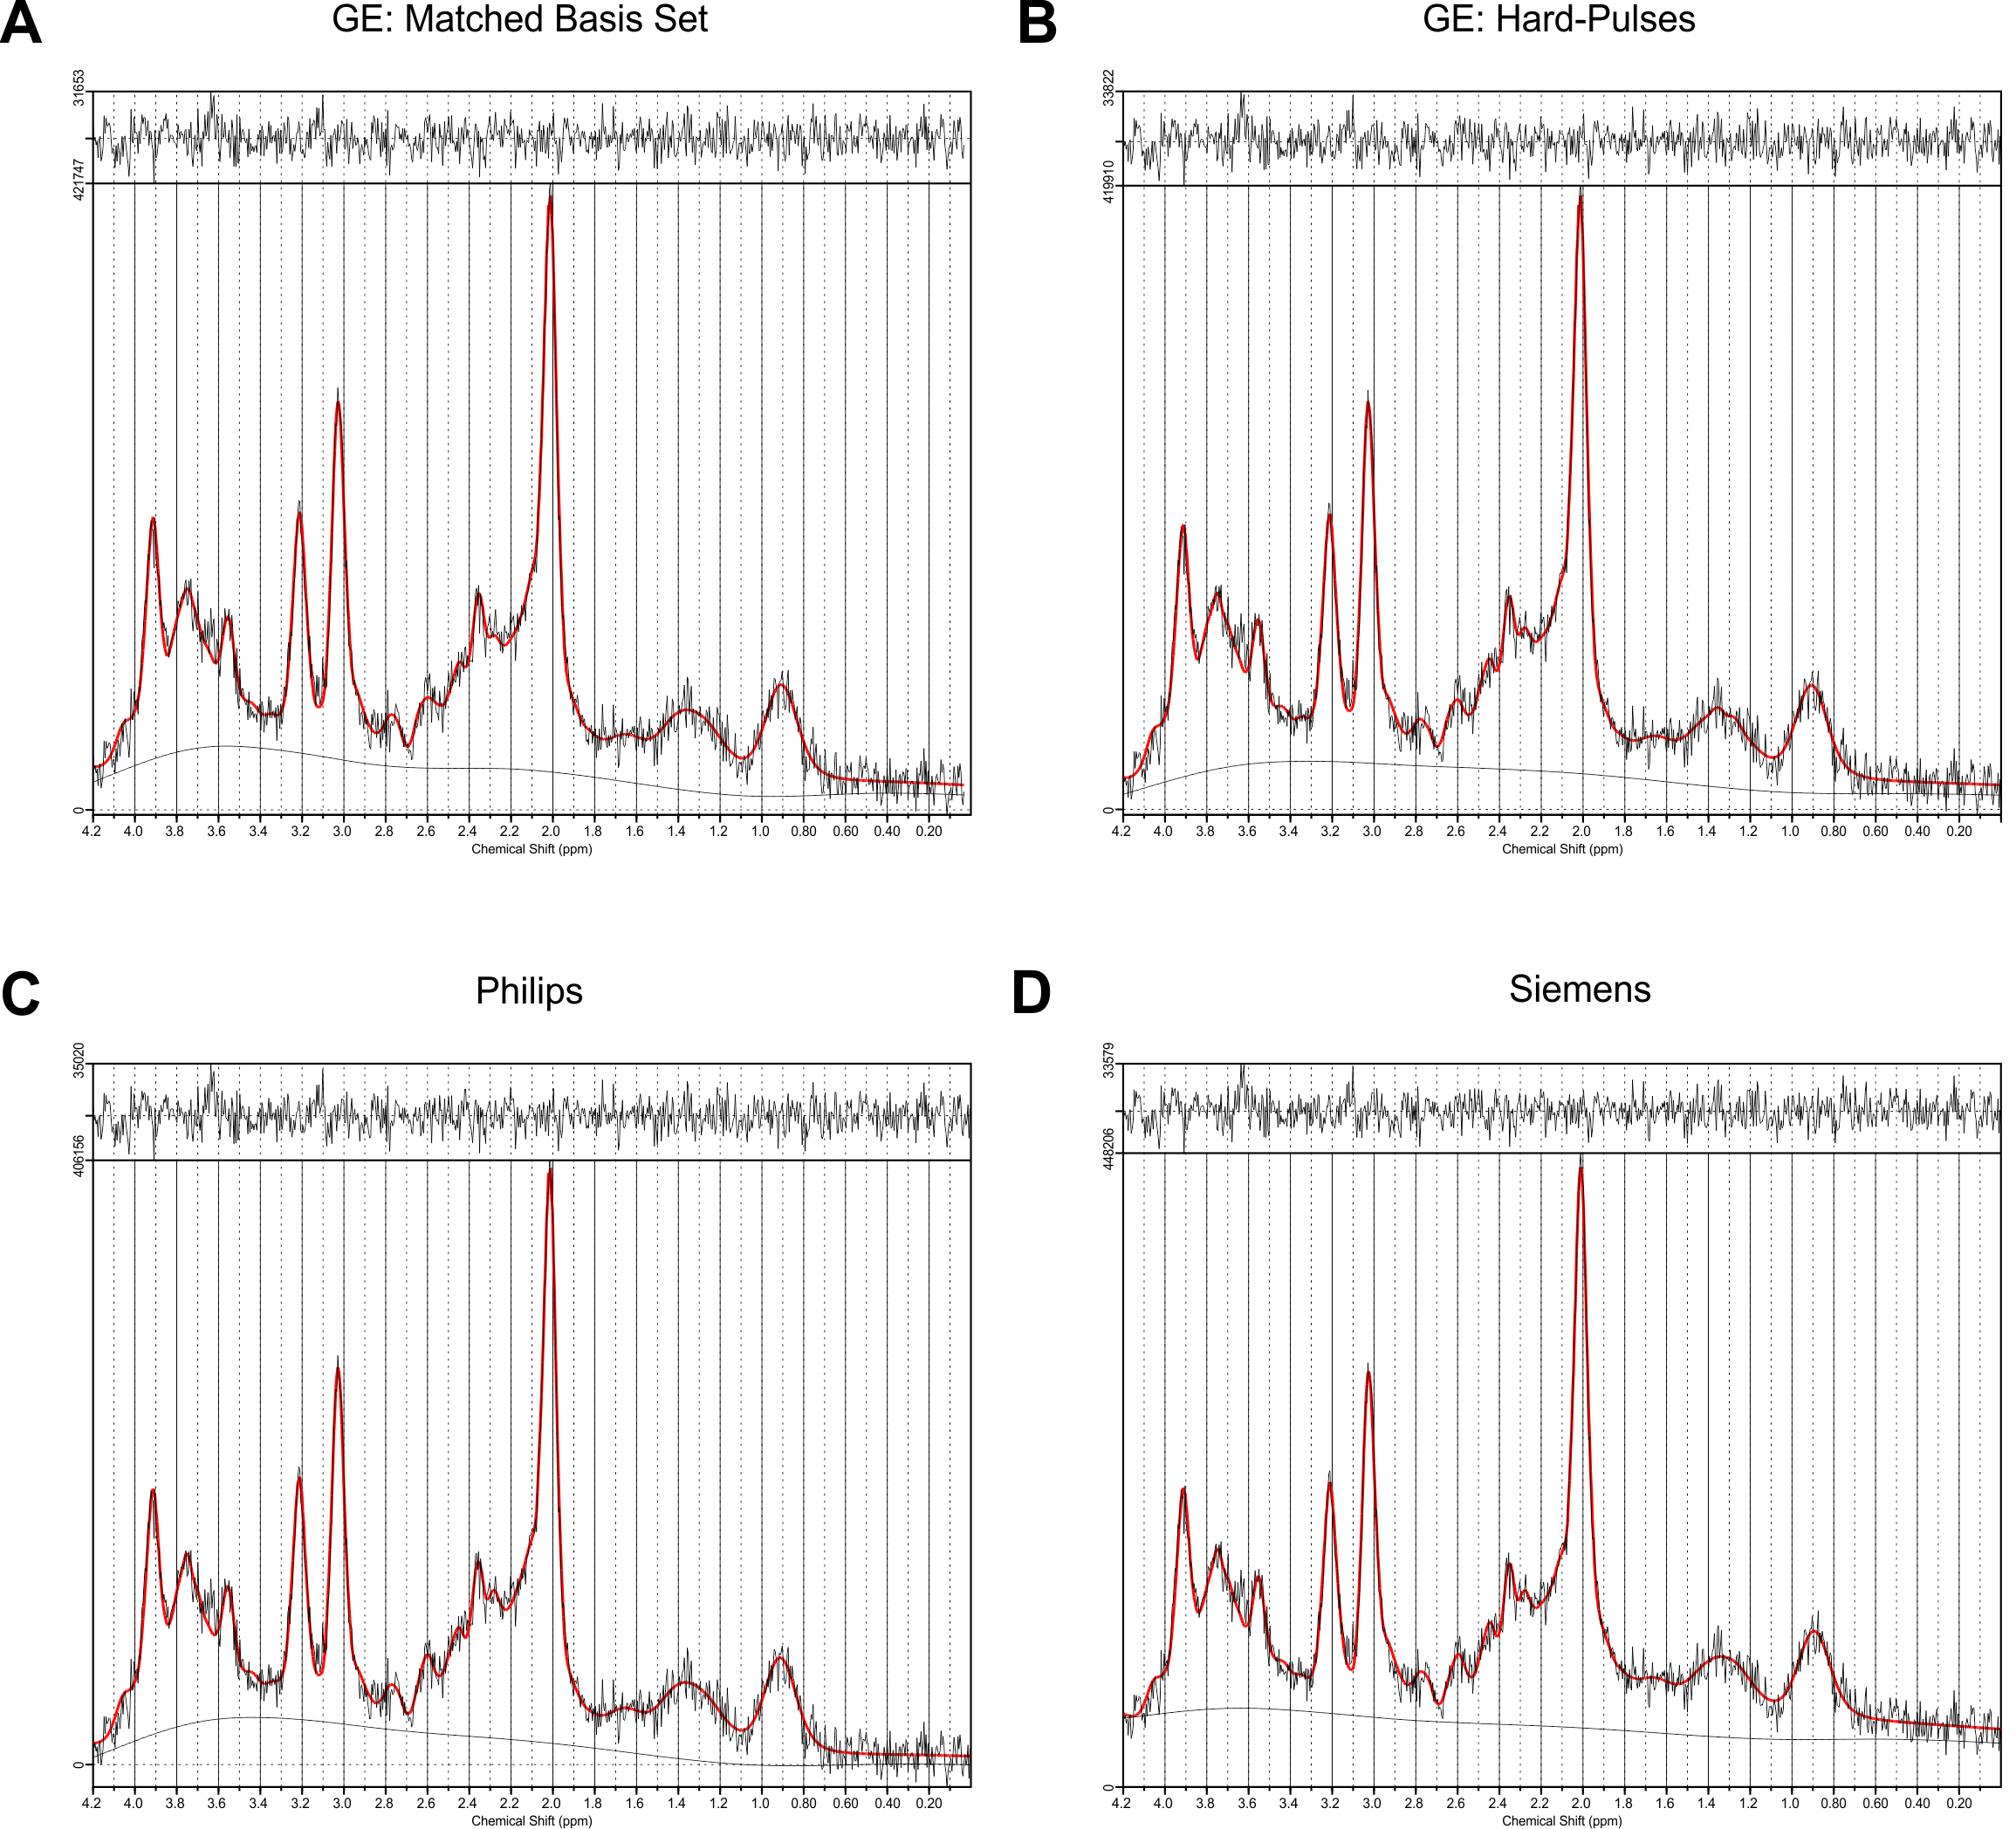
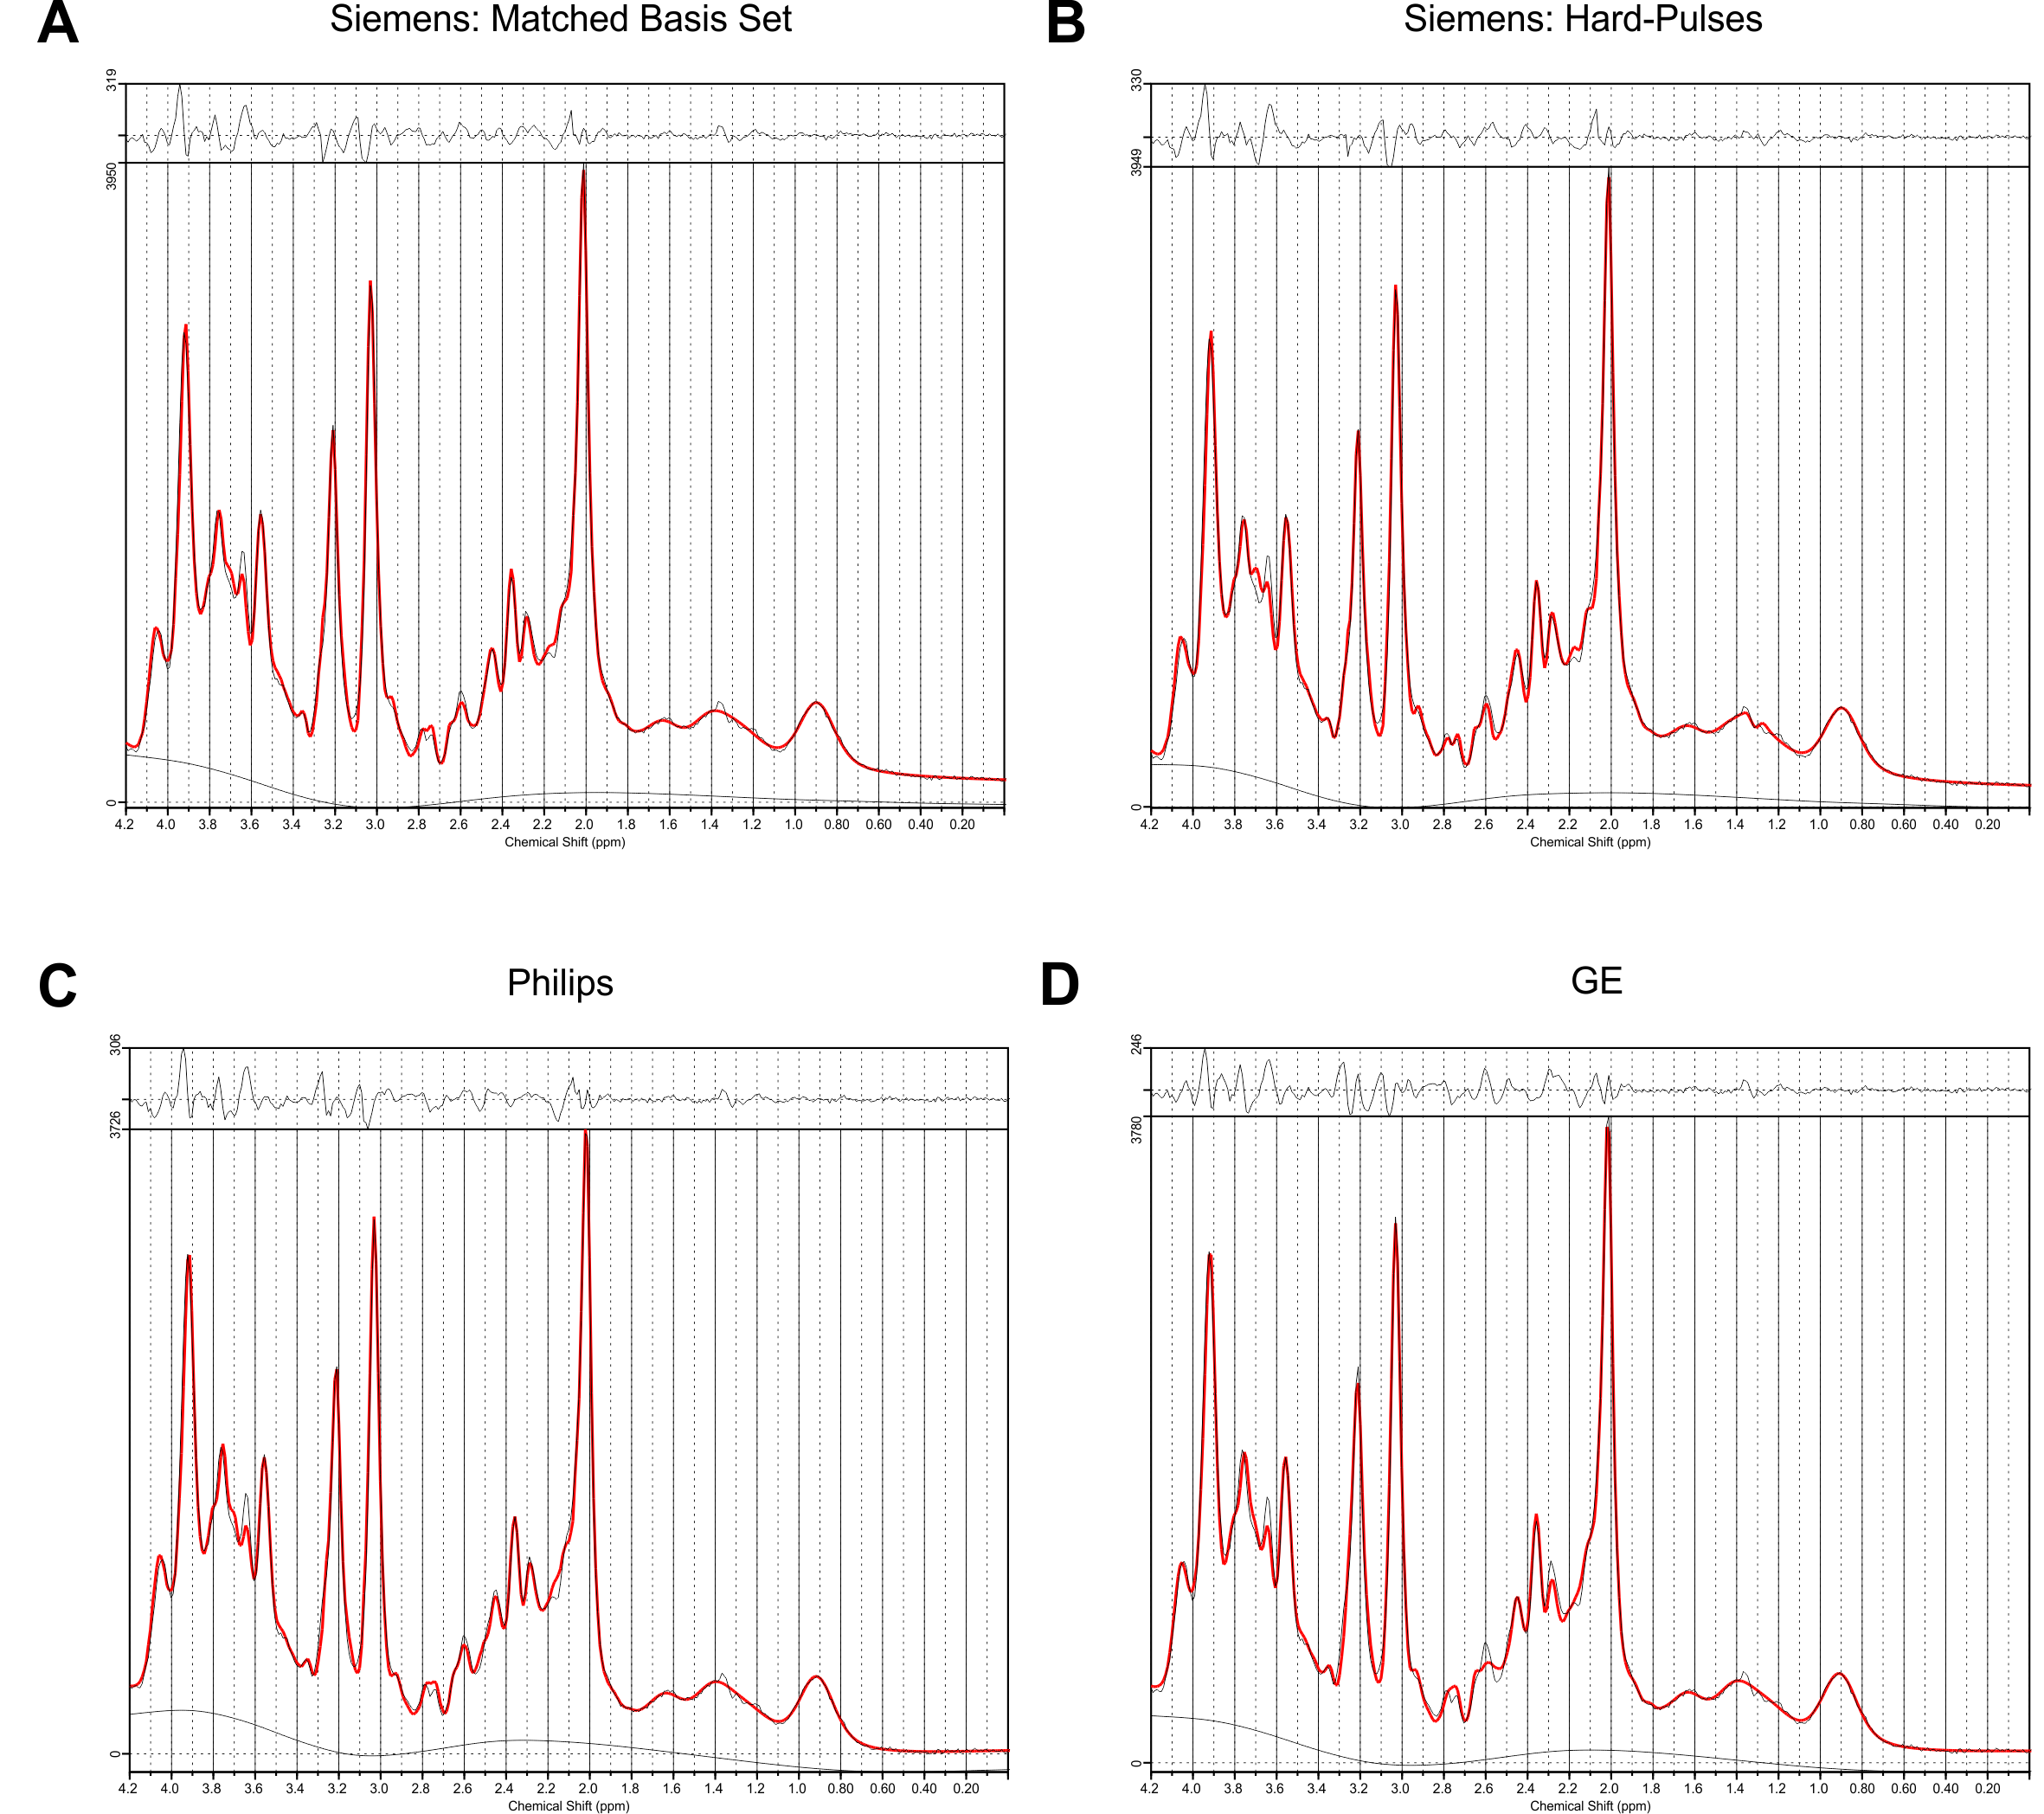
Spectral quality from all subjects measured with two different scanners is illustrated in Figure 1B & C. Illustrations of fitting an experimental PRESS spectrum with LCModel using different basis sets are depicted in Figure 2 for GE, and in Figure 3 for Siemens. The percent errors of all metabolites for GE are summarized in Table 1 and for Siemens spectra inTable 2. The mean percent errors of larger signals (e,g, NAA+NAAG, Cr) were < 5%, but in case of GPC+Cho the relative error was up to 12.6% (Table 2). In case of Glu+Gln, using the GE basis set for linear combination modeling of Siemens data resulted in a 19.1% error (Table 2). Smaller signals like GSH showed mean errors up to 43% (Table 2). Especially low-concentrated metabolites were highly susceptible to minute differences in basis sets (e.g. Asp in Table 1). Though spectra measured on the Siemens scanner had higher signal attributable to larger voxel size, the analysis showed similar errors for GE data.These results illustrate the considerable sensitivity of linear combination modeling to imperfect basis information. Systematic errors introduced with the use of inappropriate prior knowledge can largely outweigh Cramér-Rao lower bounds (CRLB)10 commonly used as statistical confidence metrics and thereby dominate the overall error of the MRS quantification.
Conclusion
Basis sets that do not use the experimentally realistic shaped RF pulses and timings, or that employ the hard-pulse approximation, can appear to produce adequate quality fits. However, the resulting metabolite levels can be substantially affected. Basis sets should be produced via simulations that match actual experimental conditions as closely as possible. Our results furthermore raise concerns about the validity of other commonly employed model assumptions and neglected error sources such as imperfect chemical shifts, J-couplings, and relaxation effects.Acknowledgements
No acknowledgement found.References
1. Bottomley PA. Spatial Localization in NMR Spectroscopy in Vivo. Ann N Y Acad Sci 1987;508:333–348.
2. Landheer K, Swanberg KM, Juchem C. Magnetic Resonance Spectrum Simulator (MARSS), A Novel Software Package for Fast and Computationally Efficient Basis Set Simulation. NMR Biomed 2019:e4129.
3. Landheer K, Juchem C. Magnetic Resonance Spectrum Simulator - MARSS. http://innovation.columbia.edu/technologies/CU19215_MARSS.
4. Provencher SW. Estimation of metabolite concentrations from localizedin vivo proton NMR spectra. Magn. Reson. Med. 1993;30:672–679 doi: 10.1002/mrm.1910300604.
5. Plitman E, de la Fuente-Sandoval C, Reyes-Madrigal F, et al. Elevated Myo-Inositol, Choline, and Glutamate Levels in the Associative Striatum of Antipsychotic-Naive Patients With First-Episode Psychosis: A Proton Magnetic Resonance Spectroscopy Study With Implications for Glial Dysfunction. Schizophr. Bull. 2016;42:415–424 doi: 10.1093/schbul/sbv118.
6. Juchem C. INSPECTOR: Magnetic resonance spectroscopy software for optimized data extraction. innovation.columbia.edu/technologies/cu17130_inspector. Published 2020.
7. Juchem C. INSPECTOR: “The New Kid on the Block.” ISMRM Virtual Study Group Meeting - MR Spectroscopy. https://ismrm.adobeconnect.com/_a1156337412/pvzkfszv1l4s/. Published 2017.
8. Prinsen H, de Graaf RA, Mason GF, Pelletier D, Juchem C. Reproducibility measurement of glutathione, GABA, and glutamate: Towards in vivo neurochemical profiling of multiple sclerosis with MR spectroscopy at 7T. J. Magn. Reson. Imaging 2017;45:187–198 doi: 10.1002/jmri.25356.
9. Gajdošík M, Landheer K, Swanberg KM, Juchem C. INSPECTOR: Free Software for Magnetic Resonance Spectroscopy Data Inspection, Processing, Simulation and Analysis. Sci. Rep.:In revision.
10. Cavassila S, Deval S, Huegen C, van Ormondt D, Graveron-Demilly D. Cramér-Rao bounds: an evaluation tool for quantitation. NMR Biomed. 2001;14:278–283 doi: 10.1002/nbm.701.
Figures