2010
Computation of Cramér-Rao Lower Bounds (CRLB) for spectral baseline shapes1Biomedical Engineering, Columbia University School of Engineering and Applied Science, New York, NY, United States, 2Radiology, Columbia University Medical Center, New York, NY, United States
Synopsis
Cramér-Rao Lower Bounds (CRLB) are widely applied to characterize the minimum possible variance of metabolite amplitude parameters estimated by linear combination modeling. It has been argued that calculating the CRLB in the absence of baseline terms cannot adequately capture error but that the distribution of spectral baseline modeling parameters themselves cannot be sufficiently represented by this index. In this work we test the practical implications of these principles by treating baselines as linear combinations of polynomials to show that CRLB can under some circumstances offer precision estimates on spectral baseline shapes, notably to the improvement of metabolite CRLB accuracy.
Introduction
Since the rise of spectral quantification by linear combination models built upon prior knowledge functions1 the Cramér-Rao Lower Bound (CRLB)2,3 has been historically used to estimate the precision of these procedures. To correctly represent the lowest bound of standard deviation on metabolite amplitudes estimated by linear combination modeling (LCM), CRLBs must be calculated from an information matrix that represents a complete fit model3; in line with this, previous results suggest that metabolite amplitude CRLBs are significantly affected by accommodations for the spectral baselines often necessary for reliable quantification4-7.Given some measure of uncertainty surrounding the simulated or measured lineshapes used for metabolite bases, as well as the routine use of constraints in the fit procedures of not only baselines but also metabolites for which CRLBs are nonetheless routinely employed, the difference in both the integrity and flexibility of models underpinning metabolite and baseline shapes, and therefore CRLB estimates for fit parameters thereof, is a matter of degree and not a binary state. It is therefore important to empirically address the extent to which CRLBs may be used to inform precision estimates surrounding baseline models themselves both because some manner of including baseline terms in CRLB calculations may improve estimates of metabolite CRLBs as previously suggested and because understanding the validity of a baseline modeling approach can itself influence metabolite quantification precision and accuracy8,9.
In this work we treat baselines as overlapping piecewise polynomial shapes akin to metabolite basis functions in order to include them in the Fisher information matrix for calculation of CRLBs on their amplitudes. We thereby assess the degree to which these and metabolite amplitude CRLBs represent the standard deviations of corresponding parameter estimates in fully determined spectral fits including heavily overlapping polynomial or spline baselines.
Methods
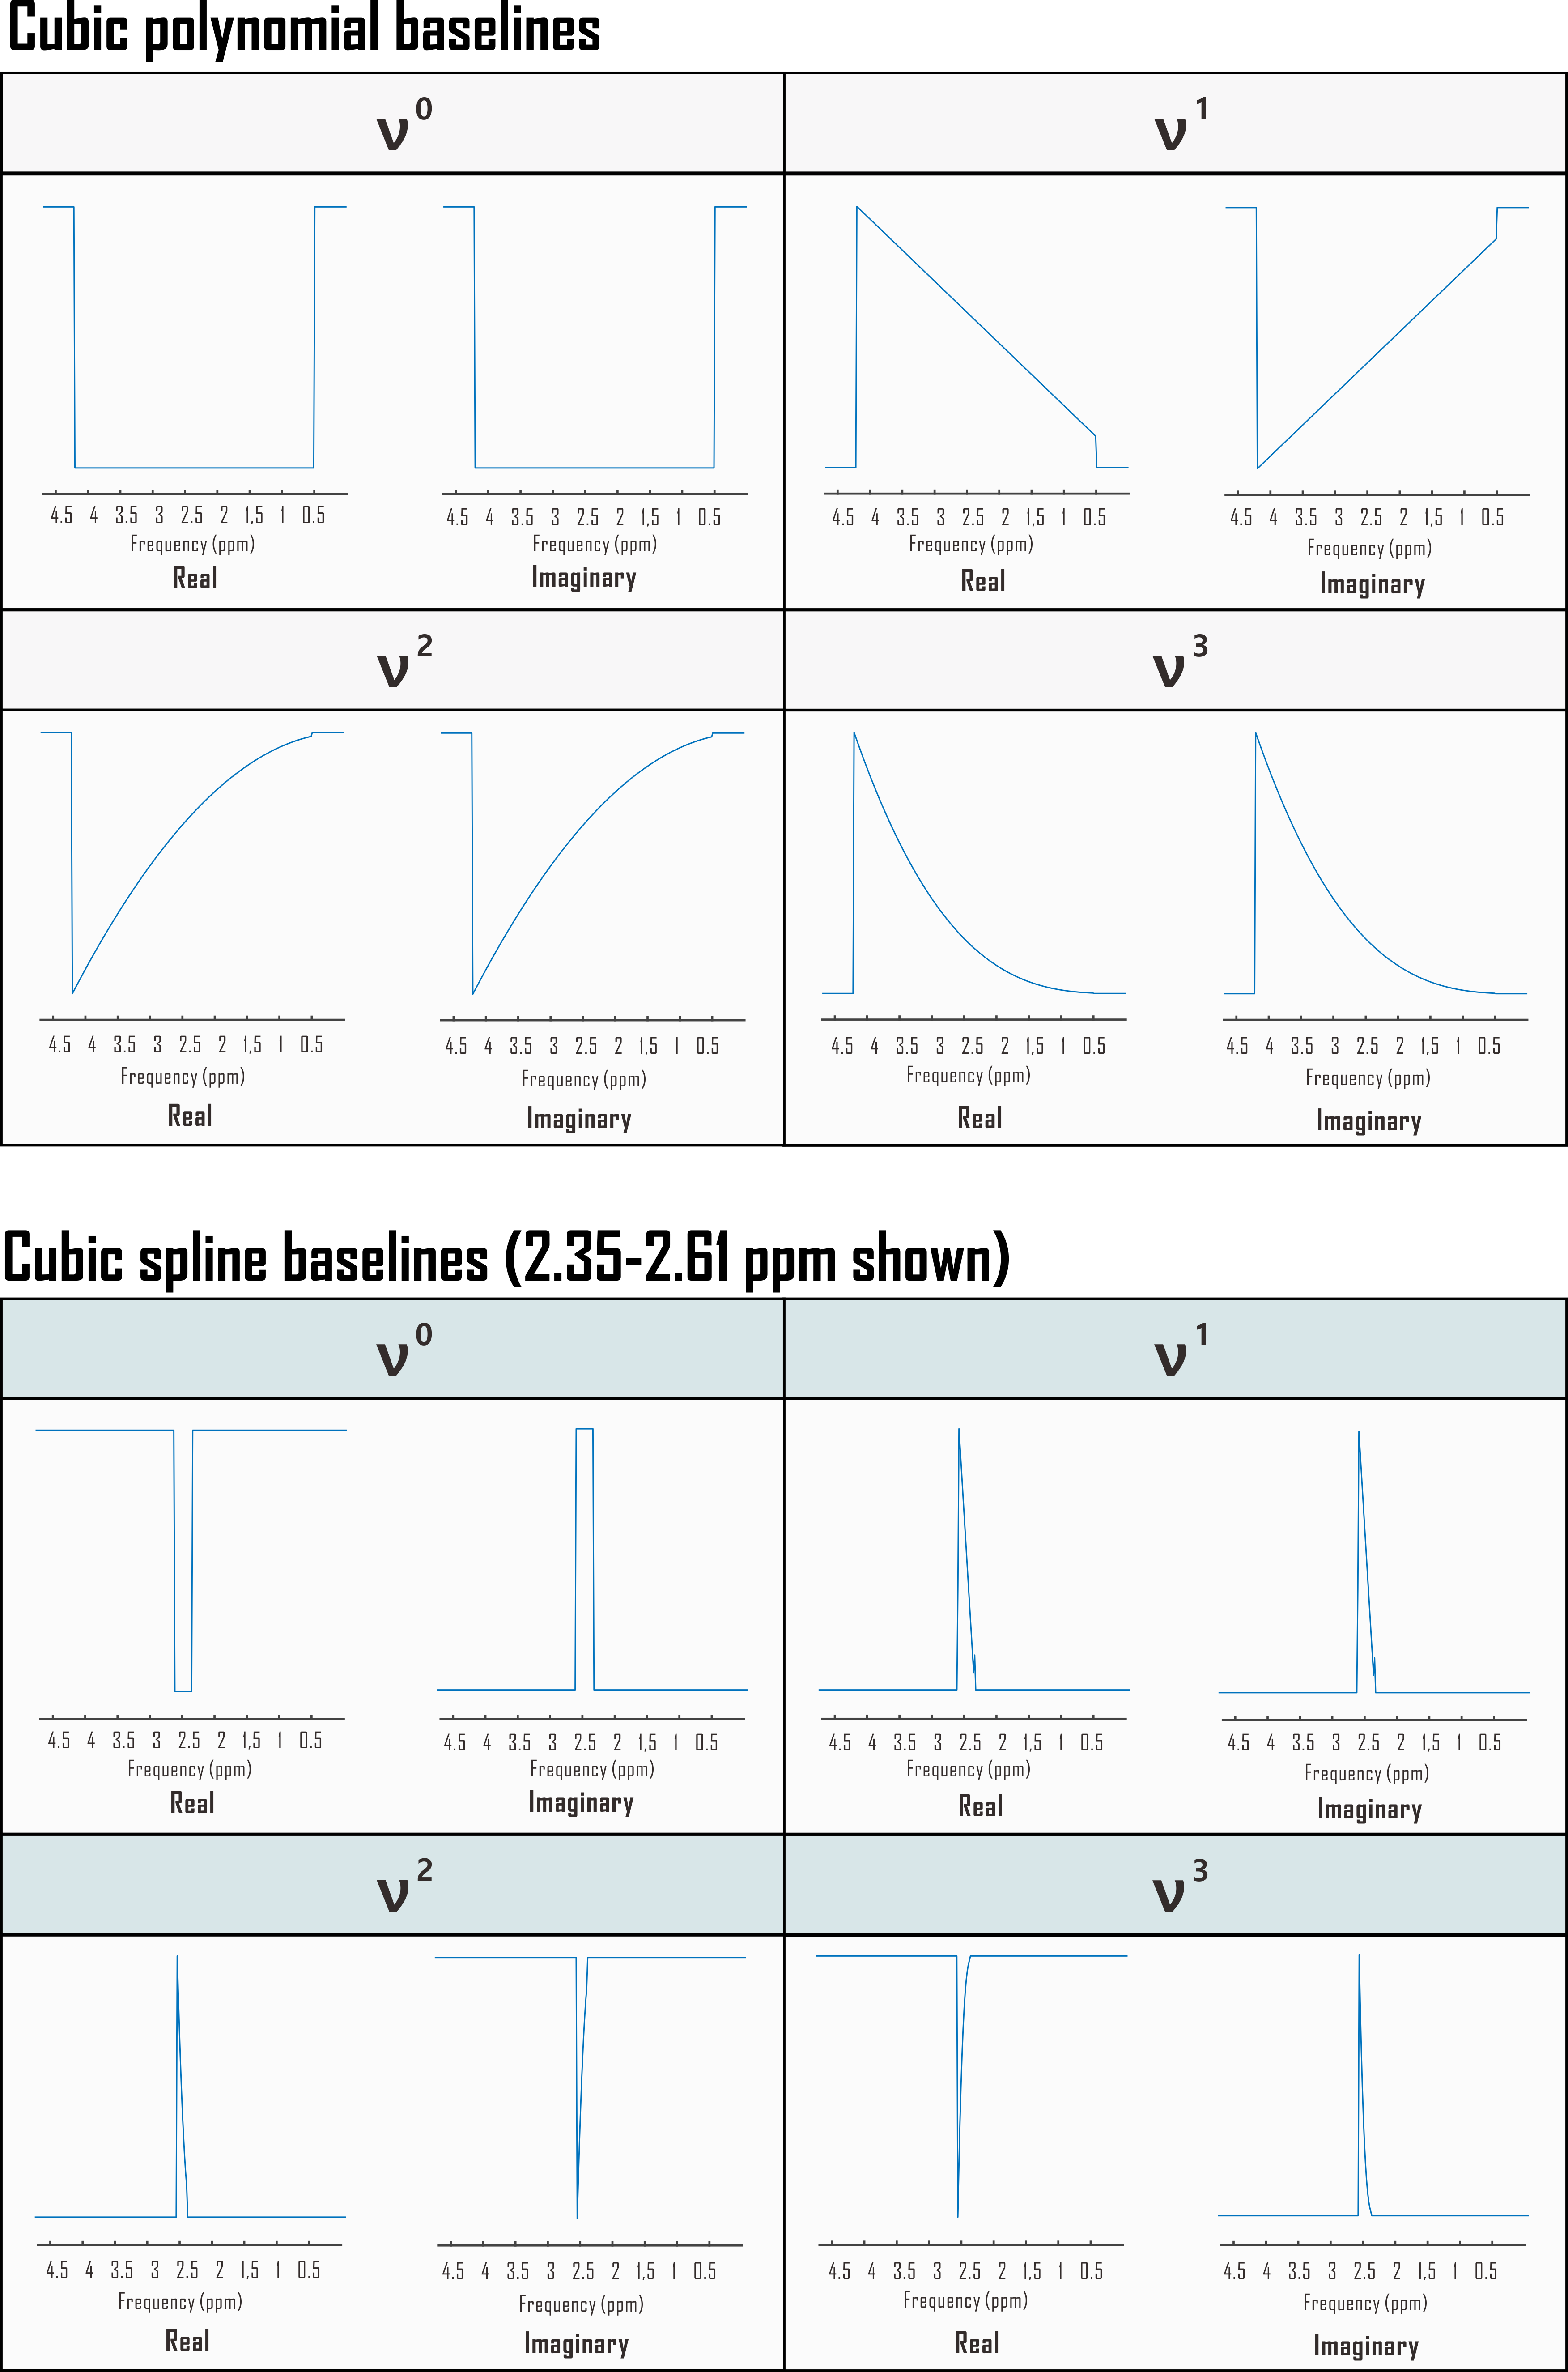
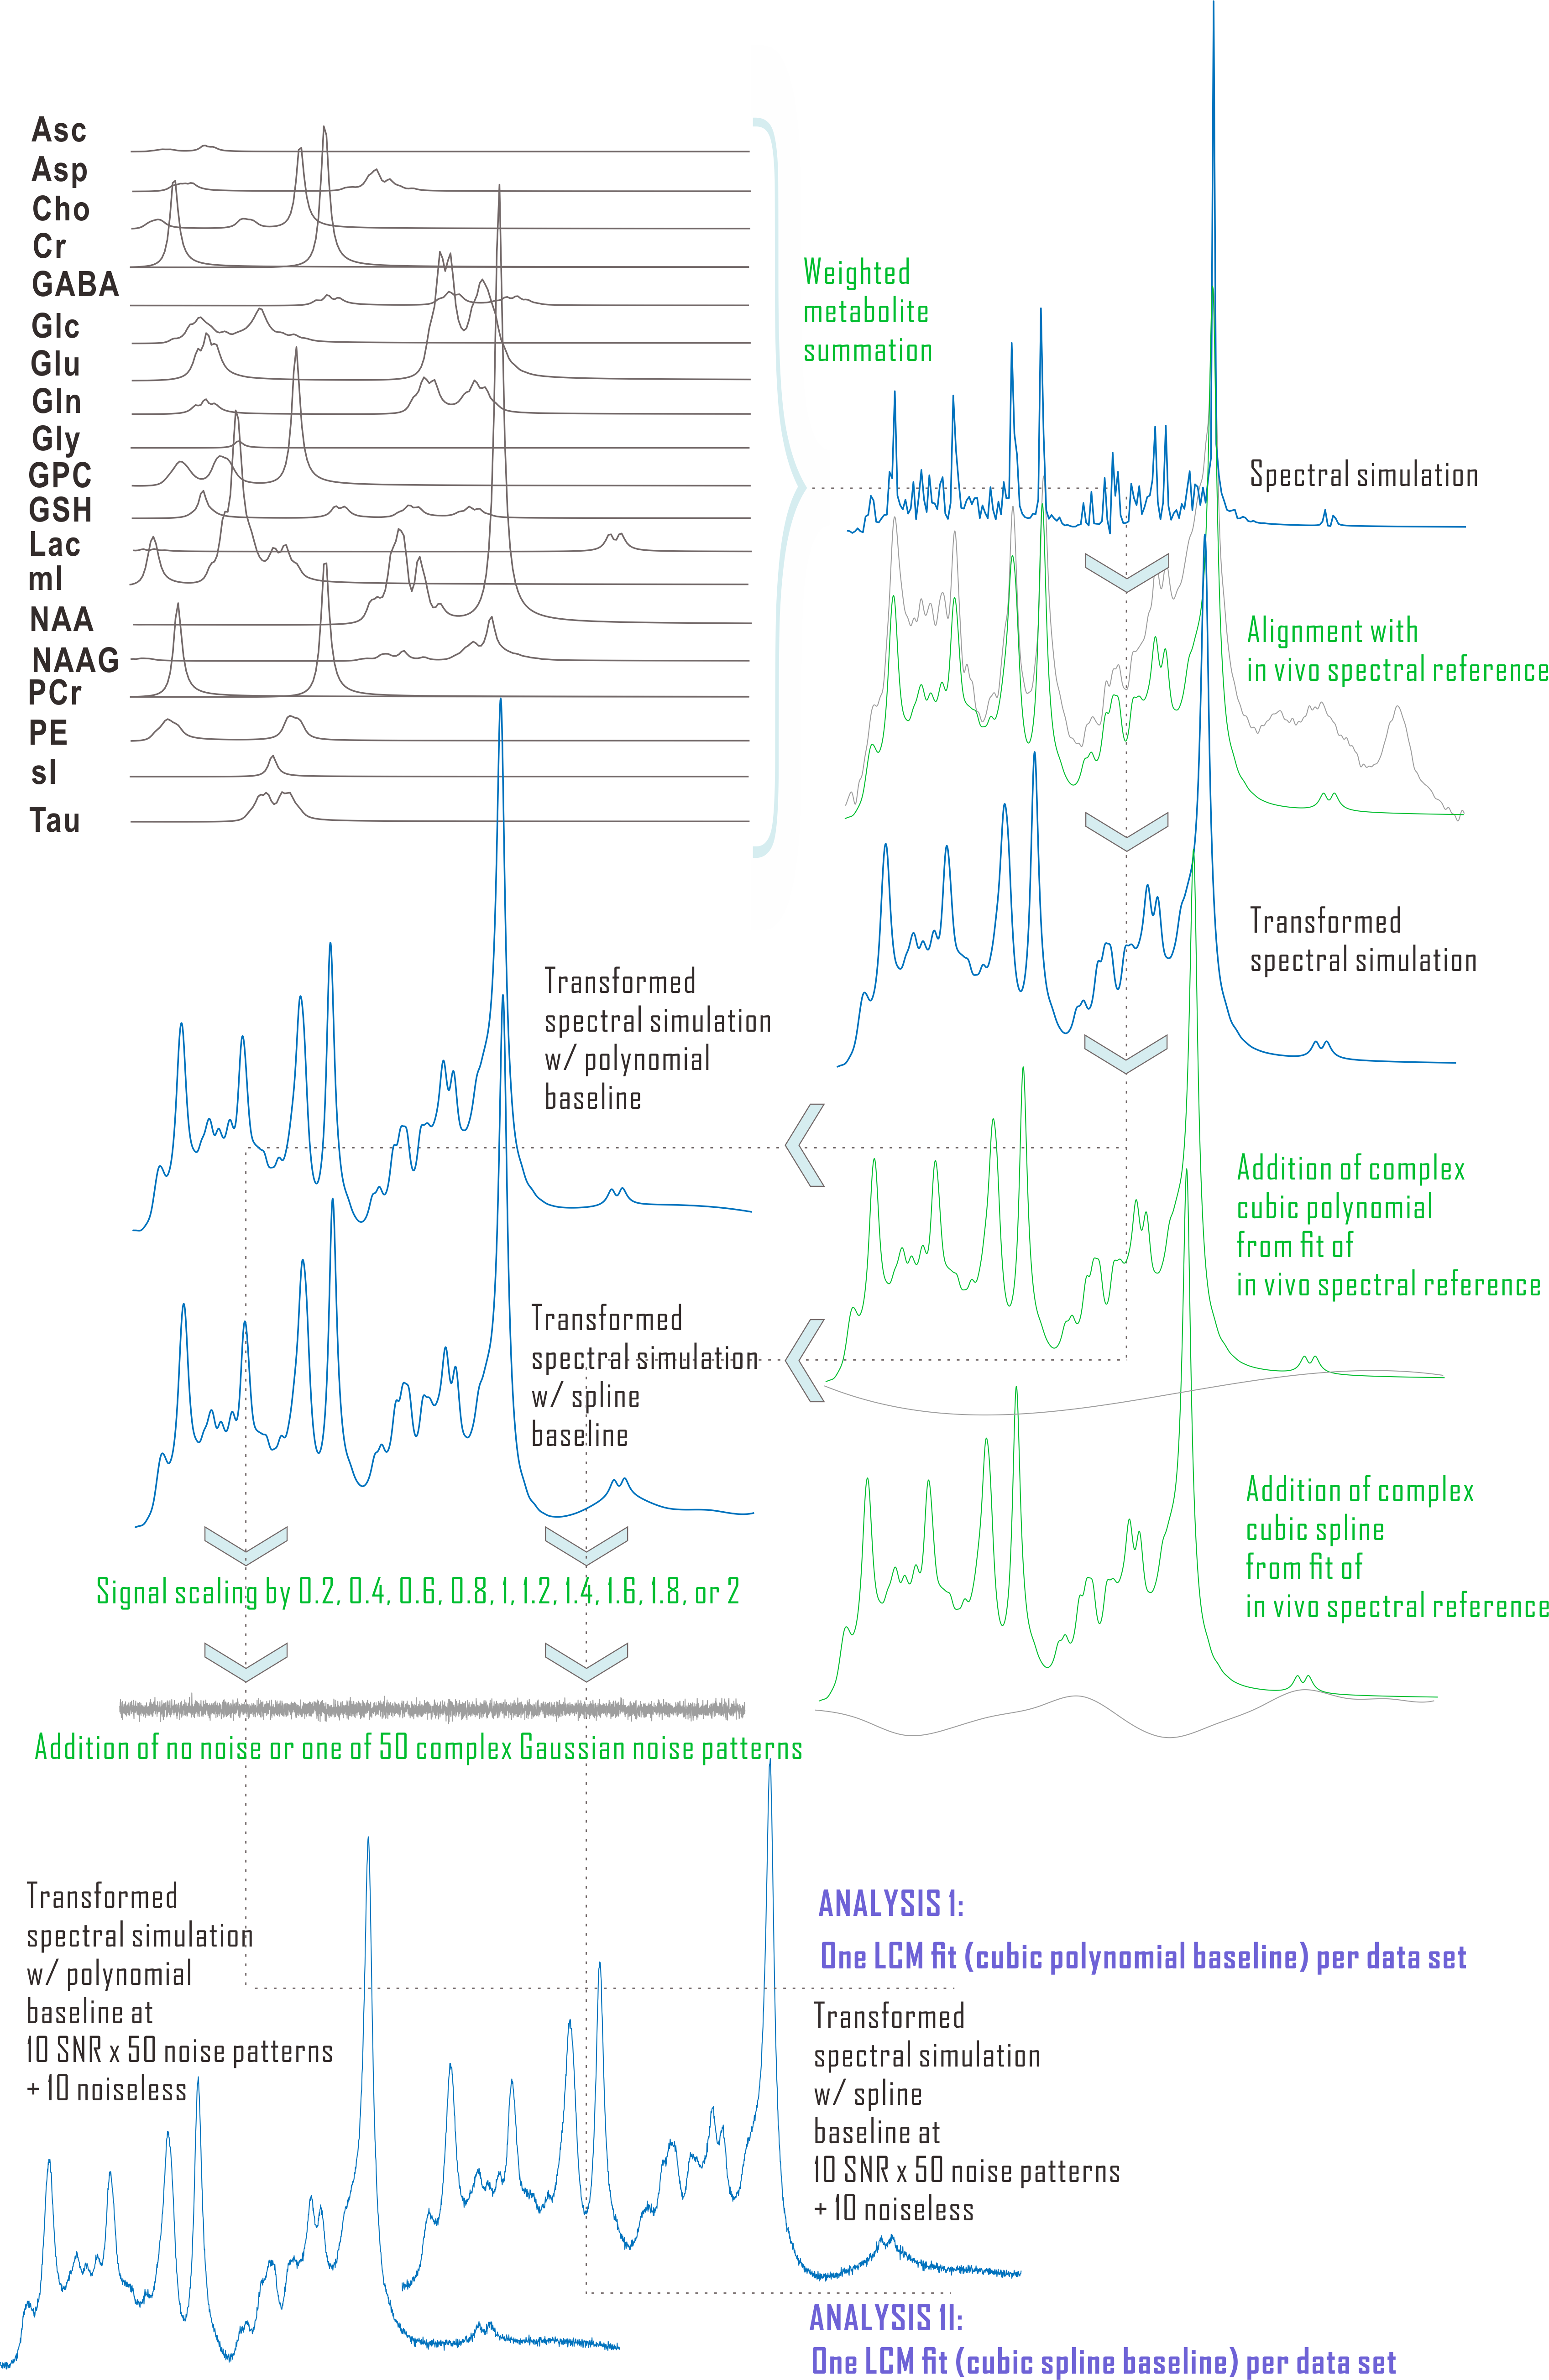
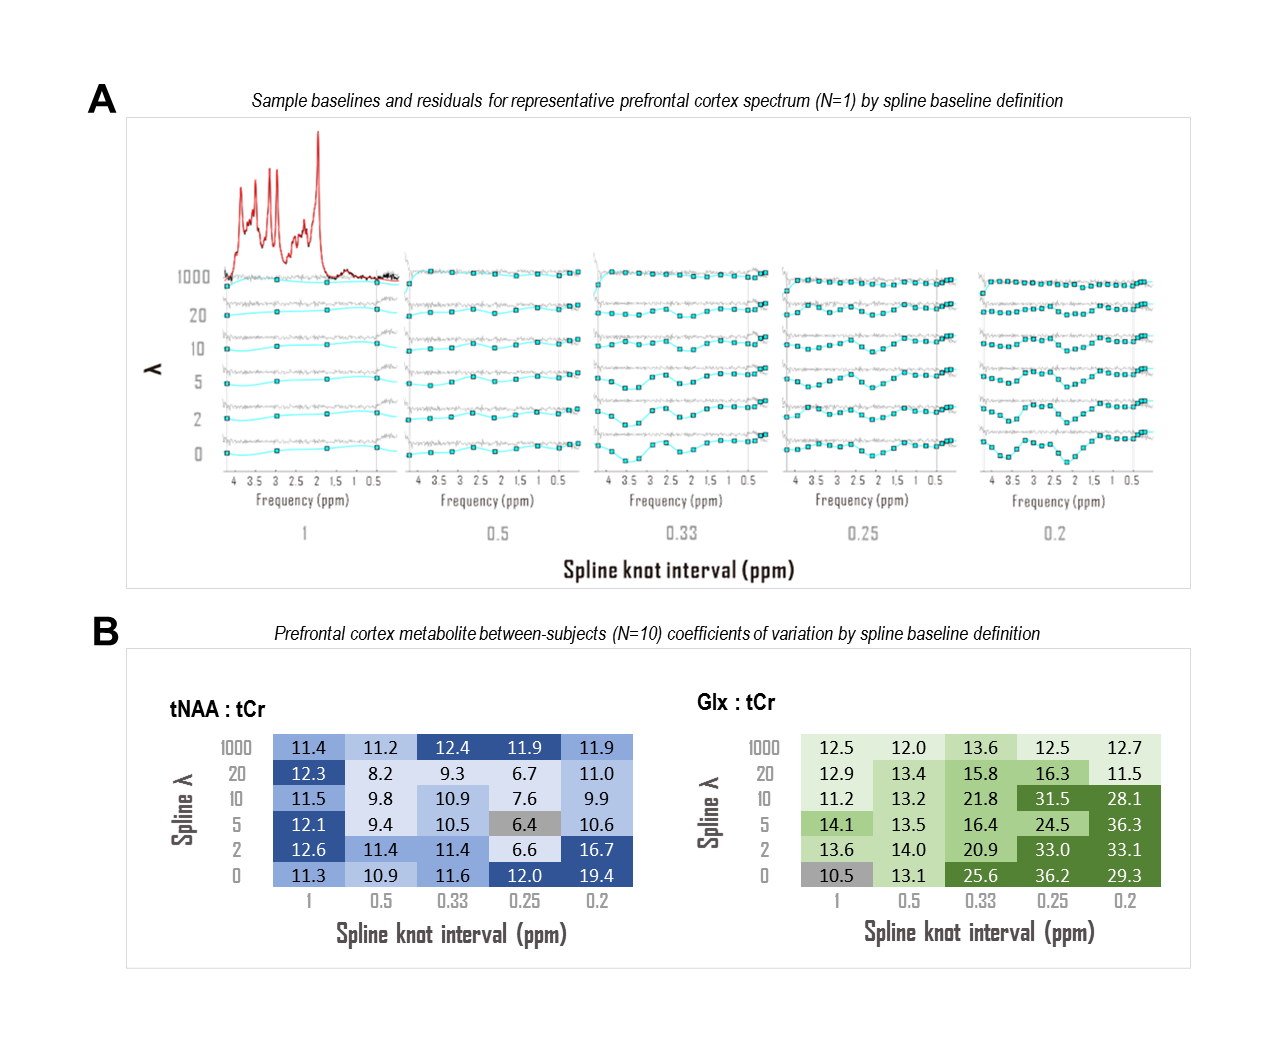
CRLBs for linear combination model parameters were calculated in time domain by inverting the fit Fisher information matrix2, wherein model partial derivatives w.r.t. baseline shape were expressed as inverse Fourier transforms of either full or piecewise polynomials, split by order and domain. Piecewise splines were smoothed for CRLB calculation to mitigate jump discontinuities from zero within the spectral fit range (Fig. 1). Validation analyses employed a MARSS10-simulated sLASER (TE 20.1 ms) metabolite spectrum line-broadened 6 Hz, frequency-shifted, and scaled including a cubic polynomial baseline to an analogous prefrontal cortex (PFC) acquisition11 (TR 2 s, NR 128) acquired on a 3 T MAGNETOM Prisma (Siemens Healthineers, Erlangen, Germany) (Fig. 2).Simulated complex cubic polynomial or complex smoothed1 cubic spline baselines were derived from LCM fits to the in vivo alignment reference following measured macromolecule subtraction; spline knot interval and smoothing λ were optimized for minimum between-subjects tNAA/tCr coefficient of variation across LCM fits to PFC spectra from 10 healthy adults (5 female, 23 ± S.D. 5 y.o., <27 cm3 cubic voxels) similar to and including the alignment reference11 (Fig. 3).
This preprocessed simulated brain spectrum was summed with either the polynomial (Analysis I) or spline (Analysis II) baseline and then scaled to ten linearly spaced SNR from 18 to 180 (signal from 3.03-ppm creatine). The same 50 complex Gaussian noise patterns were then added to each SNR group, with noiseless references retained for relative error calculation, for 510 simulated spectra per analysis. Spectral quantification by LCM, including baseline modeling and CRLB calculations, was then performed on these simulated spectra by scripting in INSPECTOR12. Group statistics and Bonferroni (N=10)-corrected Shapiro-Wilk analyses for normality of observed fit parameter distributions were performed in R (v. 3.4.4; R Foundation for Statistical Computing, Vienna, Austria).
Results
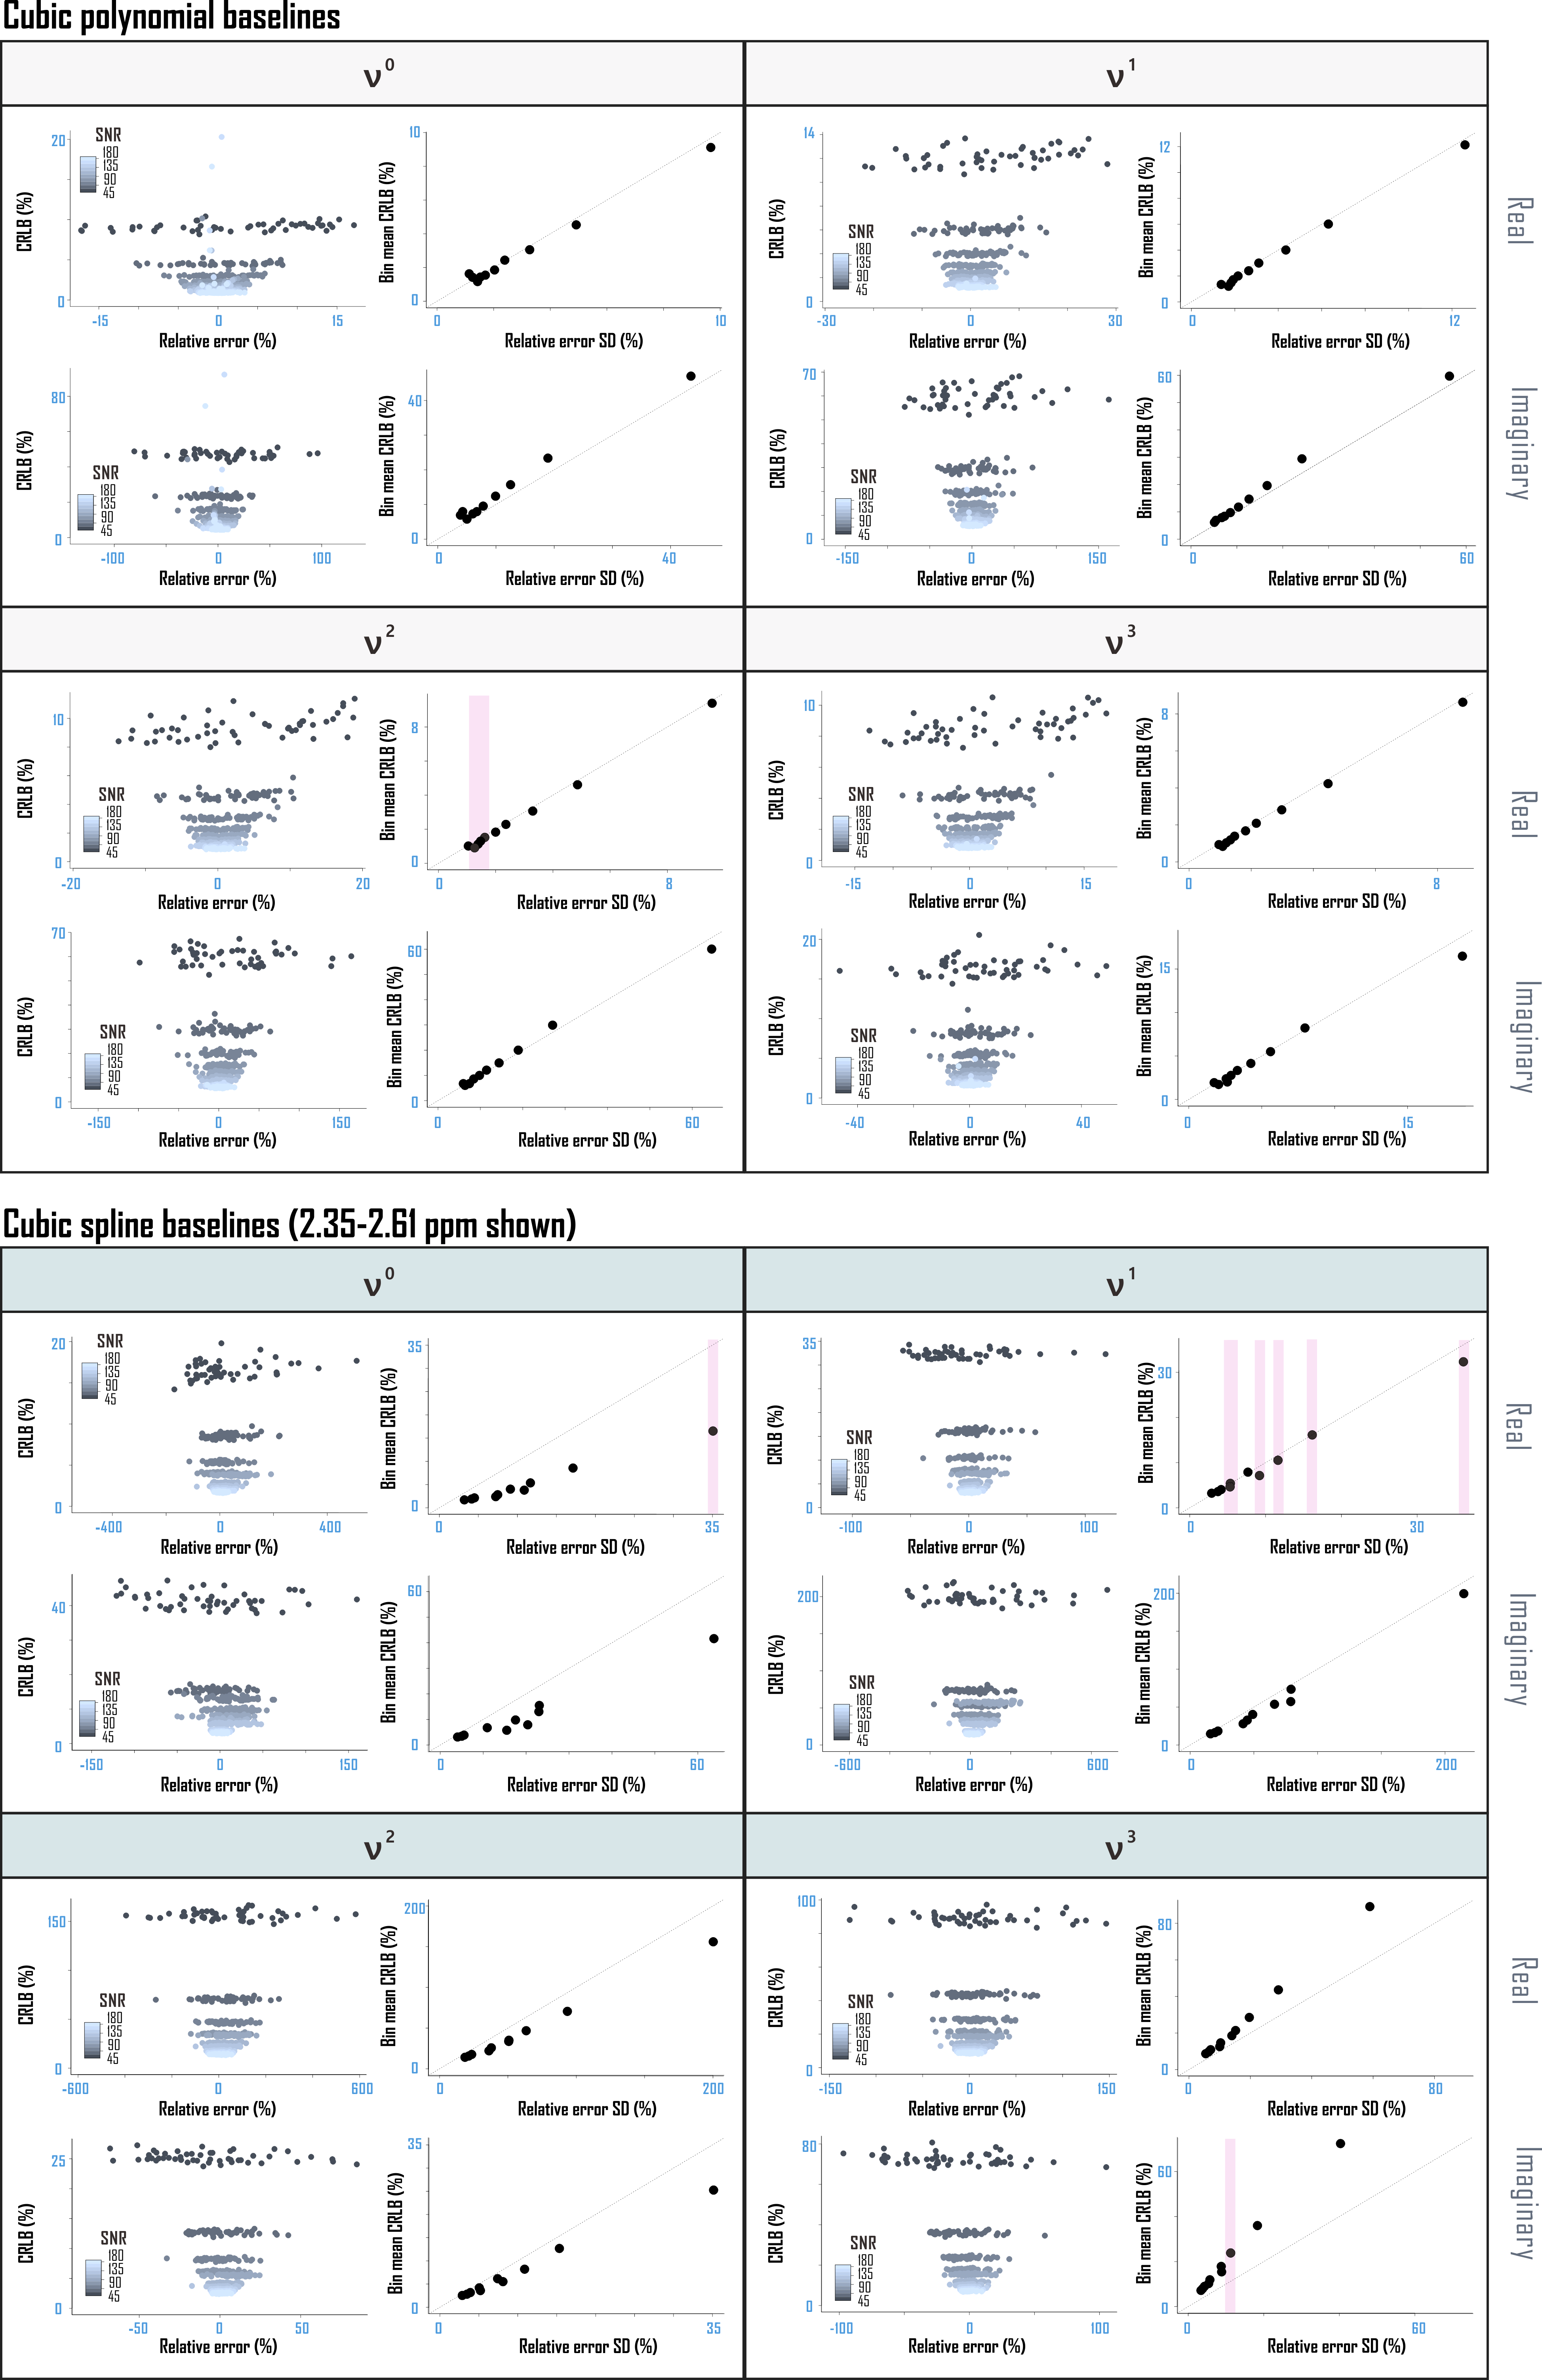
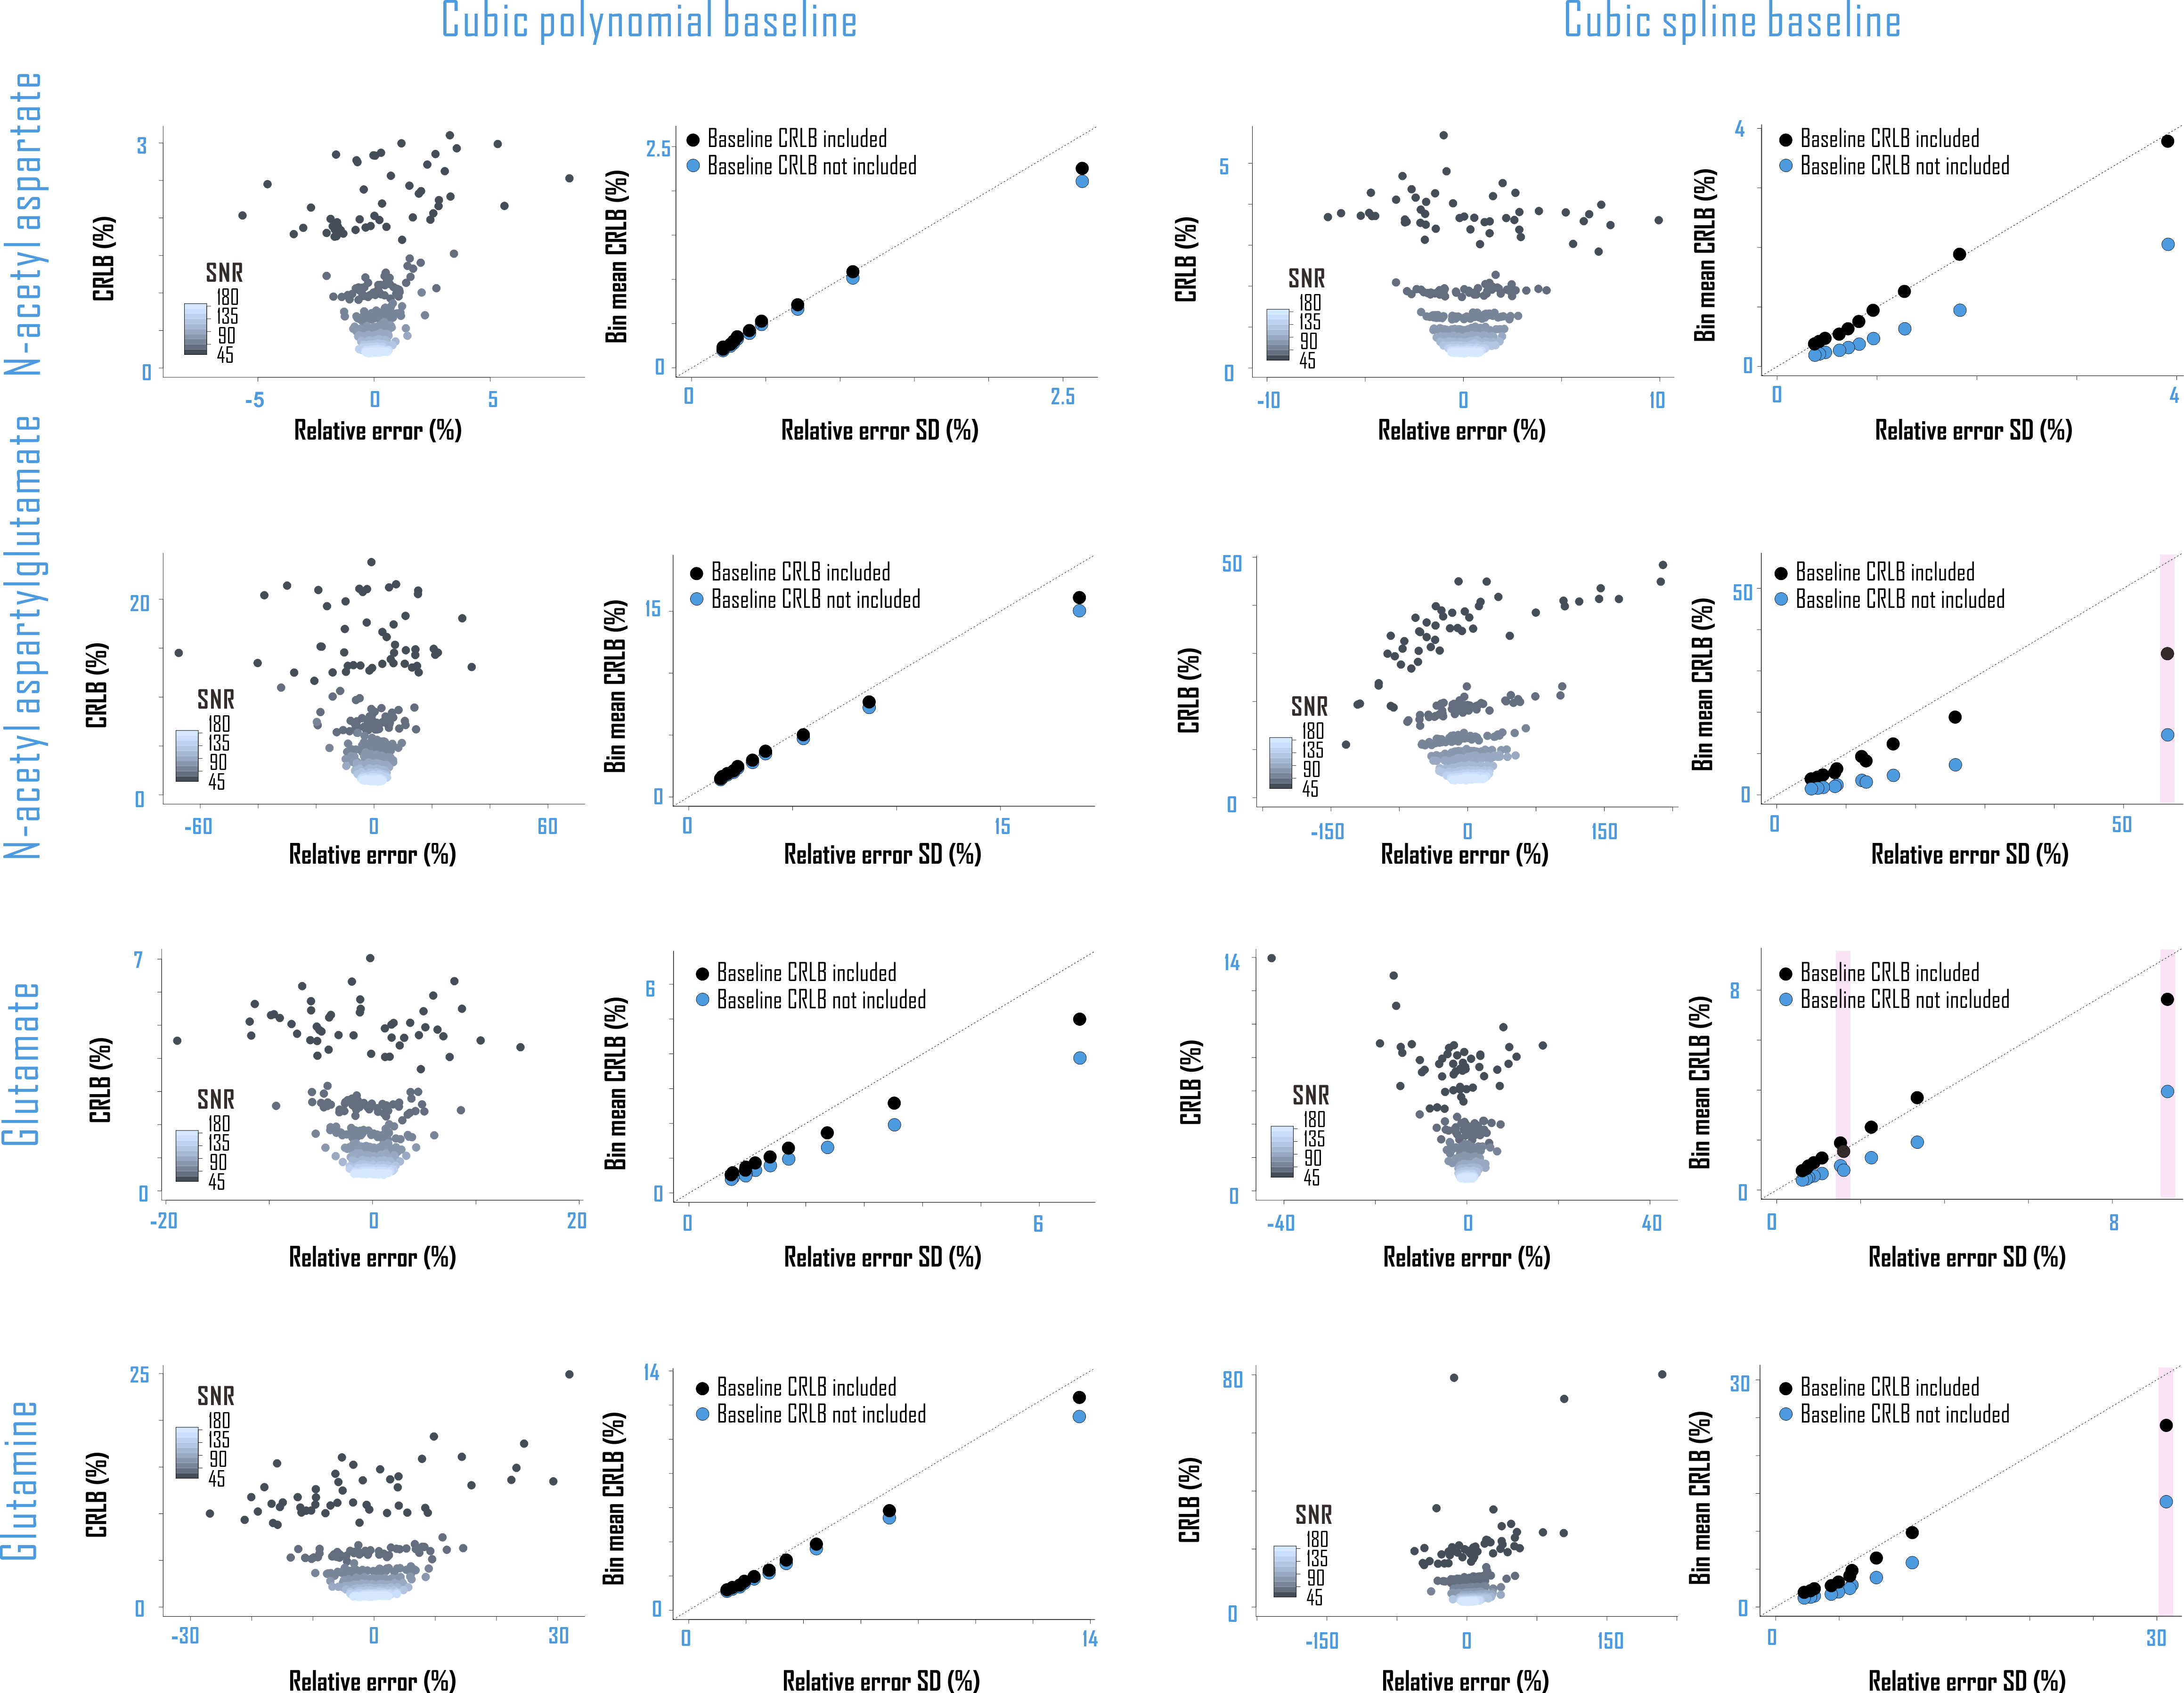
Amplitude CRLBs for complex polynomial baseline shapes demonstrated identity relationships with the standard deviations of their parameter estimations (Fig. 4). CRLBs for complex piecewise polynomials within splines (optimized knot interval 0.25 ppm, lambda 5; Fig. 3) also demonstrated linear relationships with the standard deviations of their parameter estimates, though some deviations from identity were observed (Fig. 4). Including either polynomial or spline baseline shapes in the Fisher information matrix improved correspondence between calculated CRLBs and observed standard deviations of metabolite fit amplitudes (Fig. 5).Conclusions
Here we have shown the following:- Cramér-Rao Lower Bounds calculated on baseline shapes analogously to metabolite bases can estimate fit amplitude standard deviations on polynomials and inform those for piecewise smoothed splines, despite the fact that for the latter the standard deviation of observed fit amplitudes is expected to be constrained by smoothing and neighboring pieces in a manner not represented in the straightforward calculation of CRLBs from the Fisher information matrix.
- Incorporating either polynomial or spline baseline shape information directly into the Fisher information matrix can improve the correspondence between calculated CRLBs and observed standard deviations of metabolite fit amplitudes.
Our implementation of this foundation for characterizing the precision of spectral baseline parameter estimates via Cramér-Rao Lower Bounds enables further systematic elaboration thereof. These include modifications accounting for expected disruptions to parameter estimate normality by model constraints, i.e., on the knots of piecewise splines by neighboring pieces, as well as investigations into the degree to which baseline CRLBs calculated in this manner can further improve CRLB estimates for metabolite amplitudes in cases of greater uncertainty regarding baseline models for the spectral data sets at hand, i.e., in vivo.
Acknowledgements
This work was performed at the Zuckerman Mind Brain Behavior Institute MRI Platform, a shared resource. In vivo measurements were drawn from a study conducted in accordance with Columbia University Institutional Review Board protocol AAAQ9641.References
1 Provencher S. W. Estimation of metabolite concentrations from localized in vivo proton NMR spectra. Magn Reson Med 1993; 30(6): 672-679, doi:10.1002/mrm.1910300604.
2 Cavassila S., Deval S., Huegen C., van Ormondt D. and Graveron-Demilly D. Cramér-Rao bounds: an evaluation tool for quantitation. NMR Biomed 2001; 14(4): 278-283, doi:10.1002/nbm.701.
3 Cavassila S., Deval S., Huegen C., van Ormondt D. and Graveron-Demilly D. Cramér-Rao bound expressions for parametric estimation of overlapping peaks: influence of prior knowledge. J Magn Reson 2000; 143(2): 311-320, doi:10.1006/jmre.1999.2002.
4 Ratiney H., Cavassila S., van Ormondt D. and Graveron-Demilly D. Extended Cramér-Rao Lower Bounds: Background Accommodation. Proceedings of the International Society for Magnetic Resonance in Medicine 2004.
5 Ratiney H., Coenradie Y., Cavassila S., van Ormondt D. and Graveron-Demilly D. Time-domain quantitation of 1H short echo-time signals: background accommodation. MAGMA 2004 16(6): 284-296, doi:10.1007/s10334-004-0037-9.
6 Elster C., Schubert F., Link A., Walzel M., Seifert F., and Rinneberg H. Quantitative magnetic resonance spectroscopy: semi-parametric modeling and determination of uncertainties. Magn Reson Med 2005; 53(6): 1288-1296, doi:10.1002/mrm.20500.
7 Zhang Y. and Shen J. Smoothness of in vivo spectral baseline determined by mean-square error. Magn Reson Med 2014 72(4): 913-922, doi:10.1002/mrm.25013.
8 Kreis R. and Boesch C. Bad spectra can be better than good spectra. Proceedings of the International Society for Magnetic Resonance in Medicine 2003.
9 Swanberg K.M., Prinsen H. and Juchem C. Spectral quality differentially affects apparent metabolite concentrations as estimated by linear combination modeling of in vivo magnetic resonance spectroscopy data at 7 Tesla. Proceedings of the International Society for Magnetic Resonance in Medicine 2019.
10 Landheer K., Swanberg K. M. and Juchem C. Magnetic Resonance Spectrum Simulator (MARSS), a novel software package for fast and computationally efficient basis set simulation. NMR Biomed 2019; e4129, doi:10.1002/nbm.4129.
11 Landheer K., Gajdosik M., Treacy M. and Juchem, C. Concentration and effective T2 relaxation times of macromolecules at 3T. Magn Reson Med 2020; 84(5): 2327-2337, doi:10.1002/mrm.28282.
12 Juchem, C. INSPECTOR - Magnetic Resonance Spectroscopy Software. Columbia Tech Venture (CTV) License CU17130, 2016). innovation.columbia.edu/technologies/cu17130_inspector
Figures