1789
Multi-Centre patients receiving lithium treatment for bipolar disorder: 7Li-MRI optimization using a physiologically representative phantom1Translational and Clinical Research Institute, Newcastle Magnetic Resonance Centre, Newcastle University, Newcastle upon Tyne, United Kingdom, 2NeuroSpin, CEA, CNRS, Paris-Saclay University, Gif-sur-Yvette, France, 3CATI, Institut du Cerveau et de la Moëlle Epinière, Paris, France, 4IRCCS, Fondazione Don Carlo Gnocchi ONLUS, Milan, Italy, 5Siemens Healthcare A/S & Siemens Healthcare GmbH, Copenhagen, Denmark, 6Neurobiology Research Unit (NRU) at Copenhagen University Hospital Rigshospitalet, Copenhagen, Denmark, 7Department of Psychiatry and Psychotherapy, University Hospital, LMU University, Munich, Germany, 8Department of Radiology, University Hospital, LMU Munich, Munich, Germany, 9Institute and Clinic of Diagnostic and Interventional Neuroradiology, University Hospital, Carl Gustav Carus, Dresden, Germany, 10Department of Psychiatry, University Hospital Carl Gustav Carus, Technische Universität Dresden, Dresden, Germany, 11Department of Pathophysiology and Transplantation, University of Milan, Milan, Italy, 12Department of Neurosciences and Mental Health, Fondazione IRCCS Ca' Granda Ospedale Maggiore Policlinico, Milan, Italy, 13INSERM UMRS-1144, AP-HP, Saint-Louis - Lariboisière – F. Widal Hospitals, Paris, France, 14Regional Affective Disorders Service, Cumbria, Northumberland, Tyne and Wear NHS Foundation Trust, Newcastle Upon Tyne, United Kingdom
Synopsis
7Li-MRI is a unique technique to trace the brain lithium distribution, which may predict treatment response in bipolar disorder. The signal-to-noise ratio in balanced steady state free precession acquisition protocols (bSSFP) for 7Li-MRI can be efficiently optimized using physiologically representative phantoms. We sought to implement and validate a bSSFP protocol to maximize 7Li signal amplitude using theoretical modelling and phantom acquisitions, further validating the sequence across multiple centres, ensuring data harmonization. bSSFP signal modelling and phantom data demonstrated good agreement, with minimal inter-site variation in signal-to-noise confirming suitability for use in our multi-centre study of lithium response in bipolar disorder.
Introduction
The advent of 3D Lithium-MRI (7Li-MRI) has facilitated the in vivo imaging of the distribution of lithium (Li) in the brain in patients receiving lithium as a treatment for bipolar disorder (BD) 1-3. Moreover, with the recent implementation of balanced steady-state free precession (bSSFP) techniques, there has been a notable reduction in 7Li-MRI scan duration, making the translation into clinical research studies feasible 2,3. The Response to Lithium Network (R-LiNK; https://rlink.eu.com) initiative seeks to optimize the early prediction of response to lithium in bipolar disorder through the identification of multi-modal biomarkers in a multi-centre, multinational European study 4. This includes characterizing the steady state distribution of Li in the brain three months after commencing lithium treatment using 7Li-MRI 4, with response to lithium determined over a two-year follow-up period. 7Li-MRI is an inherently low signal-to-noise ratio (SNR) technique owing to the low concentration of Li in brain tissue when prescribed in the therapeutic range 5. Therefore, optimization of the sequence for maximum signal amplitude for 7Li is essential to improve the understanding of 7Li distribution in the brain and its relationship with treatment response. We aimed to optimize the 3D bSSFP sequence 2,3 using a combination of theoretical modelling, and phantoms with physiologically representative 7Li relaxation properties. We also implemented and validated the sequence across five European centres, to ensure harmonized 7Li-MRI data acquisition for the R-LiNK studyMaterials and Methods
In biological tissues (assuming $$$TE=TR/2 and TR<<T1,T2 $$$), the on-resonance bSSFP signal intensity is a function of the T1/T2 ratio, and flip angle (α) 6,$$Mss = M0×sin(α)÷1+cos(α)+(1-cos(α))×(T1/T2)$$(1)
The optimum flip angle (α) depends on T1/T2 6,
$$cos(α) = T1/T2 -1÷T1/T2 +1$$(2)
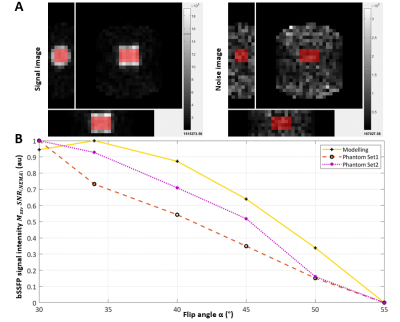
The optimum flip angle was determined by modelling the maximum on-resonance bSSFP signal intensity for (α) = [30°,34°,40°,45°,50°,55°] using T1, T2 values of (3000ms, 275ms) representative of in vivo T1 values 2,7, T2 values 8-10 .
Phantom validation was performed on a Philips 3T Achieva scanner (Philips Medical Systems, Best, The Netherlands) using a quadrature, double tuned 1H/7Li radiofrequency birdcage head coil (RAPID Biomedical, Rimpar, Germany). Using similar T1, T2 values, two sets of 3D bSSFP data were acquired for an identical array of flip angle values as theoretical modelling. Additionally, a noise-only image was also acquired (α=0°). Signal-to-noise ratios (SNR) were computed from the mean value of the image signal (SNEMA), standard deviation (SD) of the noise image (σNEMA), assuming a Rayleigh distribution of noise according to NEMA standard method MS 1-2001 11-13.
$$SNRNEMA(img,noise) = SNEMA÷σNEMA = mimg÷√(2/4-π)×snoise$$(3)
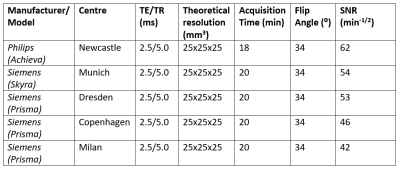
The 3D bSSFP sequence optimized for maximum SNR was implemented across sites with Siemens 3T scanners (Siemens Healthineers AG, Erlangen, Germany) using identical phantoms and multinuclear coils. SNRs were computed from the mean of a standard region of interest (ROI) on the magnitude image, SD of a background ROI, factored for Rayleigh distribution of background noise 11,13. Finally, in vivo pilot data were acquired at each centre by recruiting a single patient taking lithium carbonate as a maintenance treatment for bipolar disorder.
Results and Discussion
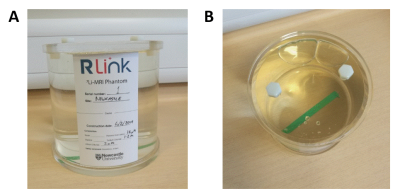
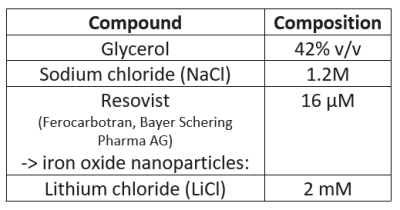
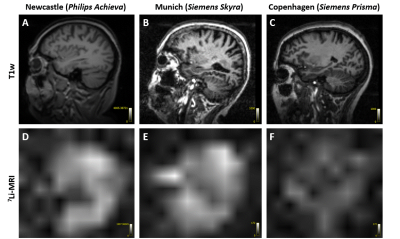
The physiologically representative phantom used for 7Li-MRI optimization is shown in Figure 1. Figure 2 shows a representative signal and pure noise phantom image (2A), and profile of the normalized bSSFP signal intensity (Mss) as a function of flip angle (α) from the theoretical modelling and SNR of the phantom tests (2B). The optimum flip angle was computed to be slightly higher for signal modelling compared to phantom data. Figure 3 shows 7Li-MRI images acquired in vivo at three neuroimaging centres with their respective T1-weighted anatomical references.Using a physiological representative phantom, we modelled the 3D 7Li BSSFP signal amplitude as a function of FA and successfully translated this to in vivo conditions. Furthermore, as conventionally derived SNRs from distinct signal and background noise regions deviate from the actual SNRs in the presence of image reconstruction filters such as the elliptical filter used in the phantom data, our SNR computations employed a pure noise image in adherence to the NEMA standard MS 1-2001 11-13. Even though our phantom data showed good agreement with the modelling data, future comparative work may incorporate a two-compartment model to factor in the slow- and fast-relaxing components of the 7Li signal 10,14.
The final optimized 3D bSSFP sequence was implemented with minimized TR/TE to reduce susceptibility-induced distortions typically observed at higher field strengths 15. The observed variation in SNR across sites (Table 2) was acceptably small, and likely due to differences in system installation environments, difference in scanner type, vendor, and shimming procedures. Although the optimized scan protocol implemented in vivo showed inter- and inter-patient signal variations across centres, these were likely attributable to differences in brain Li content and distribution 16 that is known to occur between patients.
Conclusion
Our realistic Li phantom-based strategy led us to suitably high, consistent normalized SNR values across centers despite the variability of hardware and software environments, demonstrating the ability to implement and acquire 3D 7Li images in vivo for the R-LiNK study. Overall, this systematic, standardized approach could be expanded beyond the scope of the R-LiNK consortium to better characterize Li brain distribution in patients with bipolar disorder, with the ultimate goal of predicting response to lithium treatment.Acknowledgements
We would like to thank the radiographers Tim Hodgson, Louise Ward, Dorothy Wallace at the Newcastle Magnetic Resonance Centre and Marta Cazzoli at Fondazione Don Carlo Gnocchi ONLUS and University of Milan for their support in acquiring the phantom data. We would also to thank all the participants involved in the pilot study at the sites. The R-LiNK project has received funding from the European Union’s Horizon 2020 research and innovation program under grant agreement No 754907.References
1. Boada FE, Qian Y, Gildengers A, et al. In vivo 3D lithium MRI of the human brain. In: DK Sodickson, editor. Proceedings of the 18th Annual Meeting. International Society for Magnetic Resonance in Medicine: Stockholm, Sweden. 1st to 7th May 2010, p. 592.
2. Smith FE, Thelwall PE, Necus J, et al. 3D 7Li magnetic resonance imaging of brain lithium distribution in bipolar disorder. Molecular Psychiatry. 2018; 23:2184-2191.
3. Necus J, Nishant N, Smith FE, et al. White matter microstructural properties in bipolar disorder in relationship to the spatial distribution of lithium in the brain. Journal of Affective Disorders. 2019; 253: 224-231.
4. Scott J, Hidalgo-Mazzei D, Strawbridge R, et al. Prospective cohort study of early biosignatures of response to lithium in bipolar-I-disorders: overview of the H2020-funded R-LiNK initiative. Int J Bipolar Disord. 2019; 7(1):20.
5. Komoroski RA, Pearce JM, Newton JEO. The distribution of lithium in rat brain and muscle in vivo by Li-7 NMR imaging. Magn Reson Med. 1997; 38:275-8.
6. Scheffler, K., Lehnhardt, S. Principles and applications of balanced SSFP techniques. Eur Radiol. 2003; 13(11):2409-18.
7. Smith FE, Cousins DA, Thelwall PE, et al. Quantitative lithium magnetic resonance spectroscopy in the normal human brain on a 3 T clinical scanner. Magn Reson Med. 2011; 66(4):945-9.
8. Wingo AP, Wingo TS, Harvey PD, et al. Effects of lithium on cognitive performance: a meta-analysis. J Clin Psychiatry. 2009; 70(11):1588-97.
9. Kato T, Fujii K, Shioiri T, et al. Lithium side effects in relation to brain lithium concentration measured by lithium-7 magnetic resonance spectroscopy. Prog Neuropsychopharmacol Biol Psychiatry. 1996; 20(1):87-97.
10. Komoroski RA, Pearce JM. Estimating intracellular lithium in brain in vivo by localized 7Li magnetic resonance spectroscopy. Magnetic Resonance in Medicine. 2008; 60:21-26.
11. Dietrich O, Raya JG, Reeder SB, et al. Measurement of signal-to-noise ratios in MR images: influence of multichannel coils, parallel imaging, and reconstruction filters. J Magn Reson Imaging. 2007; 26(2):375-85.
12. National Electrical Manufacturers Association (NEMA). Determination of signal-to-noise ratio (SNR) in diagnostic magnetic resonance imaging. NEMA Standards Publication MS 1-2001. Rosslyn: National Electrical Manufacturers Association. 2001. 15 p.
13. Edelstein WA, Bottomley PA, Pfeifer LM. A signal-to-noise calibration procedure for NMR imaging systems. Med Phys. 1984; 11:180-185.
14. Renshaw PF, Wicklund S. In vivo measurement of lithium in humans by nuclear magnetic resonance spectroscopy. Biological Psychiatry. 1988; 23:465-475.
15. Huang SY, Seethamraju RT, Patel P, et al. Body MR Imaging: Artifacts, k-Space, and Solutions. Radiographics. 2015; 35(5):1439-60.
16. González RG, Guimaraes AR, Sachs GS, et al. Measurement of human brain lithium in vivo by MR spectroscopy. AJNR Am J Neuroradiol. 1993; 14(5):1027-37.
Figures
