1448
Implementing ConvDecoder with physics-based regularization to reconstruct under-sampled variable-flip angle MRI data of the breast1Department of Physics, The University of Texas at Austin, Austin, TX, United States, 2Oden Institute for Computational Engineering and Sciences, The University of Texas at Austin, Austin, TX, United States, 3Livestrong Cancer Institutes, The University of Texas at Austin, Austin, TX, United States, 4Department of Electrical and Computer Engineering, The University of Texas at Austin, Austin, TX, United States, 5Department of Imaging Physics, MD Anderson Cancer Center, Houston, TX, United States, 6Department of Abdominal Imaging, MD Anderson Cancer Center, Houston, TX, United States, 7Department of Biomedical Engineering, The University of Texas at Austin, Austin, TX, United States, 8Department of Diagnostic Medicine, The University of Texas at Austin, Austin, TX, United States, 9Department of Oncology, The University of Texas at Austin, Austin, TX, United States
Synopsis
We evaluate the ability of the ConvDecoder architecture regularized using a physical model to reconstruct under-sampled dynamic MRI data, namely variable-flip angle data as a proof-of-principle. The performance of the reconstruction is evaluated by comparing the normalized error with results returned by compressed sensing and the non-regularized ConvDecoder. We hypothesize that ConvDecoder with physics-based regularization will enable significantly fewer k-space measurements, thereby allowing for expedited scan time while maintaining spatial resolution.
Introduction
T1-mapping by the variable-flip angle (VFA) method requires the acquisition of T1-weighted MRI data at a series of different flip angles. These data are then fit to the fast spoiled gradient echo (FSPGR) model to return estimates of T1 at each voxel within the imaged tissue space1. T1 data is central for quantitative dynamic contrast-enhanced (DCE) MRI2,3. The potential to accelerate the acquisition of VFA data without substantial reduction in spatial resolution has not been explored using ConvDecoder4 with a physics-based regularization term. Reducing the scan time of the VFA acquisition could increase spatial resolution and reduce susceptibility to patient motion. While deep learning-based reconstruction methods have shown potential, they typically require large training datasets. Recently, untrained networks4-7 have been proposed to accelerate scans, but these architectures do not explicitly incorporate the known physical dynamics. Here we combine the ConvDecoder4 with a FSPGR regularization term8. We compare the image reconstruction quality and T1 map output of fully sampled VFA data to those of the under-sampled VFA data reconstructed with ConvDecoder + FSPGR regularization, ConvDecoder alone, and compressed sensing and parallel imaging (PICS).Methods
VFA acquisition. Patients with triple negative breast cancer enrolled in the prospective IRB approved clinical trial ARTEMIS (NCT02276443) were scanned on a 3T MR750w scanner (GE, Waukesha, WI) using a bilateral 8-channel phased-array breast coil (Invivo, Gainesville, Florida). The VFA data were collected with an FSPGR sequence with an acquisition matrix of 300x300, TR/TE = 7.60/2.33 ms, and flip angles of 3, 5, 10, and 15 degrees. One representative patient dataset was used for the preliminary analysis presented in this abstract.ConvDecoder reconstruction.The VFA dataset was initially reconstructed with PICS with L2 regularization and passed through the forward model, A, described below to simulate fully-sampled k-space. This dataset was then retrospectively under-sampled by applying a Poisson disc sampling mask (M) to k-space, generated with BART9, with a fully sampled autocalibration region and corresponding to an acceleration of R=16. Coil sensitivity maps (S) were estimated using ESPIRiT10. The forward operator for this problem is $$$A = M・F・S$$$, where F is the discrete Fourier transform operator. The resultant k-space measurements (y) were passed to the ConvDecoder network (G(w)), implemented in Python using the DeepInPy11 software with eight layers, 256 latent channels, and an input seed of size 64. The cost function used to train over the weights (w) of the ConvDecoder architecture is defined as follows:
$$L=\min_{w}||y-AG(w)||+\lambda ||G(w)-\hat{x}||$$
$$\hat{x}(T_1,\theta)=\max_{T_1}||G(w) ^{\top} D(T_1,\theta)||$$
Here, $$$\hat{x}$$$ is the FSPGR model computed by the inner product of G(w) with the dictionary, D(T1, $$$\theta$$$ ) created from 15,000 T1 values linearly spaced between 1 ms and 4000 ms12, where $$$\theta$$$ denotes the imaging parameters. The regularization term was activated every 5,000 epochs for a duration of 500 epochs. For reconstruction without regularization, $$$\lambda$$$ was set to 0, and training was performed for 50,000 epochs with a step size of 10-4. For regularized training (ConvDecoder + reg), $$$\lambda$$$ was set to 0.01 with the same step size and epoch duration previously mentioned.
PICS reconstruction. The undersampled k-space dataset described in the previous section was also reconstructed with PICS with a regularization rate of 10-6 for 3,000 iterations. The resultant image was then passed through the FSPGR model dictionary to derive a T1 map.
Statistical analysis.The normalized root mean square error (NRMSE) and concordance correlation coefficient (CCC) between the ground truth and reconstructed images were evaluated to assess the performance of our proposed model-based framework. The NRMSE can take on a value of 0 (high agreement) to any positive value (larger values, worse agreement), while the CCC extends from -1 (complete disagreement) to 1 (complete agreement).
Results
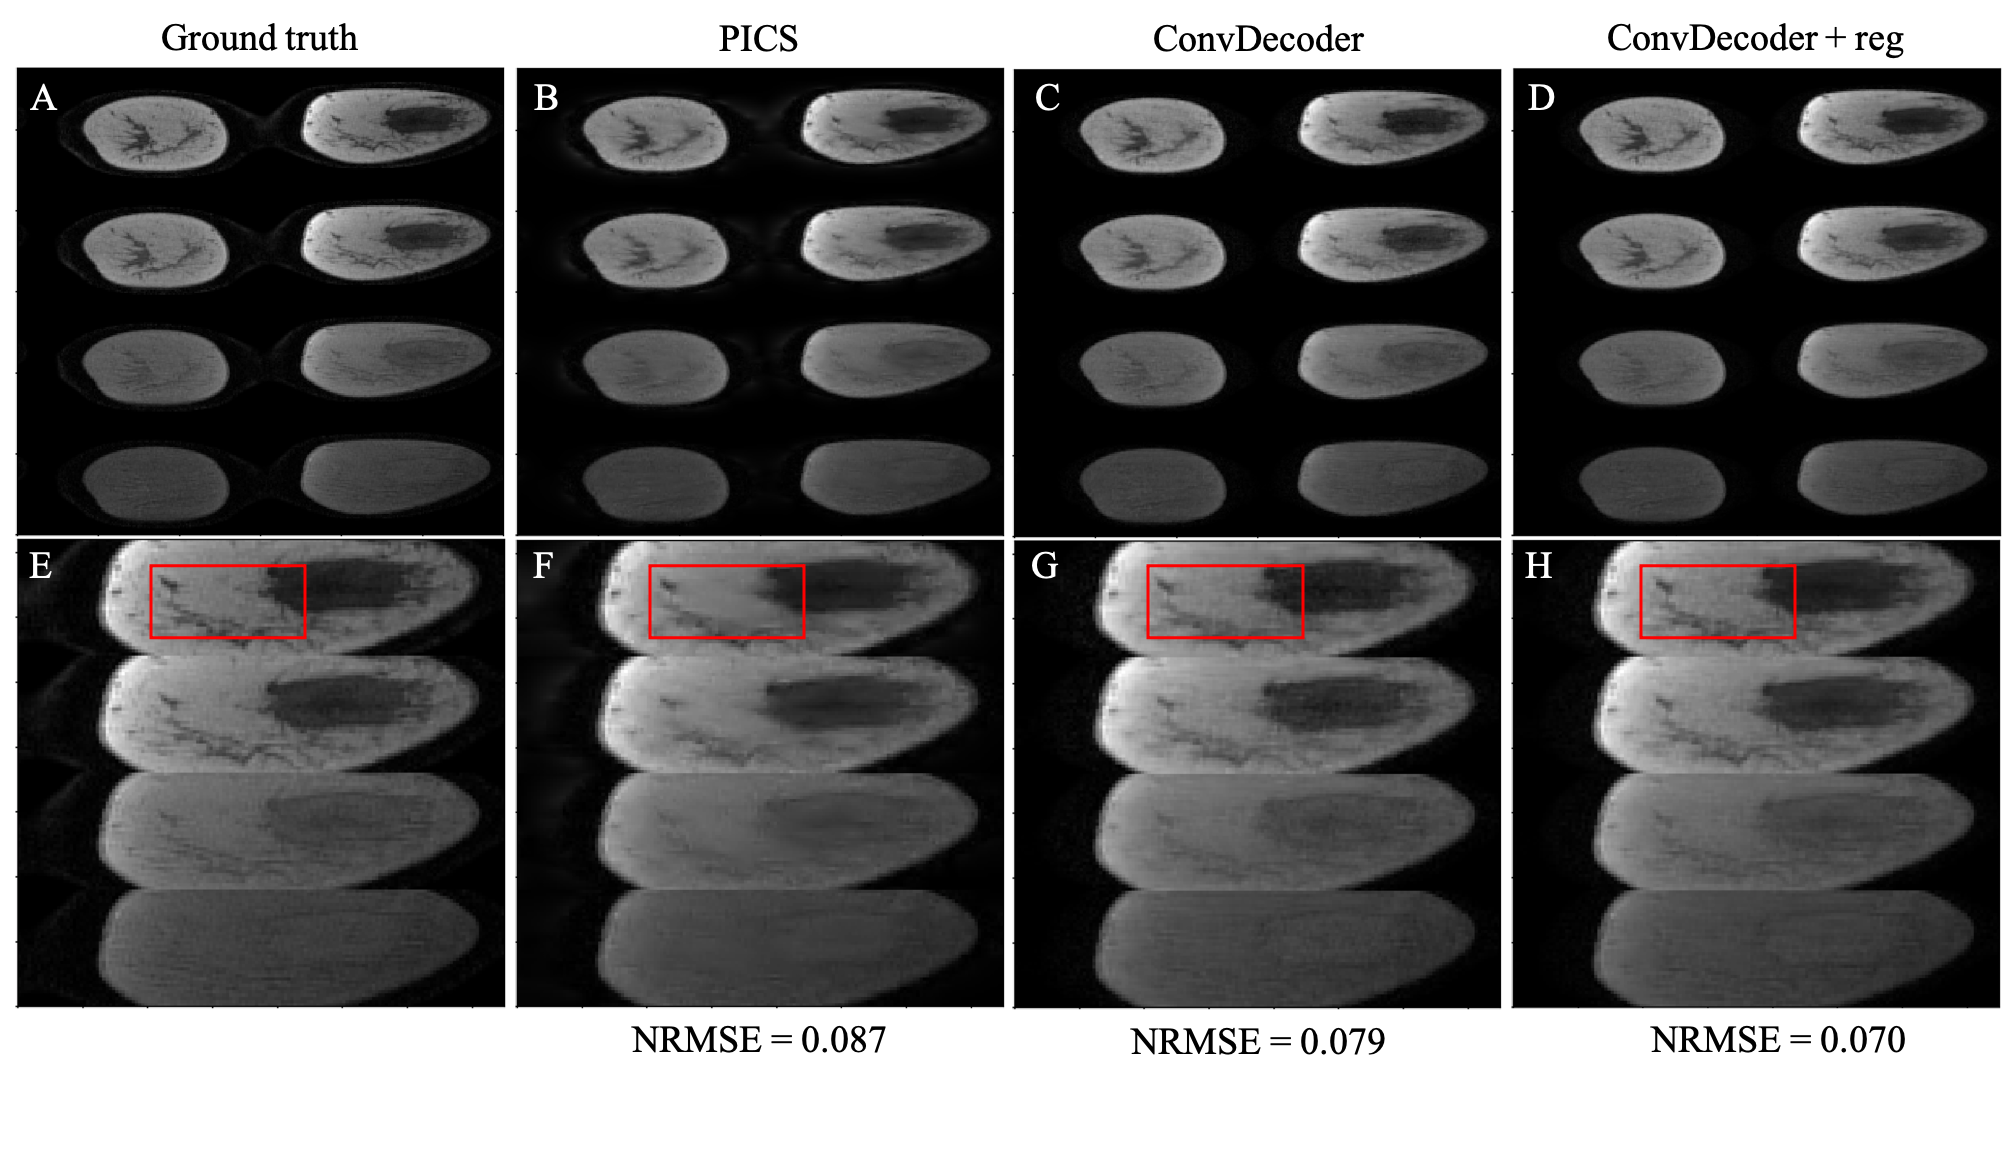
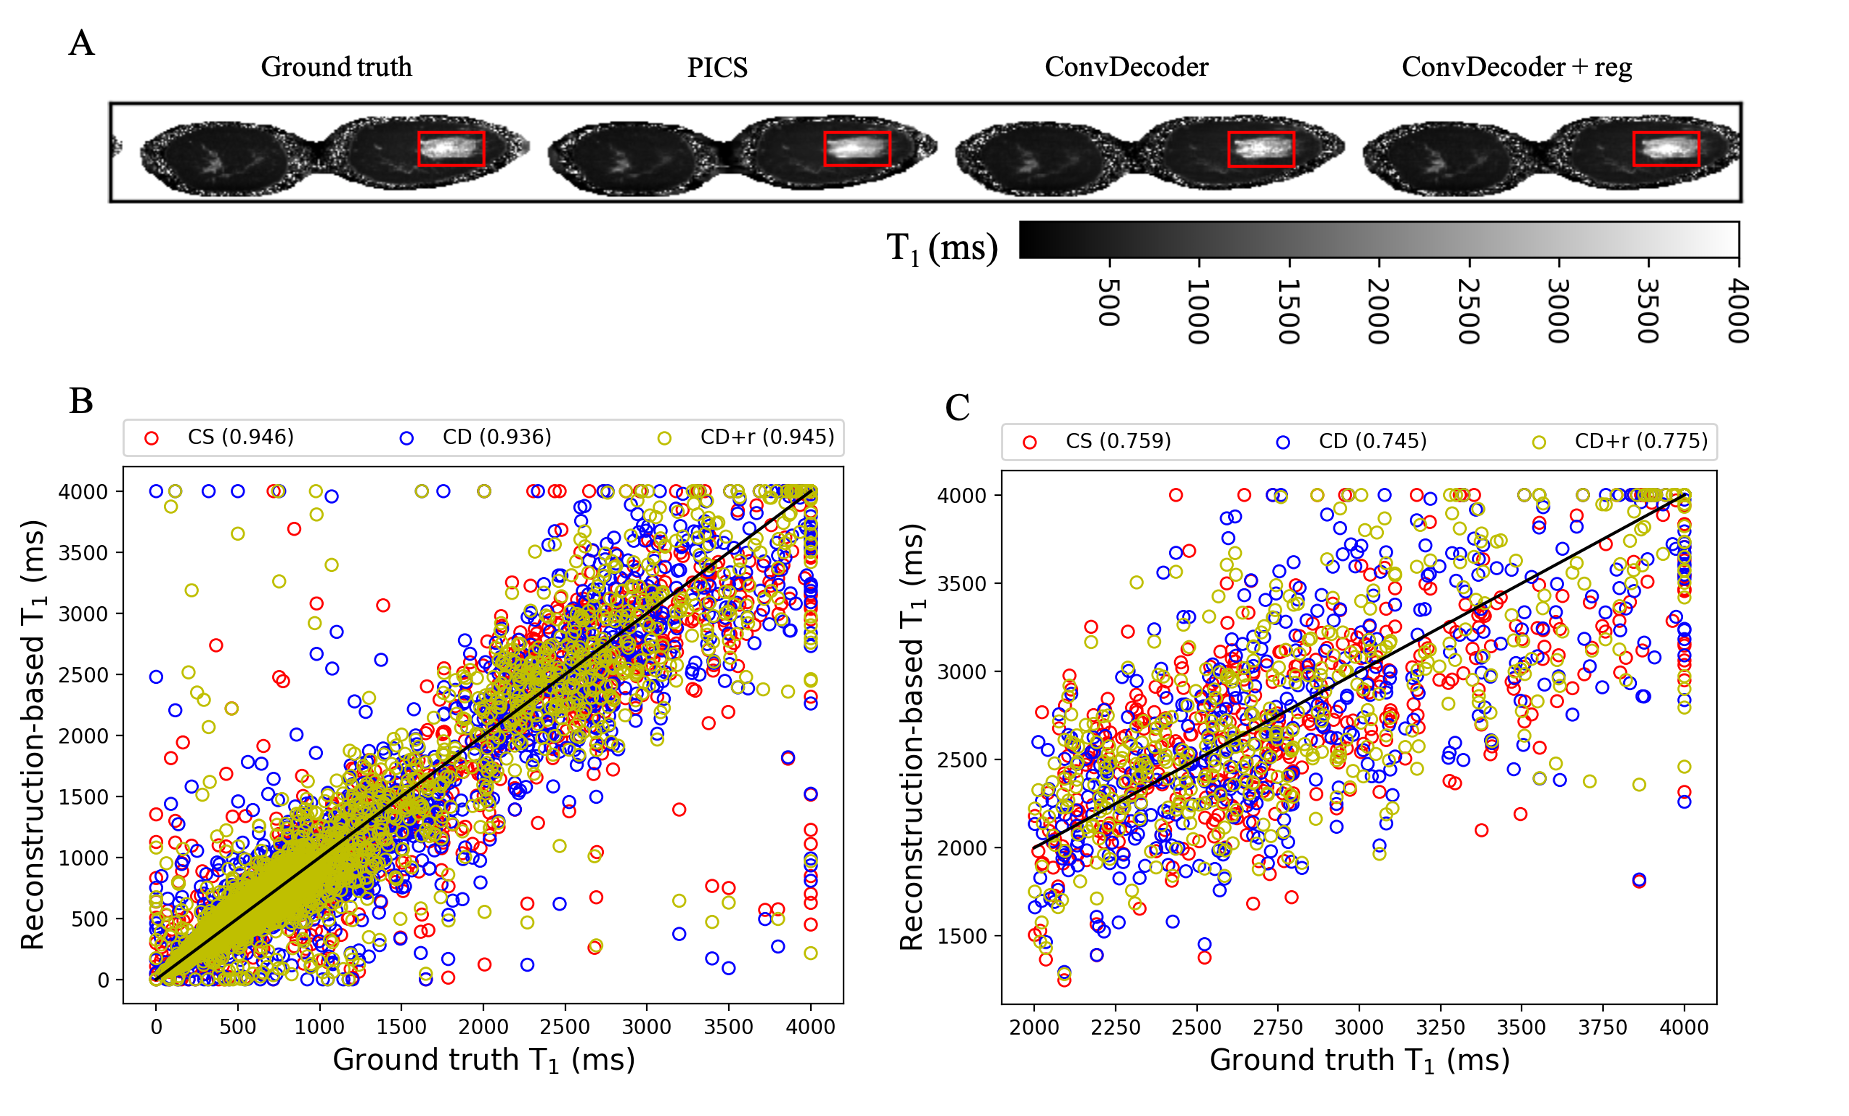
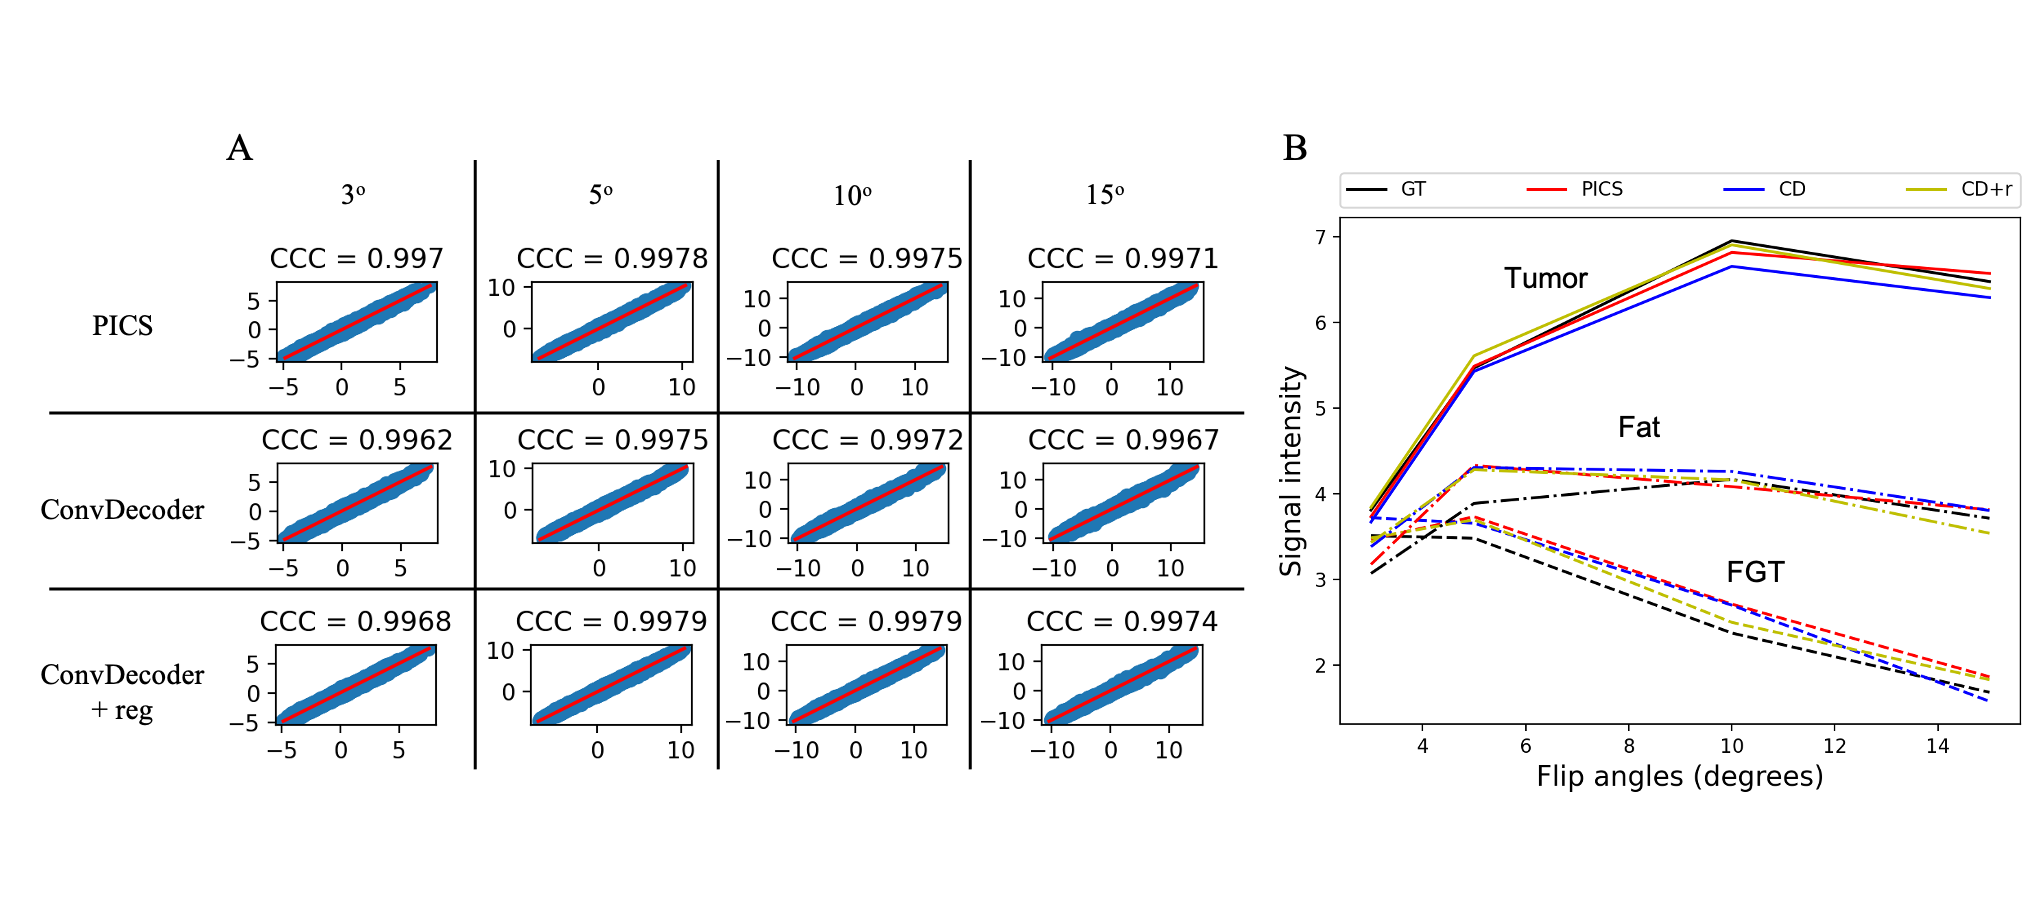
A comparison of the ground truth image and the reconstructed images from PICS, ConvDecoder, and ConvDecoder + reg is presented in Figure 1. A zoomed-in view of the right breast reveals subtle smoothing in the PICS recon to the left of the tumor (Fig.1.F) that is not present in the ConvDecoder and ConvDecoder + reg recons (Fig.1.G and H). The T1 maps corresponding to the ground truth, PICS, ConvDecoder, and ConvDecoder + reg images are presented in Figure 2 alongside scatter plots comparing voxel values for the entire tissue and tumor alone in Fig.2.B and Fig.2.C, respectively. While PICS yields a slightly higher CCC in Fig.2.B, ConvDecoder+reg (CCC=0.775) outperforms PICS (CCC=0.759) in the tumor. The CCCs for each flip angle and reconstruction scheme are presented in Figure 3, along with plots of representative voxels. The ConvDecoder + reg results in the last row of Fig.3.A show a slight outperformance (CCC = 0.998 overall) over the other methods. Fig.3.B emphasizes the importance of regularization along the dynamic dimension.Discussion and Conclusion
In this preliminary work, we demonstrated the first application of the ConvDecoder architecture with model-based regularization for reconstructing undersampled VFA data. We anticipate that optimization of the ConvDecoder+reg approach may further improve the quality and resolution of the images. Ongoing investigation to test this promising method include refined hyperparameter optimization of the ConvDecoder network, analysis of more patient datasets, investigation of other measures of reconstruction quality, and perfusion model-based regularization for DCE-MR image reconstruction with clinical analysis of resultant pharmacokinetic parameters.Acknowledgements
We thank the National Institutes of Health for funding through NCI U01CA142565, U01CA174706, R01CA218700, R01CA172801, and P30CA014599. We thank the Cancer Prevention and Research Institute of Texas for support through CPRIT RR160005. We offer a sincere thank you to all of the women who volunteer to participate in our studies; your strength and courage is a lesson for all of us. T.E.Y is a CPRIT Scholar in Cancer Research.References
[1] Wang HZ, Riederer SJ, & Lee JN. Optimizing the precision in T1 relaxation estimation using limited flip angles. Magn Reson Med. 1987;5(5):399-416. PMID: 3431401.
[2] Yankeelov TE & Gore JC. Dynamic Contrast Enhanced Magnetic Resonance Imaging in Oncology: Theory, Data Acquisition, Analysis, and Examples. Curr Med Imaging Review. 2009;3(2): 91-107.
[3] Sorace AG, Partridge SC, Li X, Virostko J, Barnes SL, Hippe DS, Huang W, & Yankeelov TE. Distinguishing benign and malignant breast tumors: preliminary comparison of kinetic modeling approaches using multi-institutional dynamic contrast-enhanced MRI data from the International Breast MR Consortium 6883 trial. Journal of Medical Imaging. 2018;5(1):011019.
[4] Darestani M, & Heckel R. (2020). Can Un-trained Neural Networks Compete with Trained Neural Networks at Image Reconstruction?. arXiv preprint. 2020. arXiv:2007.02471.
[5] Van Veen D, Jalal A, Soltanolkotabi M, Price E, Vishwanath S, & Dimakis AG. Compressed sensing with deep image prior and learned regularization. arXiv preprint. 2018; arXiv:1806.06438.
[6] Ulyanov D, Vedaldi A, & Lempiitsky V. Deep Image Prior. arXiv preprint. 2017; arXiv:1711.10925.
[7] Heckel R & Hand P. Deep Decoder: Concise Image Representations from Untrained Non-convolutional Networks. arXiv preprint. 2018; arXiv:1810.03982.
[8] Guo S, Noll DC, Fessler JA. Dictionary-Based Oscillating Steady State fMRI Reconstruction. In: Proc. Intl. Soc. Mag. Reson. Med. 27 (2019); Montreal, CA; Abstract 1253.
[9] BART Toolbox for Computational Magnetic Resonance Imaging, doh: 10.5281/zenodo.592960
[10] Uecker M, Lai P, Murphy MJ, Virtue P, Elad M, Pauly JM, Vasanawala SS, & Lustig M. ESPIRiT--an eigenvalue approach to autocalibrating parallel MRI: where SENSE meets GRAPPA. Magn Reson Med. 2014;71(3):990-1001.
[11] Tamir JI, Yu SX, & Lustig M. DeepInPy: Deep Inverse Problems in Python. In: ISMRM Workshop on Data Sampling and Image Reconstruction (2020); Sedona, AZ, USA.
[12] Ma D, Gulani V, Seiberlich N, Liu K, Sunshine JL, Duerk JL, Griswold MA. Magnetic Resonance Fingerprinting. Nature 495, no. 7440 (2013). doi:10.1038/nature11971.
Figures