1240
Optimising multi-contrast MRI experiment design using concrete autoencoders1Image Sciences Institute, University Medical Center Utrecht, Utrecht, Netherlands, 2CUBRIC, Cardiff University, Cardiff, United Kingdom, 3Google Brain, Montreal, QC, Canada, 4Department of Radiology and Nuclear Medicine, St. Olav's University Hospital, Trondheim, Norway, 5Centre for Medical Engineering, King's College London, London, United Kingdom, 6SCIL, University of Sherbrooke, Sherbrooke, QC, Canada
Synopsis
Multi-contrast MRI provides a comprehensive picture of tissue microstructure, but the high dimensionality of the parameter space increases scan time. In this work, we present a data-driven approach to multi-contrast MRI experiment design using concrete autoencoders. Concrete autoencoders simultaneously perform measurement subset-selection and learn a prediction of the full set of measurements. This approach was evaluated on two multi-contrast databases encoding diffusion, relaxation, and susceptibility. The results showed similar patterns of measurement-subset selection and mean-squared errors across different training sets. The increasing availability of public multi-contrast MRI databases can further push data-driven approaches in providing recommendations for experiment design.
Introduction
Quantitative MRI aims to extract reproducible measures that can be studied across populations and longitudinally. Typically, distinct MRI experiments are performed to probe each individual phenomenon (e.g. diffusion, relaxation, and susceptibility), but each MRI contrast provides only part of the picture. In contrast, the simultaneous variation of multiple experimental variables can optimally exploit their joint and complementary information1. However, as the dimensionality of the accessible MRI-acquisition space increases, acquisition times become prohibitive. Most approaches to MRI experiment design take a ‘top-down' strategy where the acquisition protocol is optimized to maximise parameter precision assuming a presupposed set of tissue properties2-5. In this work, we instead explore a 'bottom-up' approach to MRI experimental design by casting it as a feature selection (i.e. measurement-subset selection) problem, using unsupervised machine learning on multi-contrast databases encoding diffusion, relaxation, and susceptibility.Methods
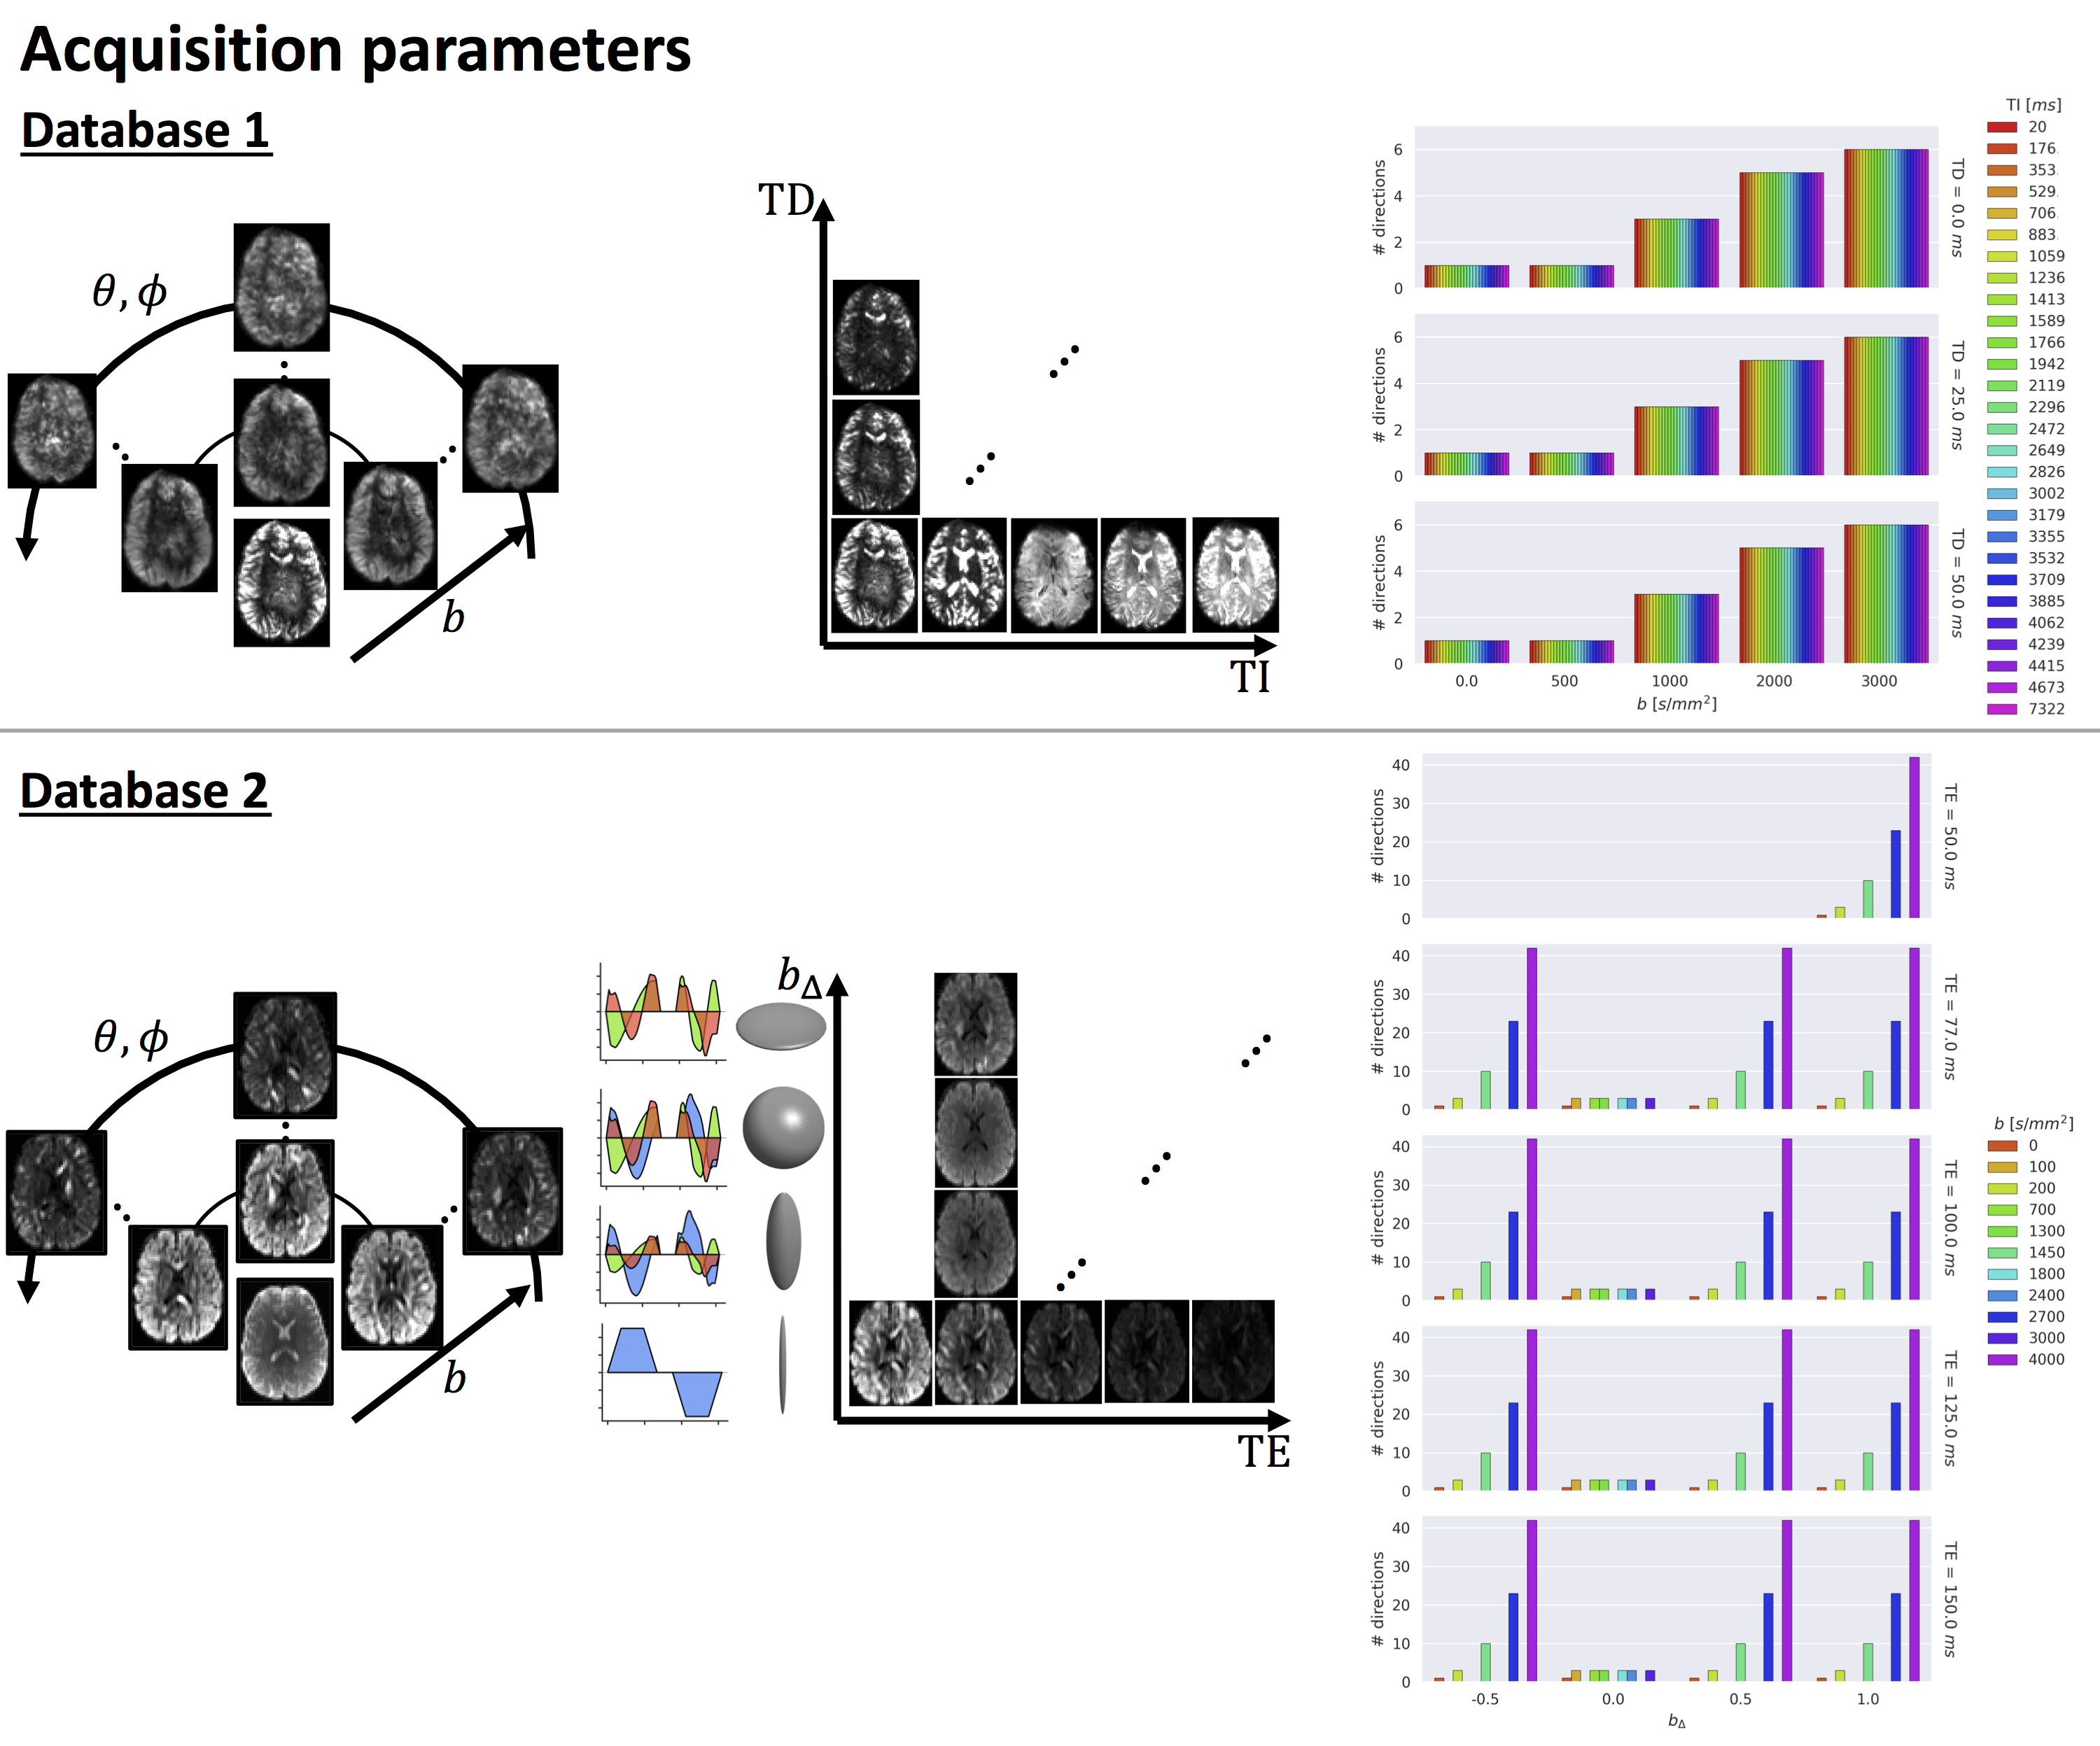
DataThe proposed approach is tested on the databases depicted in Fig.1:
- Database 1: Five healthy controls scanned on 3T 40mT/m with a 5D Diffusion-T1-T2* protocol varying b-value, gradient direction (θ,φ), inversion time TI, and delay time TD in an asymmetric spin echo6,7 (1344 unique settings);
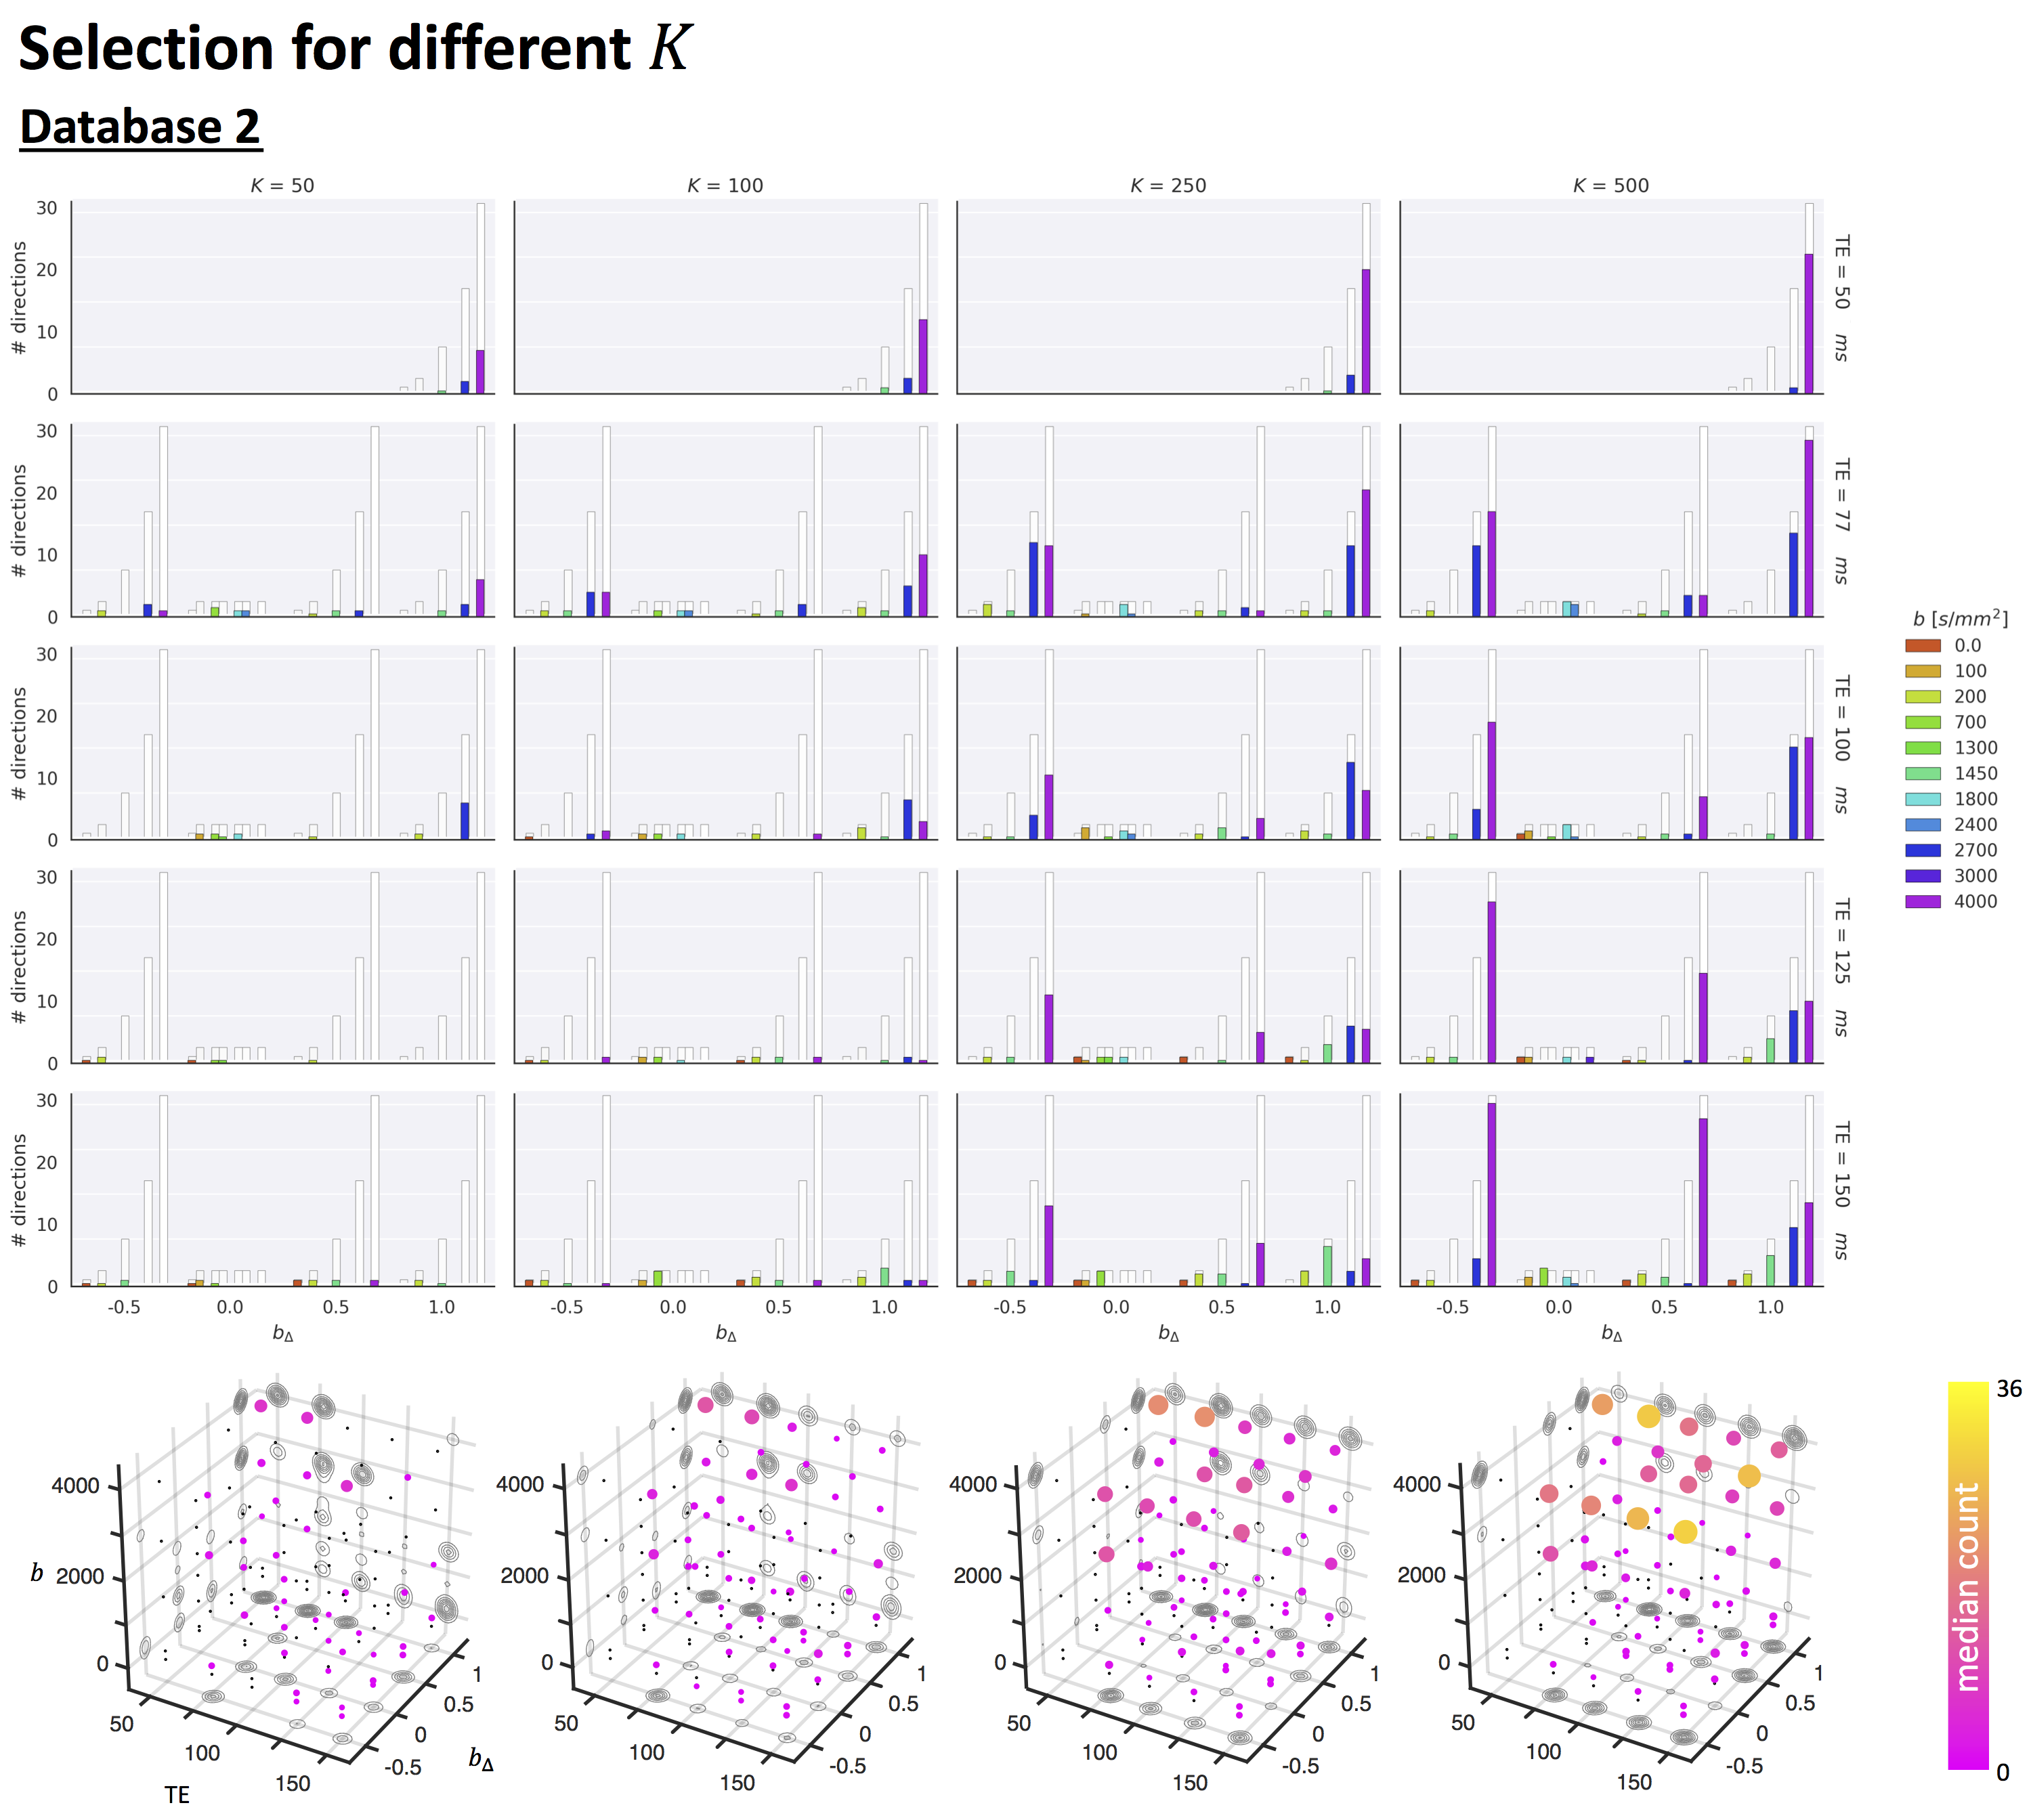
- Database 2: Four healthy controls scanned on a 3T 300mT/m system with a 5D Diffusion-T2 protocol varying b, symmetry axis of the b-tensor (θ,φ), echo time TE and diffusion-encoding waveforms yielding b-tensors of varying “shapes” b∆ including linear, planar, cigar, and spherical8,9 (1103 unique settings).
Both databases were preprocessed as described previously7,10 with additional correction for gradient non-linearity distortions in the latter. A global scaling factor between each subject and the first subject in a database was estimated from the median b=0 s/mm2 images, and intensities were subsequently divided by the 95th-percentile intensity of subject 1.
Unsupervised learning
An autoencoder neural network was trained with a ‘concrete selector layer’ as the first layer, based on the principle of concrete random variables as a relaxation of discrete random variables11,12. This layer has a user-specified number of nodes (defining the maximum number of selected measurements K= [500,250,100,50]) and selects stochastic linear combinations of input features during training. When the temperature of this layer approaches zero using an annealing scheme, this converges to a discrete set of features. The decoder aims to reconstruct all the features and can be arbitrarily complex. Measurement subset selection in database1/database2 was performed with a 2-layer decoder (800+1000 nodes) with Leaky ReLu and a gradual exponential decrease of the temperature from 10 to 0.1 over 2000/8000 epochs. Both networks were trained based on leave-one-out cross-validation over all subjects using the Adam optimiser13 with learning rate 0.001, batch size 256, and mean-squared error (MSE) loss.
Results
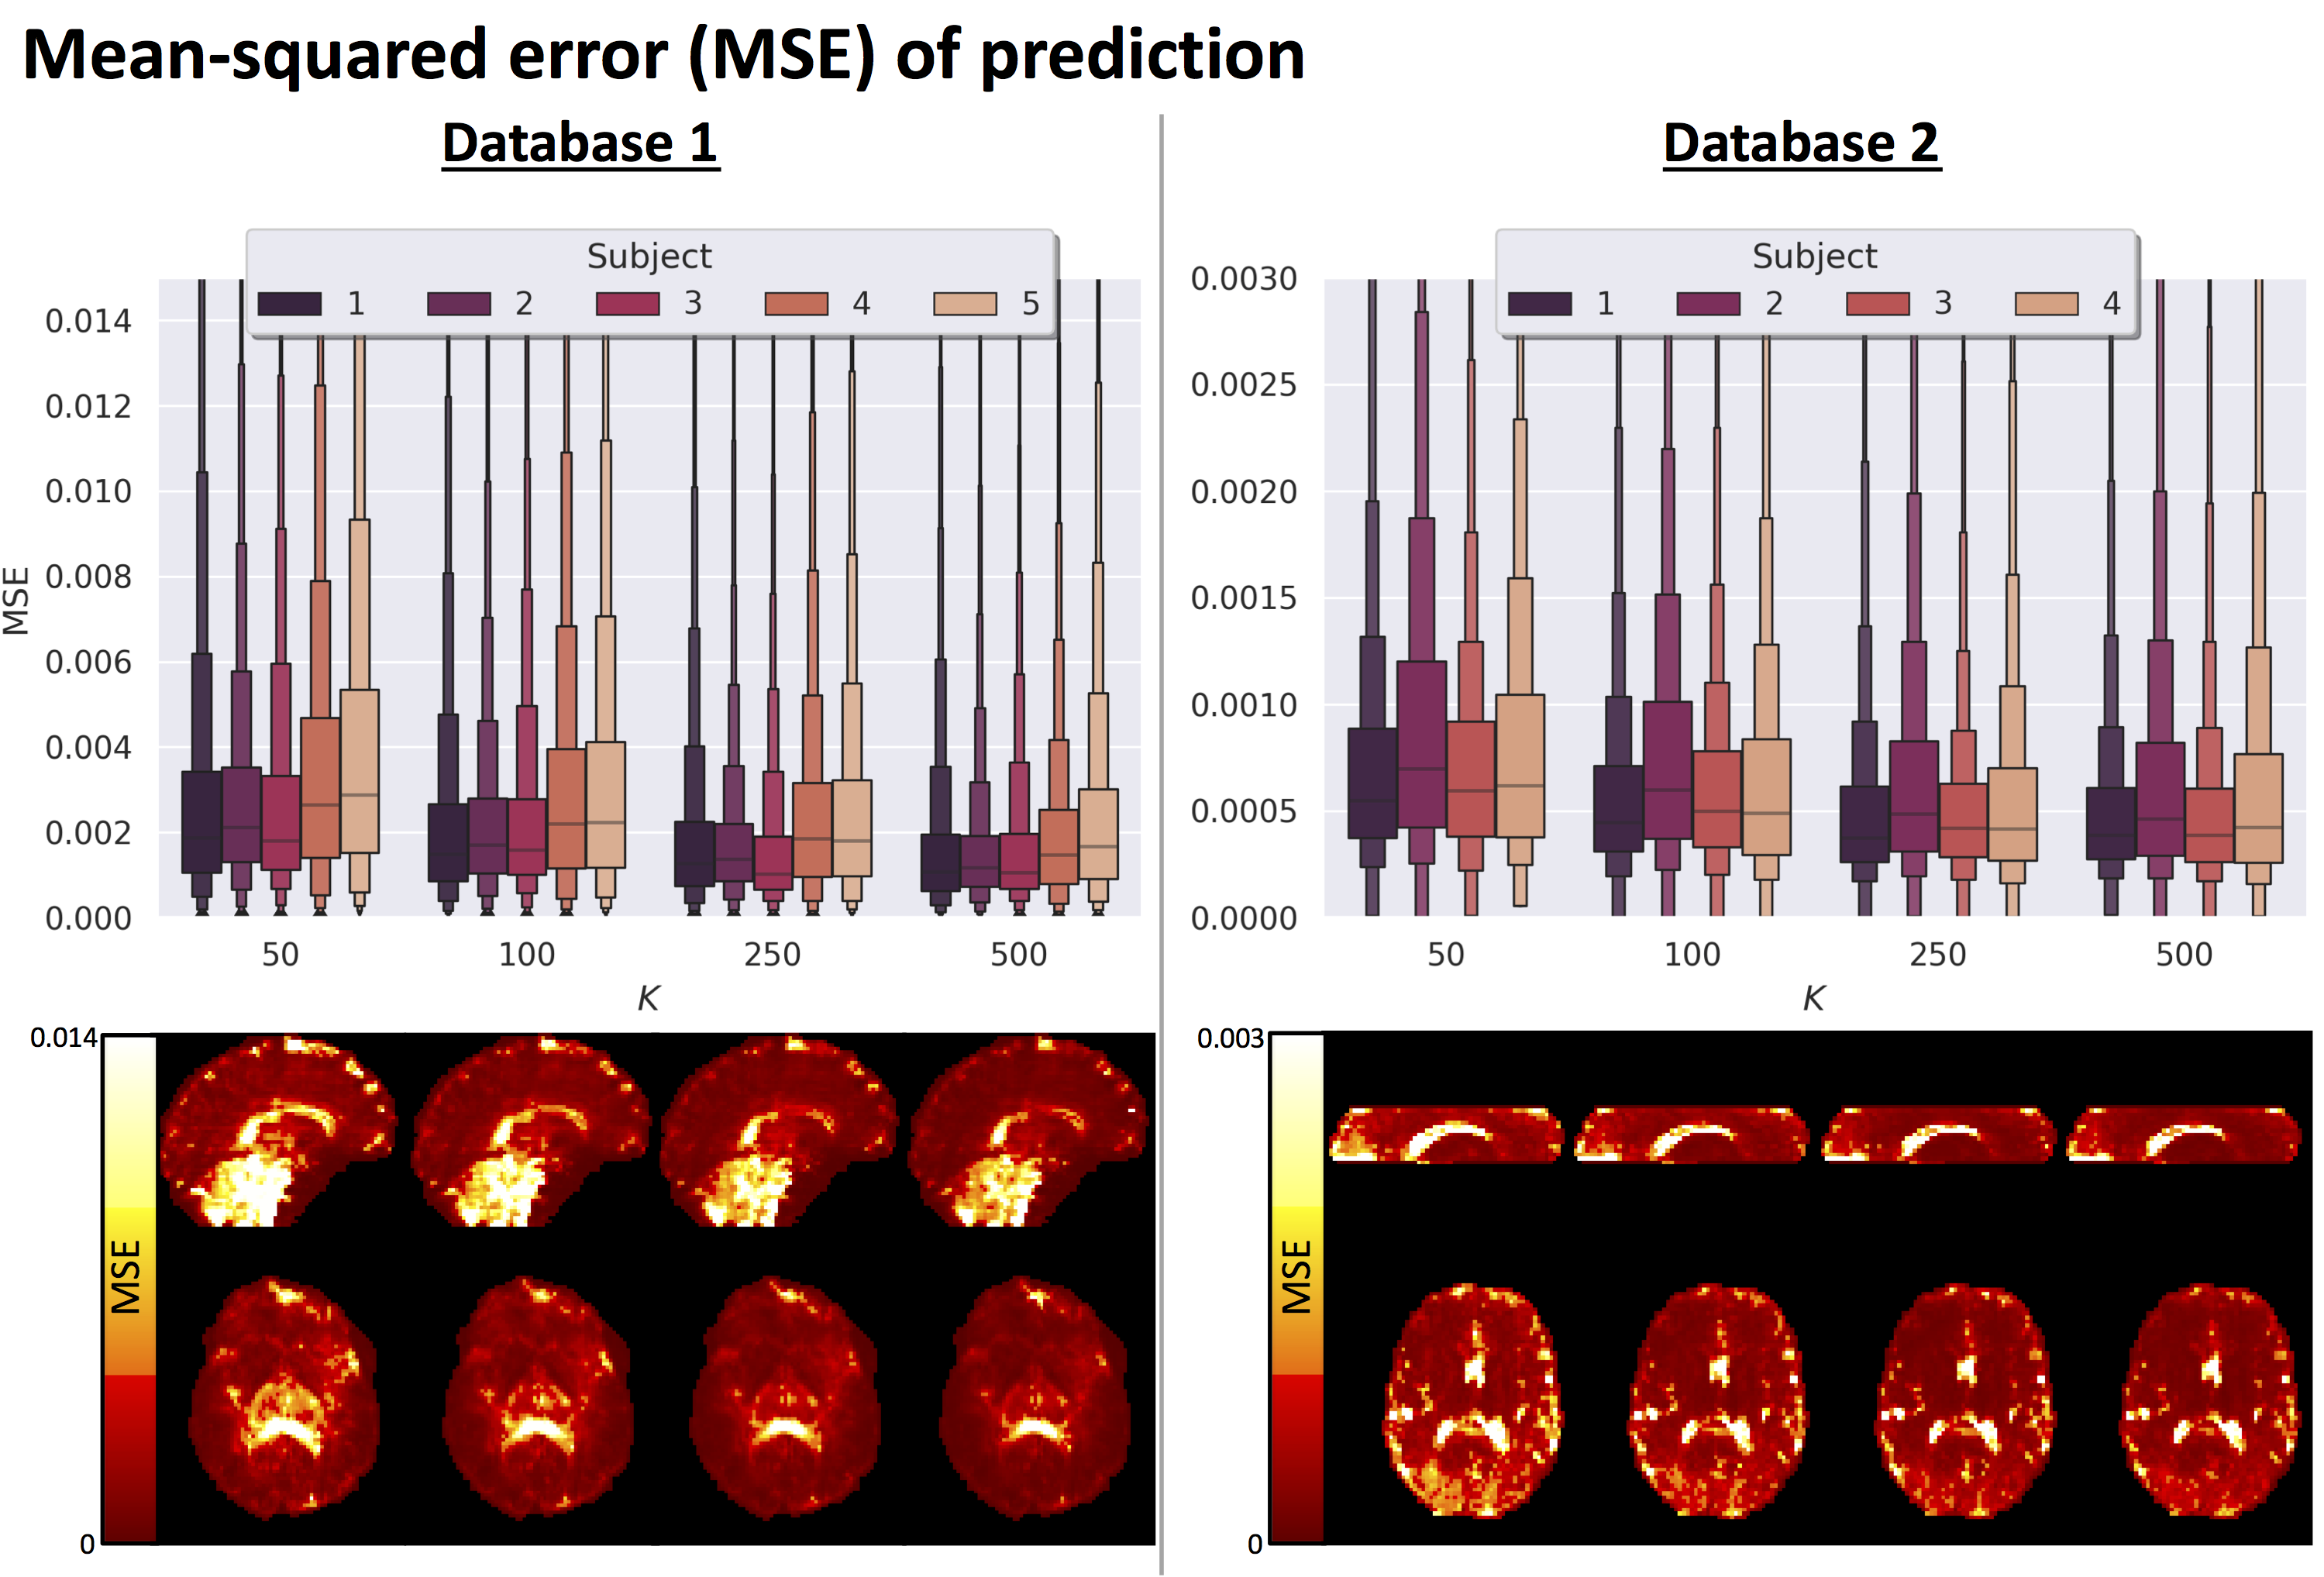
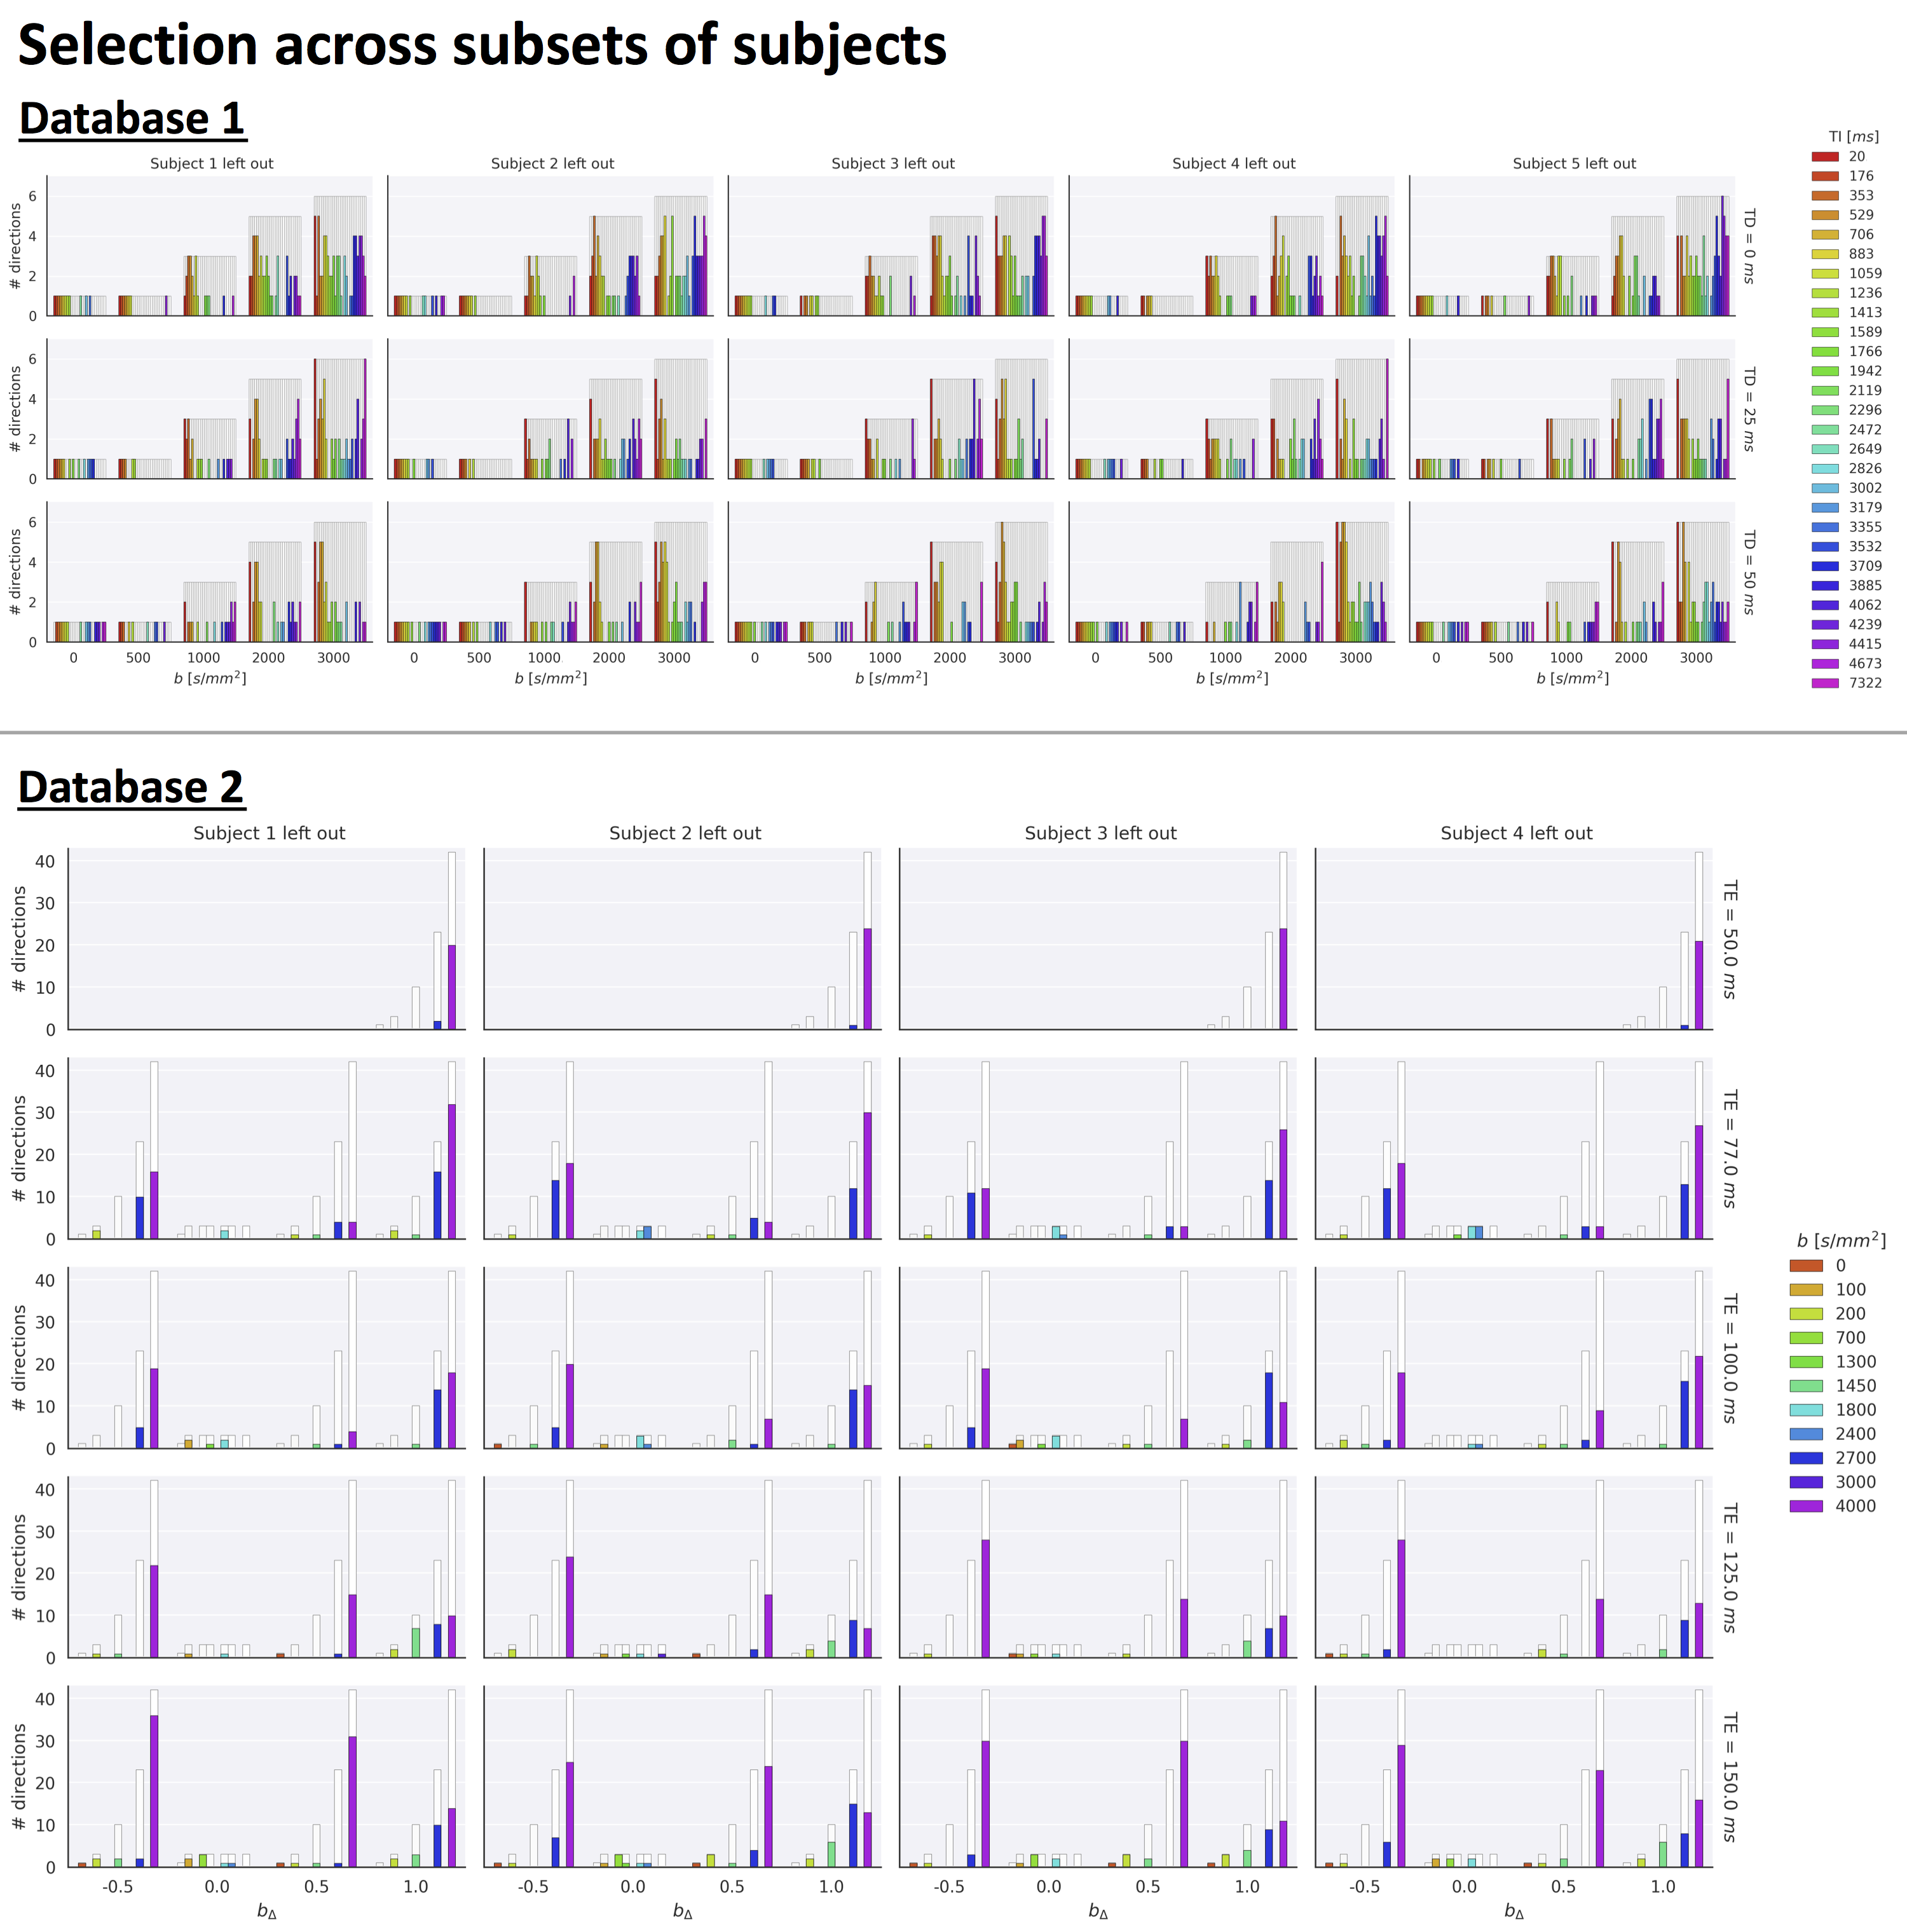
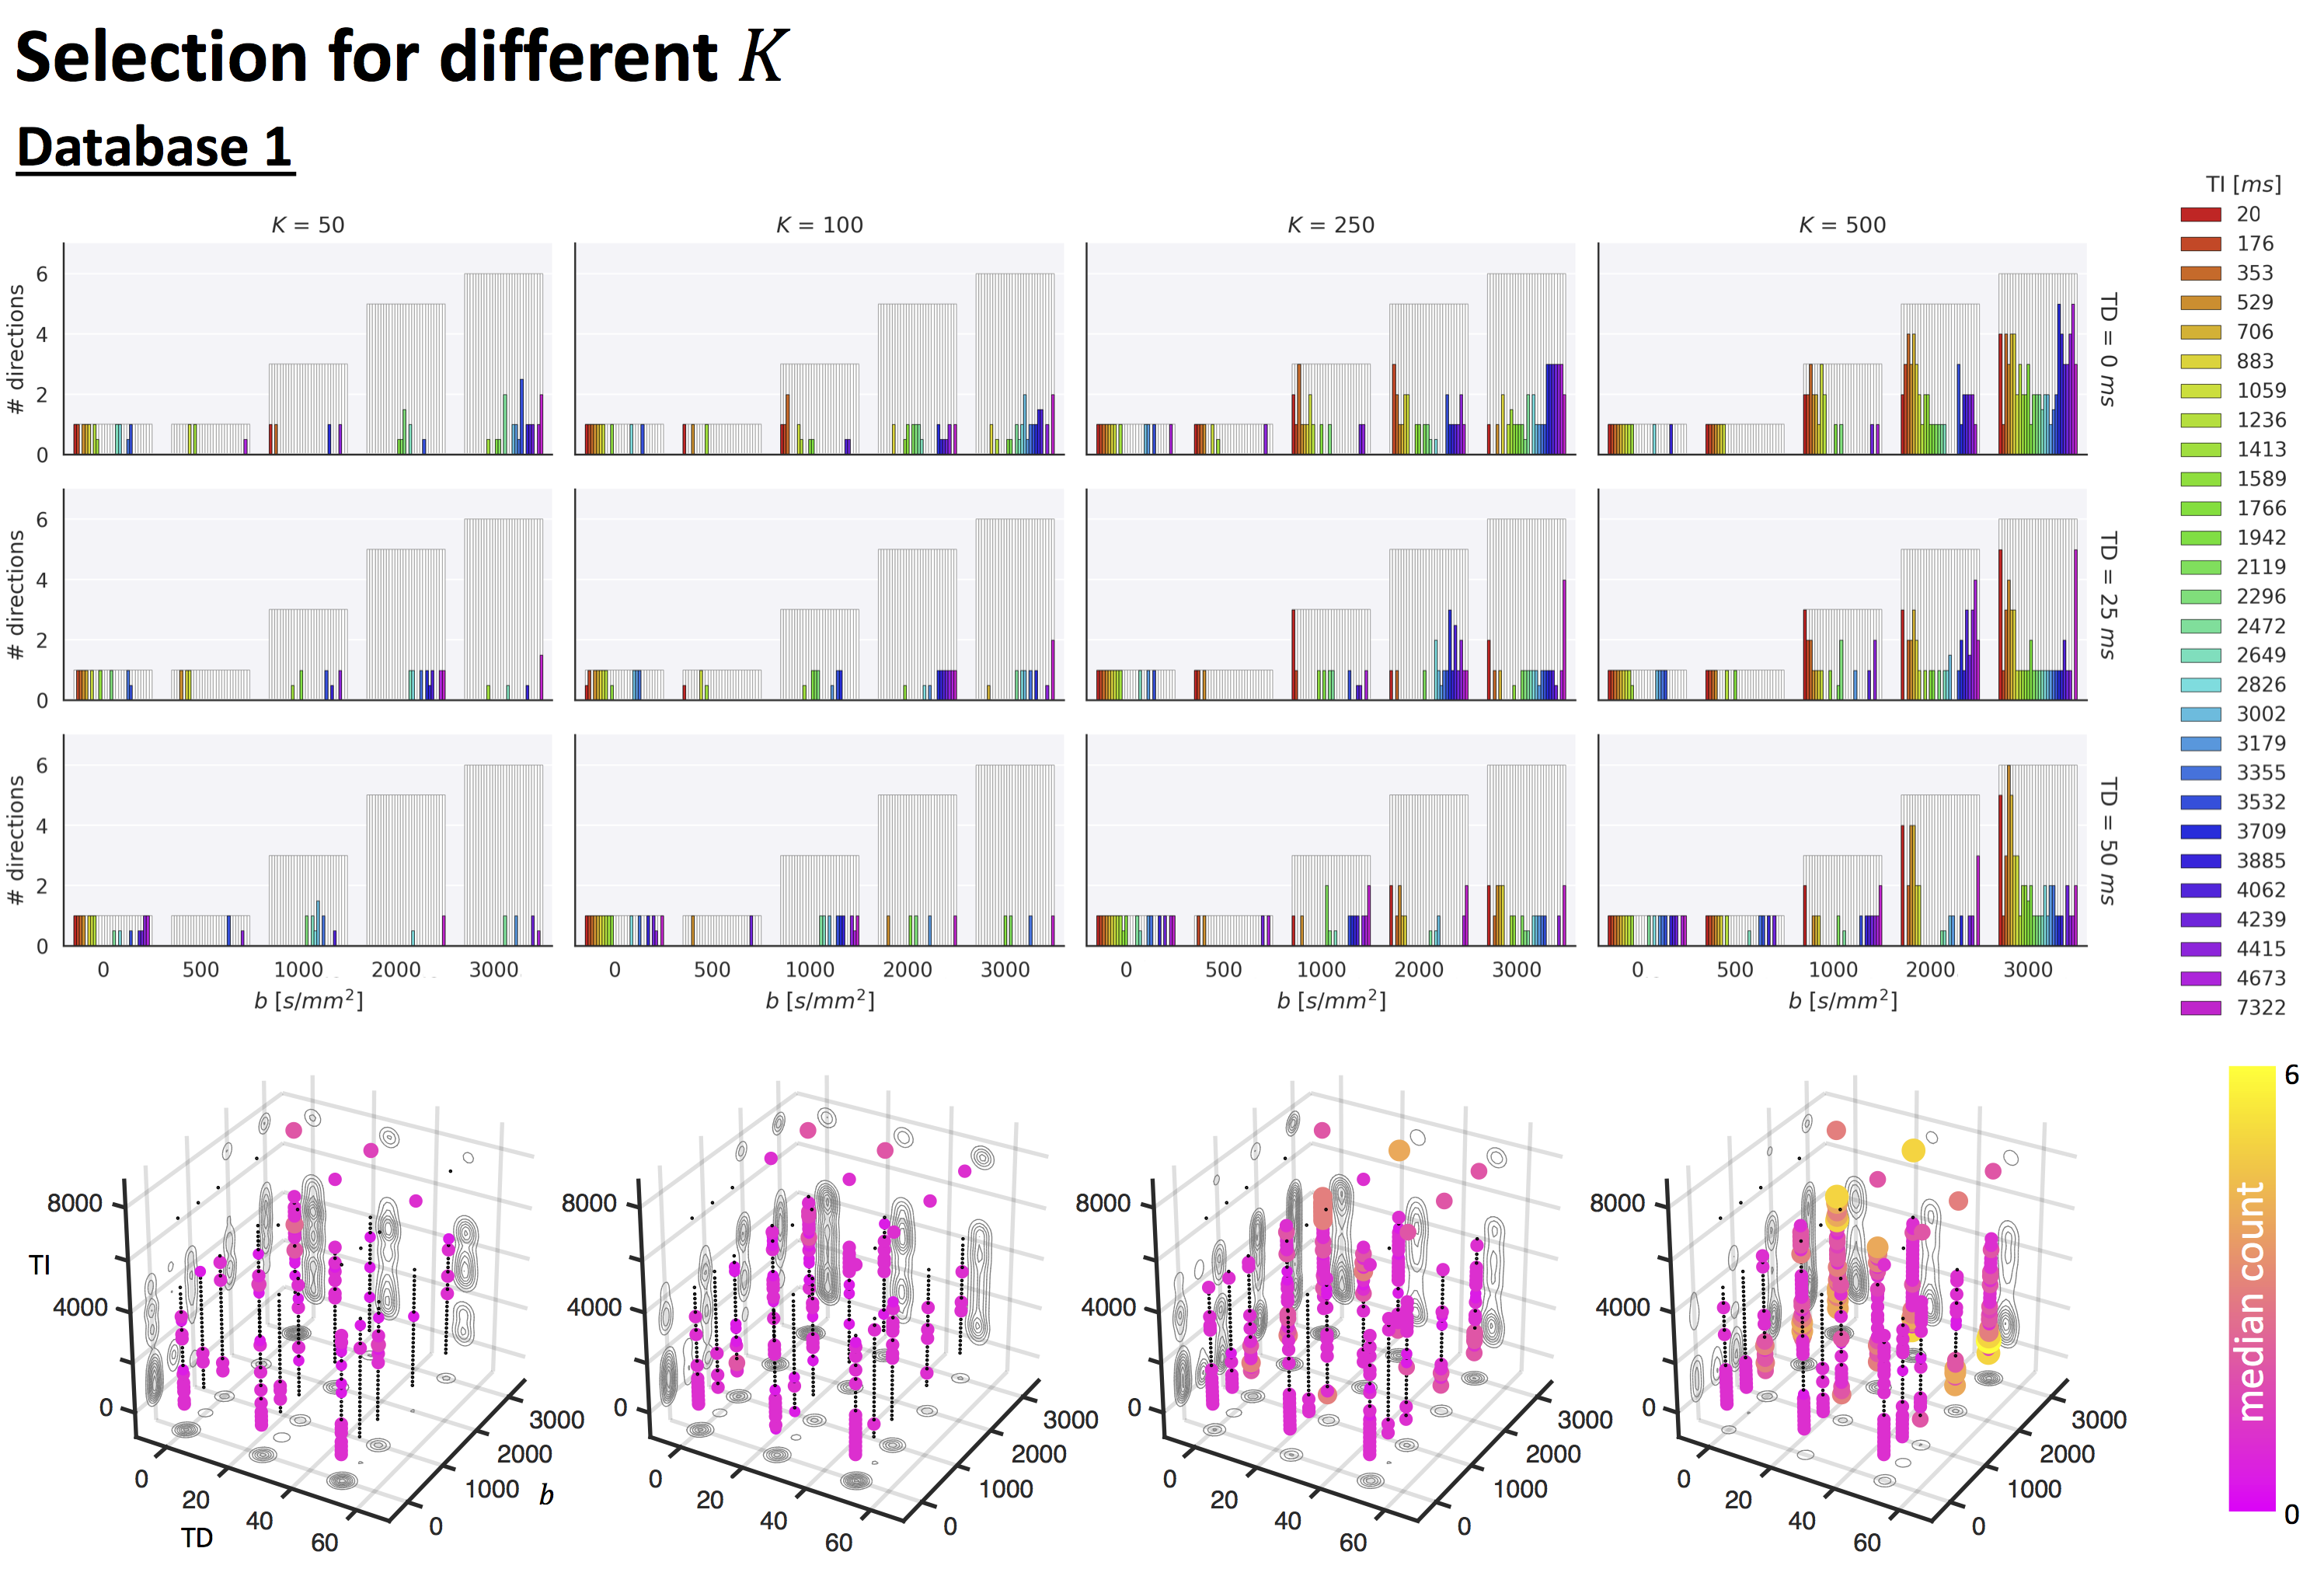
Fig.2 top shows the MSE distribution on the subject left out of the feature selection and training, revealing a decrease when K increases across all subjects. Cerebral white and gray matter generally have lower MSE than partial-volume regions with CSF and cerebellar tissue. Reducing K from 500 to [250,100,50] increases the median MSE across subjects by [14,43,76]% for database1 and [3,23,48]% for database2, respectively. Fig.3 shows similar patterns in the selected features (histograms) following the leave-one-out experiment. Figs.4 and 5 show the median counts for varying K for database1/database2 respectively. Higher b-values are often selected likely because of higher angular contrast in WM (particularly at the lowest TD/TE) and when reducing K the redundancy in gradient directions is exploited. In database1, the lowest and highest TI are favoured over intermediate TI, while the counts across TD appear more equally divided. In database2, a range of b∆ and b is selected across TE, and the selection of b∆=-0.5 is more frequent than the selection of b∆=0.5. When reducing K below 250, primarily b∆=1 measurements are selected.Discussion and Conclusion
We demonstrate the feasibility of a 'bottom-up' approach to experimental design that does not rely on prior tissue-structure assumptions but instead is data-driven. Our results suggest that measurements could be accurately predicted from a subset of measurements optimised using concrete autoencoders, and previous work has demonstrated an increased accuracy compared to alternative (unsupervised) feature selection approaches7,11. Relatively higher MSE was observed in and near the ventricles potentially due to local image-misalignment e.g. resulting from cardiac pulsation. The higher MSE in certain tissue sub-types (e.g. cerebellar tissue) suggests that the optimal measurement subset may be tissue-specific, which will be further explored. Future work will furthermore investigate the implications of subsampling on parameter estimates, e.g. diffusivities and relaxation times14. The increasing availability of public multi-dimensional MRI databases, new hardware, and improved acquisition methodology can further push data-driven optimization approaches in exploring a wider parameter-space and providing generalised recommendations15. We expect that advances in network structures and data augmentation can further improve the performance of the proposed framework.Acknowledgements
CMWT was supported by a Veni grant (17331) from the Dutch Research Council (NWO) and a Sir Henry Wellcome Fellowship (215944/Z/19/Z). JH was supported by a UKRI FLF (MR/T018119/1). JPAM gratefully acknowledges support from the Research Council of Norway (FRIPRO Researcher Project 302624).References
[1] M. Cercignani, S. Bouyagoub, Brain microstructure by multi-modal MRI: Is the whole greater than the sum of its parts?, NeuroImage 182(2018) 117 – 127.
[2] D. C. Alexander, A general framework for experiment design in diffusion MRI and its application in measuring direct tissue-microstructure features, Magnetic Resonance in Medicine 60 (2) (2008) 439–448.
[3] S. Coelho, J. M. Pozo, S. N. Jespersen, A. F. Frangi, Optimal experimental design for biophysical modelling in multidimensional diffusion MRI, in: D. Shen, T. Liu, T. M. Peters, L. H. Staib, C. Essert, S. Zhou,P.-T. Yap, A. Khan (Eds.), Medical Image Computing and ComputerAssisted Intervention – MICCAI 2019, Springer International Publish-ing, Cham, 2019, pp. 617–625.
[4] B. Lampinen, F. Szczepankiewicz, J. M ̊artensson, D. van Westen,O. Hansson, C.-F. Westin, M. Nilsson, Towards unconstrained compartment modeling in white matter using diffusion-relaxation MRI with tensor-valued diffusion encoding, Magnetic Resonance in Medicine 84 (3)(2020) 1605–1623.
[5] H. Knutsson, Towards optimal sampling in diffusion MRI, in: Interna-tional Conference on Medical Image Computing and Computer-AssistedIntervention, Springer, 2019, pp. 3–18.
[6] J. Hutter, P. J. Slator, D. Christiaens, R. P. A. Teixeira, T. Roberts,L. Jackson, A. N. Price, S. Malik, J. V. Hajnal, Integrated and efficient diffusion-relaxometry using ZEBRA, Scientific reports 8 (1) (2018) 1–13.4
[7] M. Pizzolato, M. Palombo, E. Bonet-Carne, C. M. W. Tax, F. Grussu, A. Ianus, F. Bogusz, T. Pieciak, L. Ning, H. Larochelle, et al., Acquiring and predicting multidimensional diffusion (MUDI) data: An open challenge (2020) 195–208.
[8] J. P. de Almeida Martins, C. M. W. Tax, F. Szczepankiewicz, D. K. Jones, C.-F. Westin, D. Topgaard, Transferring principles of solid-stateand laplace nmr to the field of in vivo brain mri, Magnetic Resonance1 (1) (2020) 27–43. doi:10.5194/mr-1-27-2020.
[9] C. M. W. Tax, J. P. de Almeida Martins, F. Szczepankiewicz, C. F. Westin, M. Chamberland, D. Topgaard, D. K. Jones, From physical chemistry to human brain biology: unconstrained inversion of 5-dimensional diffusion-T2 correlation data, in: ISMRM, 2018, p. 1101.
[10] J. de Almeida Martins, C. M. W. Tax, A. Reymbaut, F. Szczepankiewicz,M. Chamberland, D. Jones, D. Topgaard, Computing and visualising intra-voxel orientation-specific relaxation–diffusion features in the human brain, Human Brain Mapping (2020).
[11] A. Abid, M. F. Balin, J. Zou, Concrete Autoencoders for Differen-tiable Feature Selection and Reconstruction, 36th International Con-ference on Machine Learning, ICML 2019 2019-June (2019) 694–711.arXiv:1901.09346.
[12] C. J. Maddison, A. Mnih, Y. W. Teh, The Concrete Distribution: AContinuous Relaxation of Discrete Random Variables, 5th InternationalConference on Learning Representations, ICLR 2017 - Conference TrackProceedings (nov 2016). arXiv:1611.00712.
[13] D. P. Kingma, J. Ba, Adam: A Method for Stochastic Optimization,Proceedings of the 3rd International Conference on Learning Representations (ICLR) (dec 2014). arXiv:1412.6980.
[14] V. Golkov, A. Dosovitskiy, J. I. Sperl, M. I. Menzel, M. Czisch,P. S ̈amann, T. Brox, D. Cremers, Q-space deep learning: twelve-foldshorter and model-free diffusion mri scans, IEEE transactions on medi-cal imaging 35 (5) (2016) 1344–1351.
[15] F. Grussu, S. B. Blumberg, M. Battiston, L. S. Kakkar, H. Lin,A. Ianu ̧s, T. Schneider, S. Singh, R. Bourne, S. Punwani, D. Atkinson, C. A. M. Gandini Wheeler-Kingshott, E. Panagiotaki, T. Mertzanidou,D. C. Alexander, “select and retrieve via direct upsampling”network (sardu-net):a data-driven, model-free, deep learning approach for quantitative MRI protocol design, bioRxiv (2020). doi:10.1101/2020.05.26.116491.
[16] S. Eriksson, S. Lasiˇc, M. Nilsson, C.-F. Westin, D. Topgaard, NMR diffusion-encoding with axial symmetry and variable anisotropy: Distinguishing between prolate and oblate microscopic diffusion tensors with unknown orientation distribution, The Journal of Chemical Physics142 (10) (2015) 104201.
Figures