1110
Simulation and clinical validation of an algorithm for retrospective Arterial Input Function peak saturation correction1IADI, Inserm U1254, Université de Lorraine, Nancy, France, 2CIC-IT, Inserm 1433, Université de Lorraine and CHRU Nancy, Nancy, France, 3Pôle cardiologie, CHRU Nancy, Nancy, France
Synopsis
Arterial Input Function (AIF) is fundamental for quantitative perfusion analysis. However, AIF peak is underestimated when using common perfusion sequence such SR-turboFLASH due to signal saturation effect. This leads to biased perfusion parameters estimation. Accurate AIF sampling requires specific sequence or protocol imaging not widely available. We proposed a solution to correct AIF peak retrospectively from standard perfusion data. We evaluated the proposed algorithm in simulation on more than 90000 different AIF sampling scenarios. Eventually, we tested our algorithm on clinical data and compared the population AIF estimated from our solution to literature population AIF.
Introduction
Quantitative perfusion analysis is very promising for diffuse fibrosis diagnostic especially in cardiac MRI[1]. Arterial Input Function (AIF) stands as a crucial step into quantitative perfusion study [2]. The use of classical perfusion sequences such SR-TurboFLASH is met with signal saturation when the contrast agent concentration ([CA]) is high[3]. This phenomenon yields to an inaccurate measurement of the blood pool signal where the [CA] is the highest and eventually yields to an underestimation of the AIF peak. In fine, this leads to biased perfusion parameters estimation[4]. Adapted acquisition sequence such dual sequence [5] or adapted injection protocol such dual bolus [6] have been proposed to ensure a proper sampling of the AIF. Although these solutions are still discussed they and require imaging sequences/protocols not always available or manageable in all institutions. The goal of this work is to propose a solution to correct retrospectively the underestimation of the AIF peak when using common perfusion sequence which would enable quantitative perfusion analysis.Methods
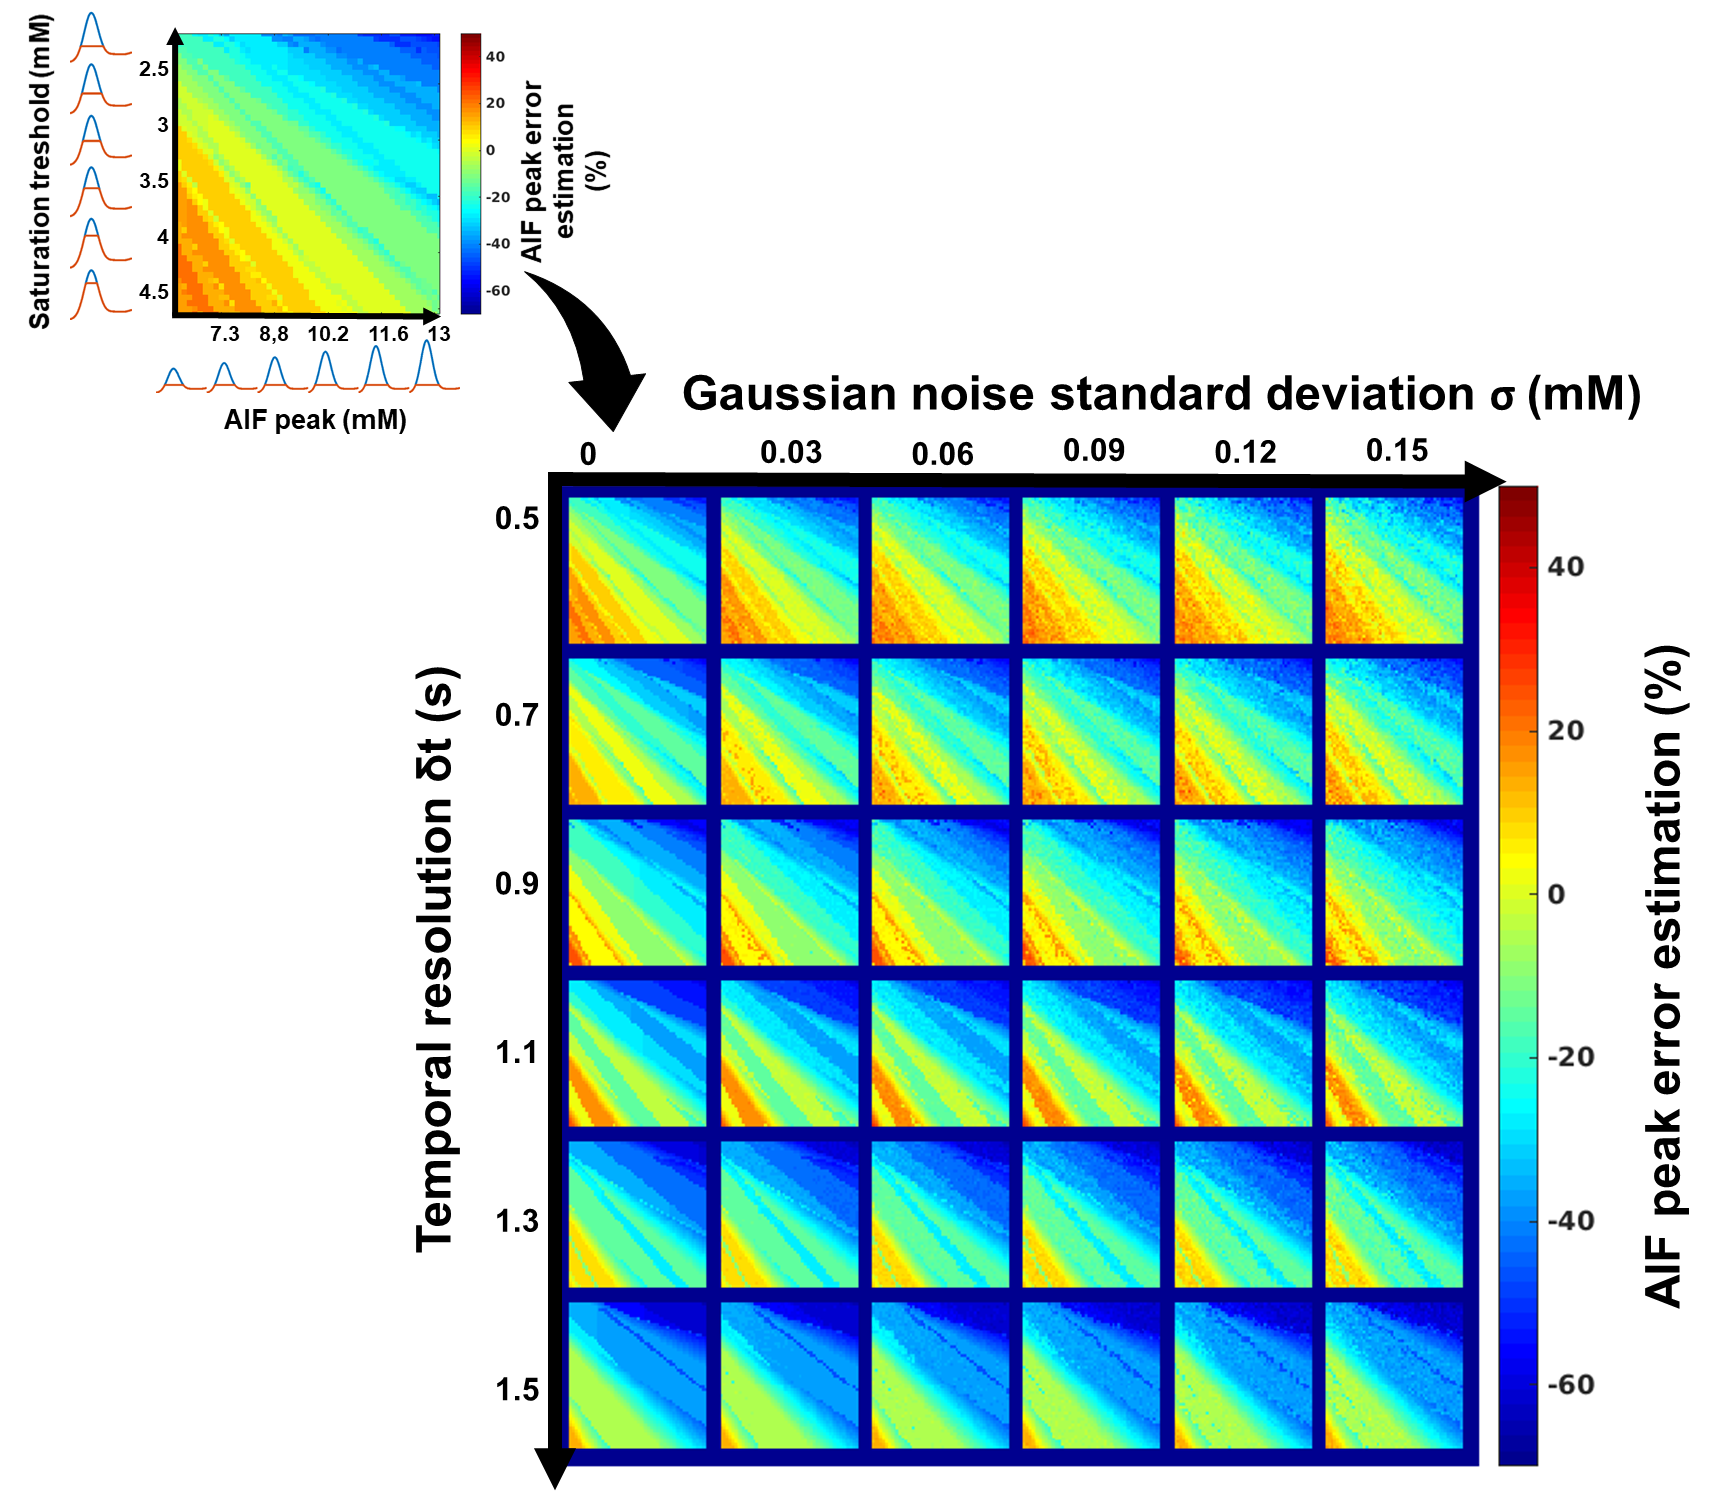
Framework: The algorithm framework is described in figure 1 and was developed in Matlab (The MathWorks, Natick, MA, USA). The first step consists in oversampling the signal to time AIF curve in order to homogenize data sampling to a temporal resolution equals to 0.5s. The second step consists in signal to CA concentration conversion using the SR-turboFLASH signal equation. The third step consists in thresholding the AIF values polluted by apparent saturation effect. The fourth step is a linear regression of wash-in and wash-out part of the truncated AIF. The synthetic peak is estimated as the intersection between the two generated lines. The last step consisted in the reconstruction of two synthetic AIF both using the linear approximation wash-in but with two wash-out estimation method. The first one uses a combination between the linear approximation for CA concentration higher than the threshold and the experimental data for CA concentration below the threshold. The second one is a biexponential fitting of the previous one. Simulation validation: We tested the framework algorithm generating the first form of synthetic AIF on several types of simulated AIF based on the Parker model[7] in different condition of thresholding, temporal resolution and noise level. 51 AIF with different peak values (6.1mM to 13.1mM) have been generated and truncated according to 51 saturation threshold values (2mM to 4,5mM). We tested the 306 combinations of truncated AIF in 36 combinations of 6 different temporal resolution (0.5s to 1.5s) and 6 different noise level (0mM to 0,15mM). We represented the error estimation in a 341x341 matrix corresponding to the 36 matrices of 51 saturation threshold by 51 peak value of temporal resolution. Clinical validation: The algorithm has been tested on 16 manually measured AIF from 16 patients extracted from the STAMP study (NCT02879825)[8]. AIF was acquired with an SR-TurboFLASH (TS=95ms, TR/TE=4/0.97ms, GRAPPA=2-3, FA=10°). Saturation threshold value of 3mM was used. It was determined by a previous work which consisted in measurements of signal values from the same SR-Turbo FLASH sequence parameters in function of known CA concentration. A population AIF was calculated as the average of the measured AIF aligned on the end of the baseline. We compared this population AIF to the one reported in [7].Results
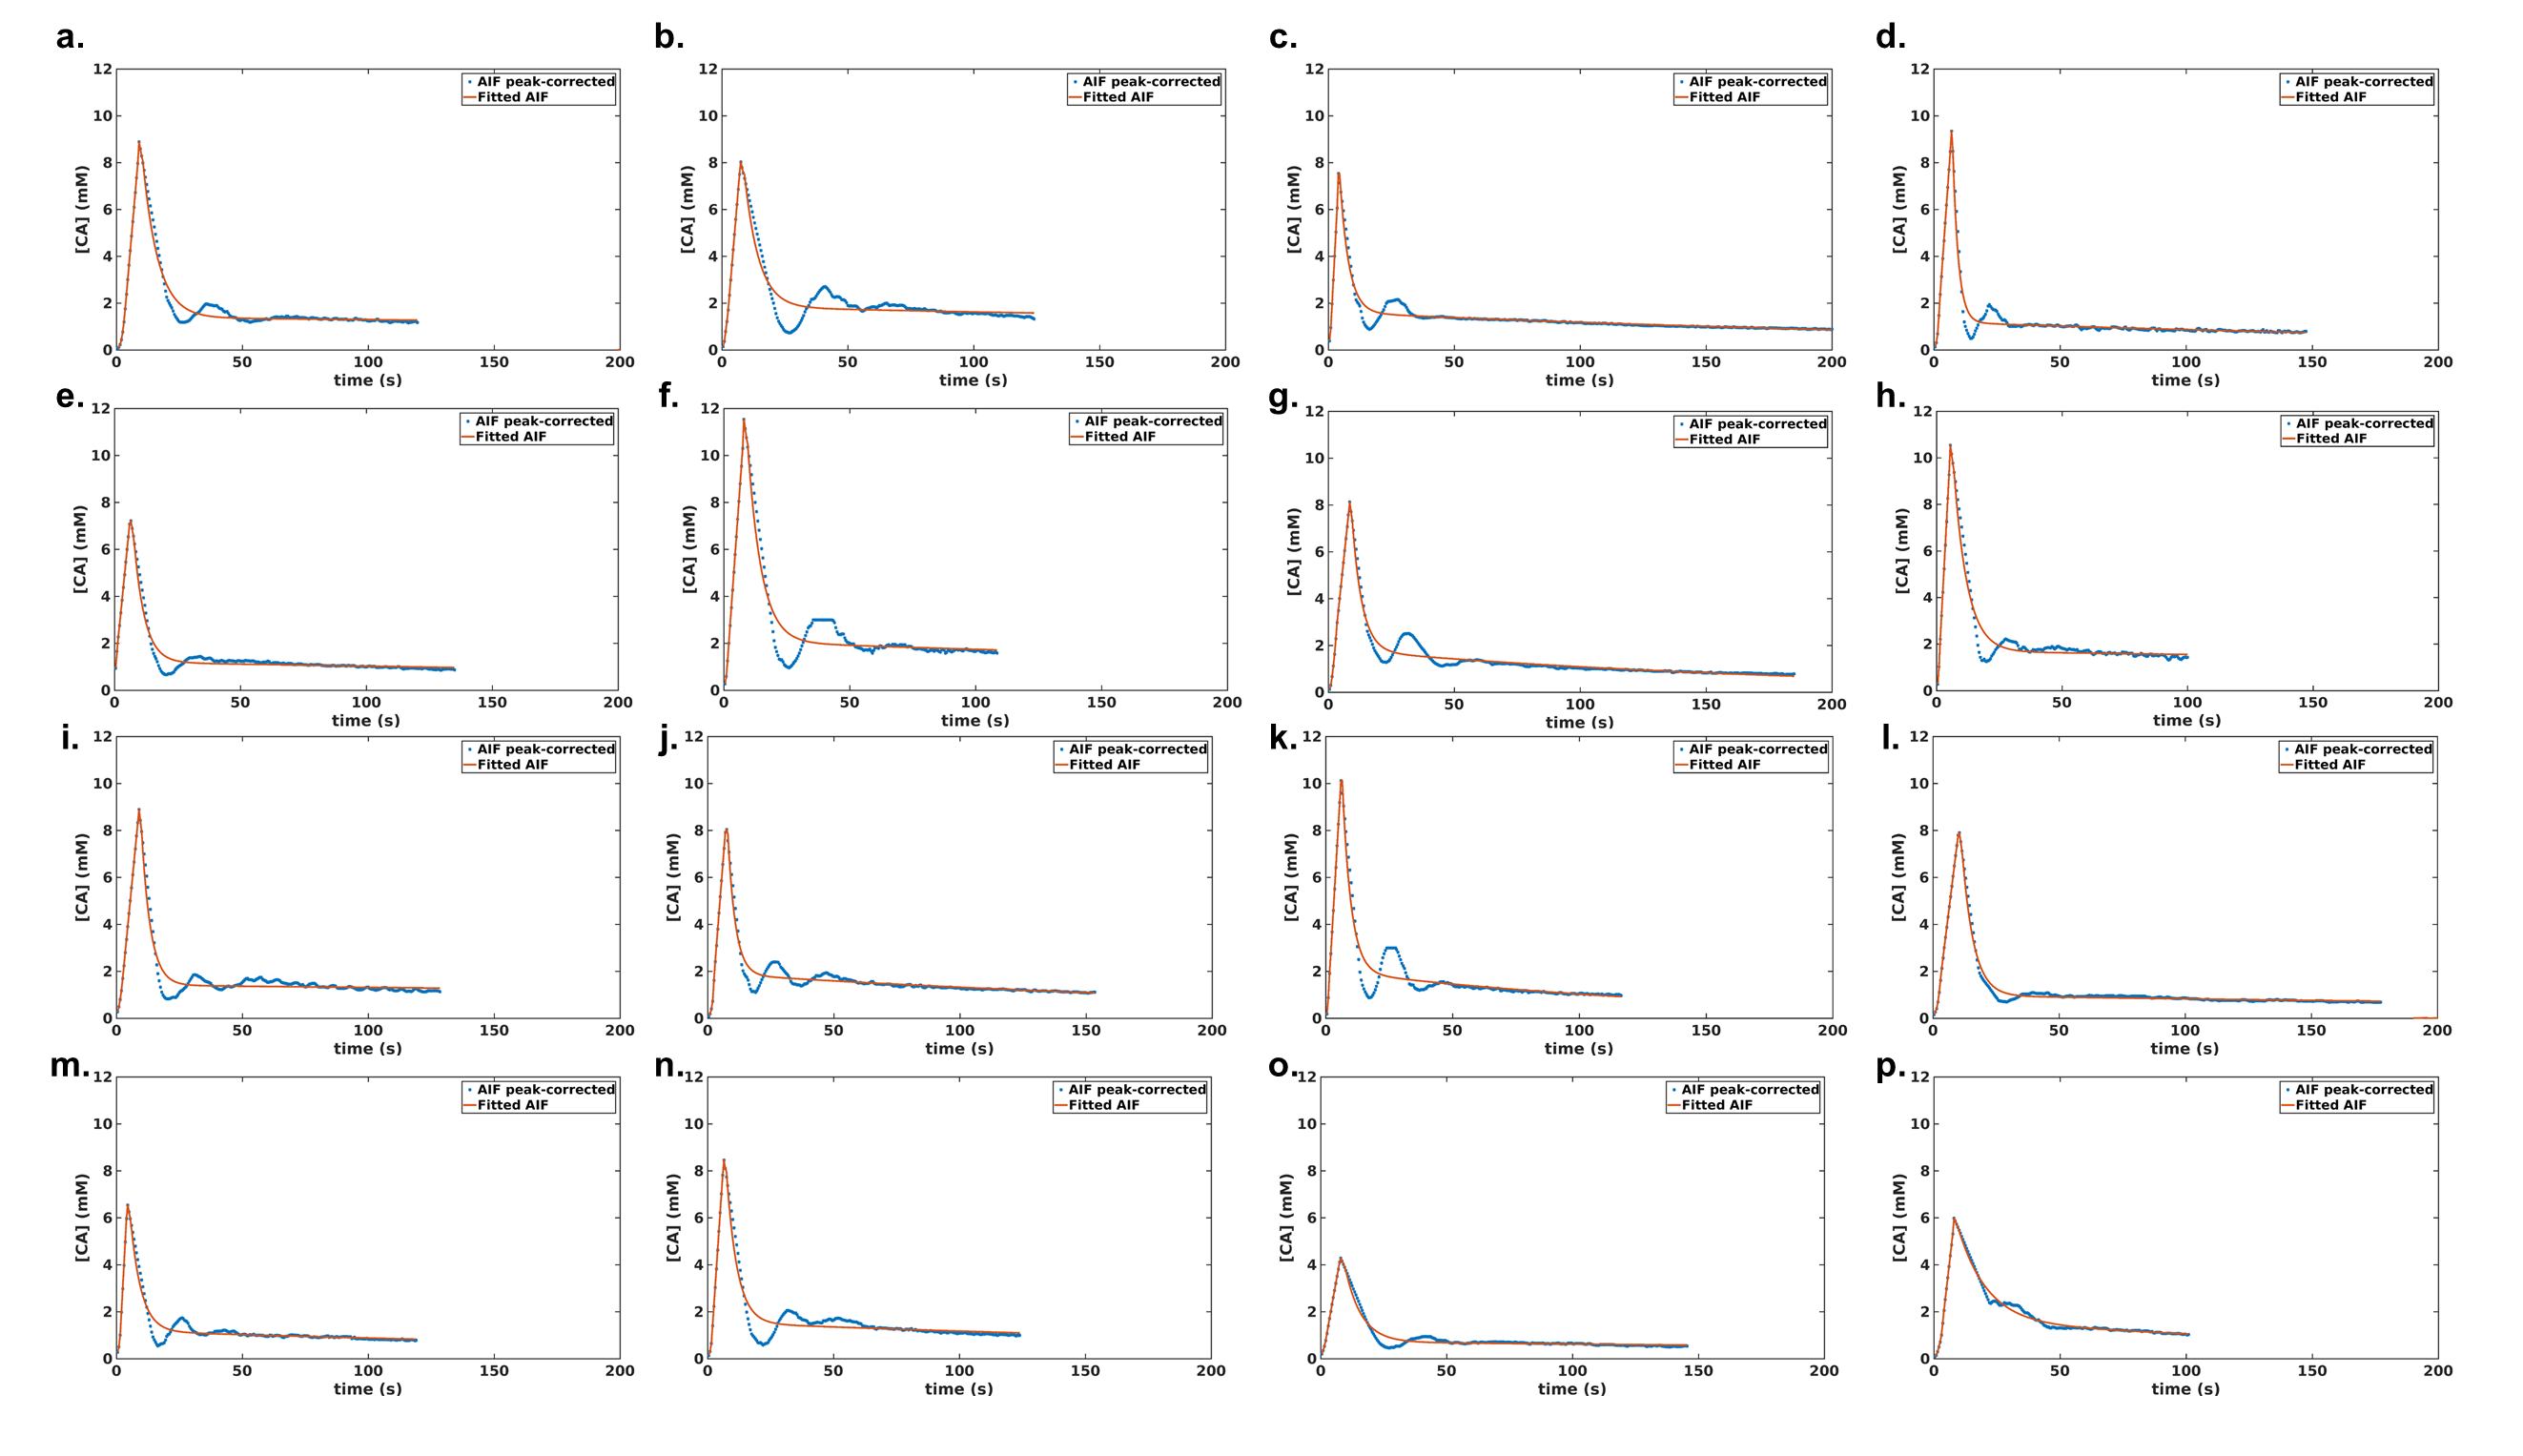
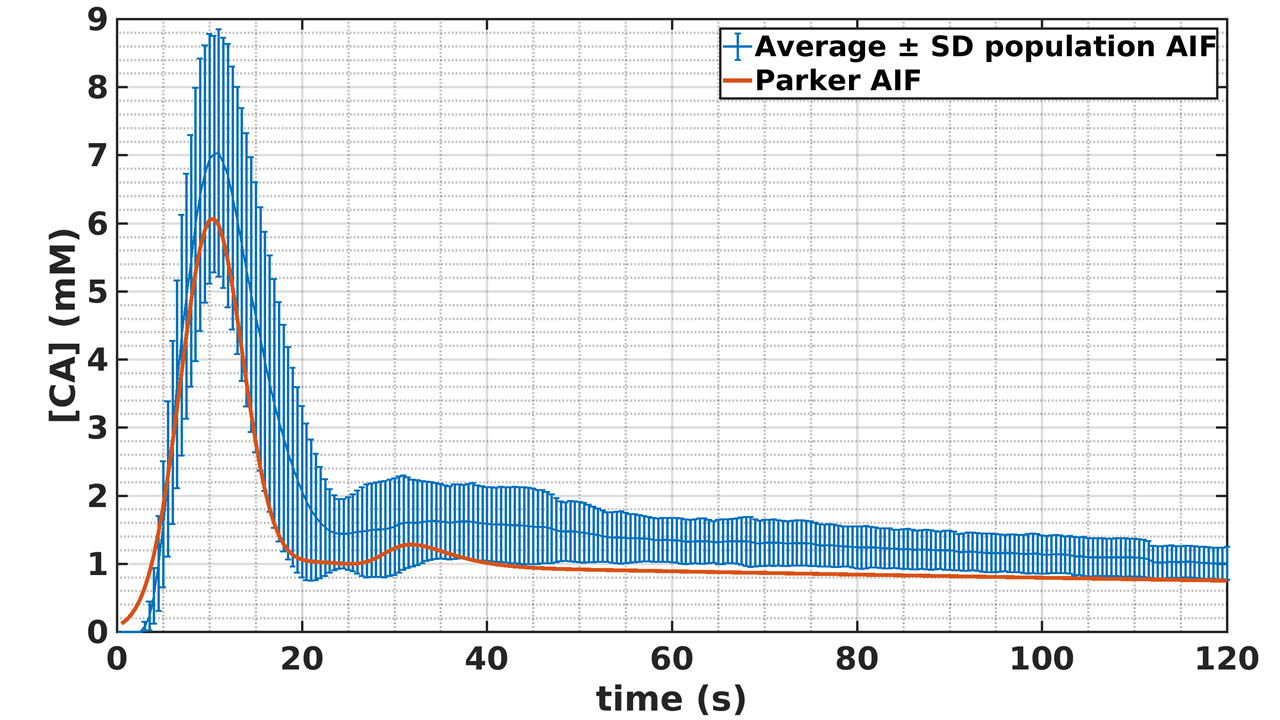
Simulation validation: Peak estimation errors are presented in figure 2. Matrix representation exhibits banding patterns. We observed an overestimation of the peak (i.e.>9%) when the actual peak had low values (<8mM) and the saturation threshold was high (>3.65mM). Inversely, we observed an underestimation of the peak (i.e.<-11.6%) when saturation threshold was lower than 3.3mM and the actual peak value was high (>9.9mM). We observed that a degraded temporal resolution accentuates the peak underestimation. Noise level did not have a clear impact on the observed matrix patterns. However, high level of noise tended to smooth the banding effect which may underly a lower precision of peak estimation. Clinical validation: The sixteen corrected AIF are represented in figure 3. All corrected AIF apart from figure3.o and figure3.p had consistent shape with a mean estimated peak equals to 8.2±1.8mM. Population AIF is represented in figure 4 and is very similar to literature such Parker model’s AIF. Average population AIF peak value is equal to 7.03±1.8mM slightly higher than 6.1 mM of the parker’s model AIF.Discussion & conclusion
Results from simulation showed that our algorithm improves the estimation of the AIF peak. Saturation threshold has to be selected in function of the expected maximum concentration. Results from clinical data showed the robustness of the algorithm as well as its ability to reconstruct consistent AIF in comparison to population-based AIF of the literature. A direct comparison between our solution and dual sequence or dual bolus solution needs to be conducted. This solution could enable the retrospective quantitative perfusion analysis from common perfusion sequences such SR-turboFLASH. Furthermore, our solution led to an increase in the accuracy of the perfusion/DCE parameters estimates (results not shown).Acknowledgements
No acknowledgement found.References
[1] A. A. Robinson, M. Salerno, and C. M. Kramer, “Contemporary Issues in Quantitative Myocardial Perfusion CMR Imaging,” Curr Cardiovasc Imaging Rep, vol. 12, no. 3, p. 9, Feb. 2019, doi: 10.1007/s12410-019-9484-6.
[2] P. Slomka, Y. Xu, D. Berman, and G. Germano, “Quantitative Analysis of Perfusion Studies: Strengths and Pitfalls,” J Nucl Cardiol, vol. 19, no. 2, pp. 338–346, Apr. 2012, doi: 10.1007/s12350-011-9509-2.
[3] T. P. L. Roberts, “Physiologic measurements by contrast-enhanced MR imaging: Expectations and limitations,” Journal of Magnetic Resonance Imaging, vol. 7, no. 1, pp. 82–90, 1997, doi: 10.1002/jmri.1880070112.
[4] P. Kellman, A. H. Aletras, L. Hsu, E. R. McVeigh, and A. E. Arai, “T2∗ Measurement During First-Pass Contrast-Enhanced Cardiac Perfusion Imaging,” Magn Reson Med, vol. 56, no. 5, pp. 1132–1134, Nov. 2006, doi: 10.1002/mrm.21061.
[5] P. D. Gatehouse, A. G. Elkington, N. A. Ablitt, G.-Z. Yang, D. J. Pennell, and D. N. Firmin, “Accurate assessment of the arterial input function during high-dose myocardial perfusion cardiovascular magnetic resonance,” Journal of Magnetic Resonance Imaging, vol. 20, no. 1, pp. 39–45, Jul. 2004, doi: 10.1002/jmri.20054.
[6] T. F. Christian et al., “Absolute Myocardial Perfusion in Canines Measured by Using Dual-Bolus First-Pass MR Imaging,” Radiology, vol. 232, no. 3, pp. 677–684, Sep. 2004, doi: 10.1148/radiol.2323030573.
[7] G. J. M. Parker et al., “Experimentally-derived functional form for a population-averaged high-temporal-resolution arterial input function for dynamic contrast-enhanced MRI,” Magnetic Resonance in Medicine, vol. 56, no. 5, pp. 993–1000, Nov. 2006, doi: 10.1002/mrm.21066.
[8] “Myocardial Characterization of Arrhythmogenic Mitral Valve Prolapse (STAMP: STretch and Myocardial Characterization in Arrhythmogenic Mitral Valve Prolapse).” https://clinicaltrials.gov/ct2/show/NCT02879825.
Figures