1078
The relative cerebral blood volume in normal-appearing white and grey matter remains almost constant following radio(chemo)therapy1Helmholtz-Zentrum Dresden-Rossendorf, Institute of Radiooncology – OncoRay, Dresden, Germany, 2OncoRay - National Center for Radiation Research in Oncology, Faculty of Medicine and University Hospital Carl Gustav Carus, Technische Universität Dresden, Helmholtz-Zentrum Dresden-Rossendorf, Dresden, Germany, 3Institute of Neuroradiology, University Hospital Carl Gustav Carus and Medical Faculty of Technische Universität Dresden, Dresden, Germany, 4Department of Radiotherapy and Radiation Oncology, Faculty of Medicine and University Hospital Carl Gustav Carus, Technische Universität Dresden, Dresden, Germany, 5National Center for Tumor Diseases (NCT), Partner Site Dresden, Germany: German Cancer Research Center (DKFZ), Heidelberg, Germany; Faculty of Medicine and University Hospital Carl Gustav Carus, Technische Universität Dresden, Dresden, Germany, and; Helmholtz Association / Helmholtz-Zentrum Dresden - Rossendorf (HZDR), Dresden, Germany, 6German Cancer Consortium (DKTK), Partner Site Dresden, and German Cancer Research Center (DKFZ), Heidelberg, Germany
Synopsis
In adjuvant radio(chemo)therapy of glioma patients, irradiation of tumor-surrounding normal tissue is unavoidable, potentially leading to long-term side-effects. We analyzed radiation-induced perfusion changes measured as relative cerebral blood volume (rCBV) in supraventricular grey and white matter regions of 17 glioma patients before and 3, 6 and 9 months after radiotherapy. After treatment, perfusion remained constant in the entire regions and after dose-separation, except for a statistically significant rCBV decrease in low-dose white matter volumes 6 months after the end of radiotherapy (p=0.008) and a trend towards increasing white and grey matter perfusion in high-dose volumes at 9 months (p<0.1).
Introduction
Adjuvant radio(chemo)therapy (RT) is part of the treatment of primary brain tumor patients. In order to capture microscopic tumor extension and to compensate for random and systematic positioning uncertainties, it is inevitable that tumor-surrounding normal brain tissue is irradiated. The aim of this study was to determine relative cerebral blood volume (rCBV) changes in glioma patients before and after RT in normal appearing white matter (WM) and grey matter (GM).Methods
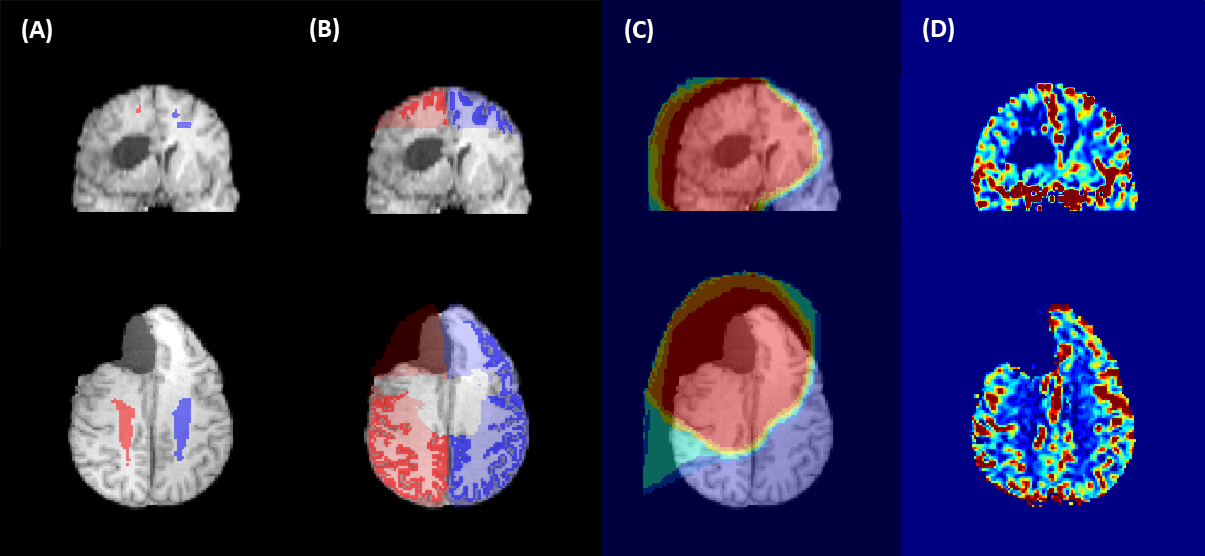
As part of an ongoing study, anatomical and functional MRI data of glioma patients undergoing gross tumor resection followed by RT is being collected. The analysis of a subset of this cohort, 17 glioma patients (3 grade II, 11 grade III, 3 grade IV, average age 46.9y ± 13.2y) is presented here. Two patients were treated with photon therapy, 14 patients with proton therapy and one patient received treatment modalities.MRI scans acquired prior to RT and at least one follow-up MRI obtained 3, 6 and 9 months after RT was evaluated. All MRI data were collected on a 3T Philips Ingenuity PET/MR scanner (Philips, Eindhoven, The Netherlands) using an 8 channel head coil and included anatomical T1w-images (3D-GRE, TR/TE=10/3.7ms, FA=20°, voxel size 1×1×1mm3) and dynamic susceptibility contrast (DSC) images using a PRESTO sequence (TR/TE=15/21ms, 60 dynamics, dynamic scantime=1.7s, voxel size 3.6×3.6×3.5mm3) with intravenous gadolinium contrast agent (0.1mol/kg, 4ml/s, 7s delay) followed by a saline flush (20ml, 4ml/s). The CBV-map (fig. 1D) was calculated as the area under curve of the voxelwise time course of the 4D PRESTO image.
Computed tomographies (CTs) used for planning, radiation dose (fig. 1C) and clinical target volume (CTV) contours were registered to the T1w-images using ANTs1. T1w-images were segmented into GM and WM using SPM122 and the corresponding 95% tissue probability maps were rigidly registered with ANTs1 to the CBV-map. B1 inhomogeneities as well as voxels with strong signal loss due to susceptibility artefacts were excluded. Only voxels outside the CTV and without any abnormalities appearing on the FLAIR image were considered. Symmetrical GM and WM ROIs in supraventricular contralateral and ipsilateral hemisphere (fig.1A,B) were evaluated. The relative CBV (rCBV) was calculated as the ratio of the mean ipsilateral and contralateral CBV:
$$rCBV=\frac{CBV_{ipsi}}{CBV_{contra}}$$
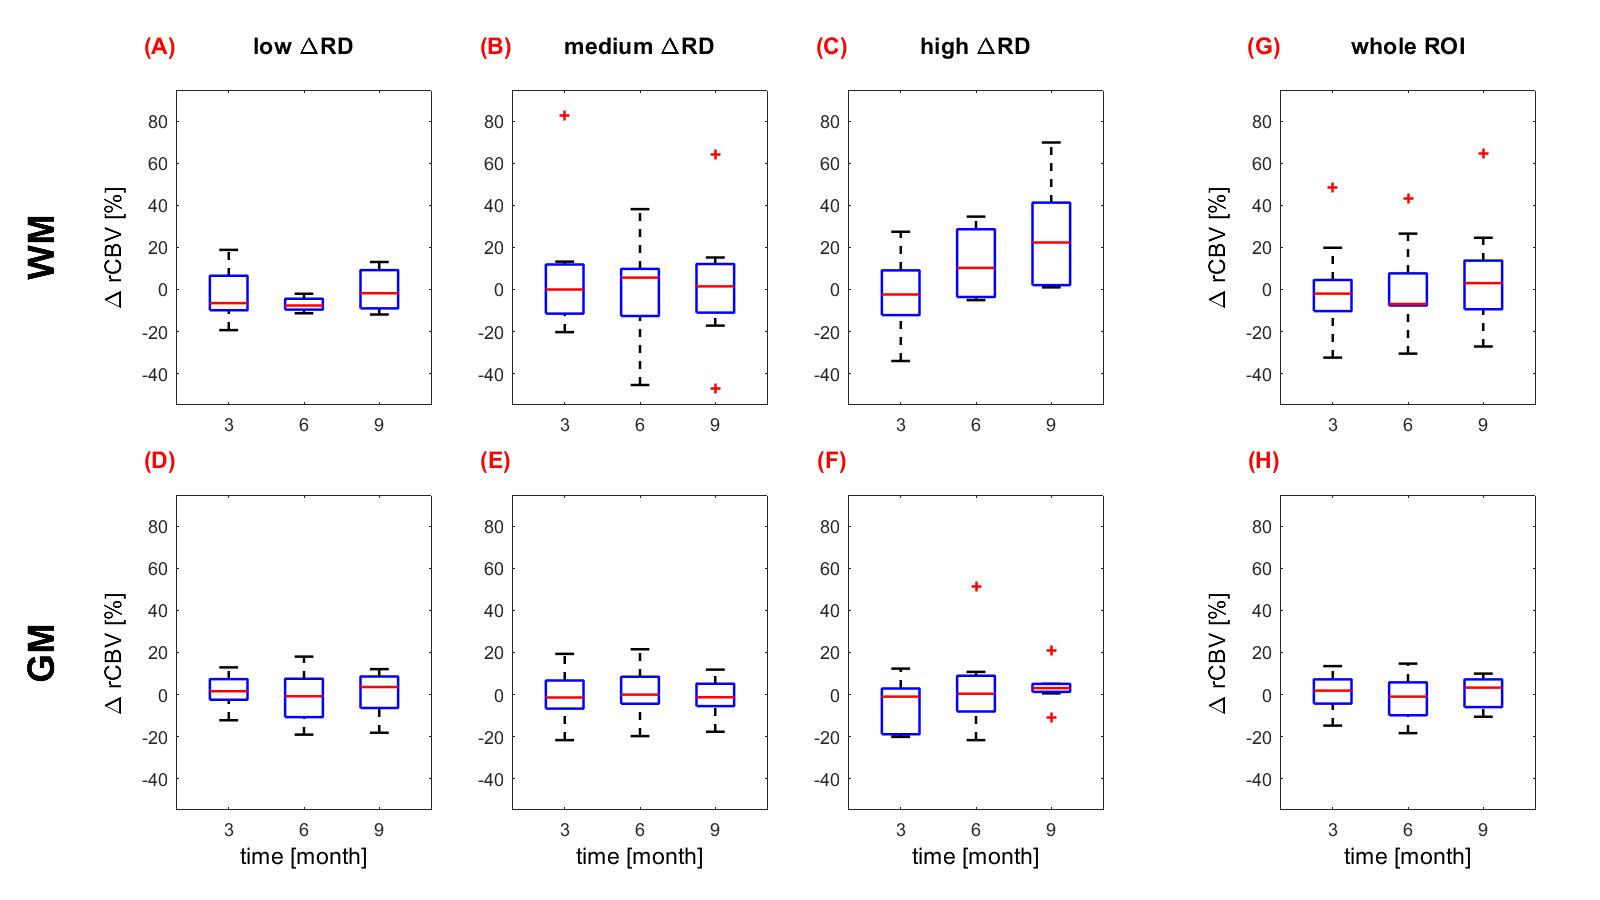
The radiation dose in the ROI was determined as the dose difference of ipsilateral to contralateral side. In a second analysis, the ROI was divided into bins of relative dose differences (ΔRD): low (0-20Gy), medium (20-40Gy) and high (>40Gy). Time-dependent alteration of rCBV was determined by the normalized difference between follow-up (v0x) and baseline measurement:
$$\Delta rCBV = \frac{rCBV_{v0x}-rCBV_{baseline}}{rCBV_{baseline}}$$
Dose- and time-dependent ΔrCBV distributions were compared with the paired Wilcoxon signed-rank test.
Results
The entire ROIs (fig. 2G,H) as well as the dose-separated regions (fig. 2A-F) of GM and WM rCBV did not show significant changes between baseline and follow-up, neither over time nor with increasing dose. One exception was the statistically significantly reduced mean ΔrCBV of -7.1% (p=0.008) after 6 months in WM volumes receiving a ΔRD of 0-20Gy (fig. 2A). In volumes receiving a ΔRD of <40Gy a trend towards increased ΔrCBV was detected 9 months after RT [mean WM +25,5% (p=0.063) and mean GM +3.6% (p=0.098); fig. 2C and 2F]. Patient-dependent fluctuations were higher in WM-regions than in GM-regions, however, the variations remained below 20%.Discussion
The evaluation of radiation-induced rCBV changes in normal-appearing tissue resulted mainly in constant perfusion without continuous changes after RT, while the majority of the previous studies reported a perfusion reduction prominently appearing in high radiation dose regions3–7. Significant rCBV reduction 6-9 months after RT with a recovery after 18 months in low-dose areas was reported in combined grey and white matter region7, which is in line with our results of WM perfusion decrease in low ΔRD volumes. However, the authors7 also reported similar behaviour for high-dose regions not consistent with our results. An early radiation response of decreasing rCBV followed by a recovery 3 months after RT has also been measured8, which agrees with our observation of constant rCBV 3, 6 and 9 months after radiation. One study reported increasing rCBV in the low-dose region9, while our results indicated a trend for increasing rCBV in the high ΔRD area. It is possible, that the trend to perfusion increase did not reach significance due to the low number of patients especially for the WM evaluation.Our evaluation method was different to other studies as relative CBV was calculated by the comparison of anatomical structures in ipsi- to contralateral hemisphere and not by normalization to low-dose WM5,7. In a previous study, GM was normalized to the low-dose GM region, resulting in no GM perfusion changes3. In addition, in our study we did not evaluate absolute but relative dose regions, justified by the observation of a relationship between radiation dose and perfusion changes4,8,10. A reason for the result of constant rCBV values could be the evaluation of the supraventricular region, as the strongest radiation-induced changes are claimed to occur in the periventricular region11.
Conclusion
The evaluation of perfusion changes after radio(chemo)therapy showed no continuous changes for the observed patient cohort. Further work to investigate a larger patient cohort for a longer observation period is planned for future studies.Acknowledgements
We thank all patients and healthy volunteers for participating in the respective studies. This work was partly funded by the National Center for Tumor Diseases (NCT), Partner Site Dresden.References
1. Avants BB et al. The Insight ToolKit image registration framework. Front Neuroinform 2014; 8:44.
2. Statistical Parametric Mapping. From https://www.fil.ion.ucl.ac.uk/spm/.
3. Wenz F et al. Effect of radiation on blood volume in low-grade astrocytomas and normal brain tissue: quantification with dynamic susceptibility contrast MR imaging. AJR Am J Roentgenol 1996; 166:187–193.
4. Fuss M et al. Radiation-induced regional cerebral blood volume (rCBV) changes in normal brain and low-grade astrocytomas: quantification and time and dose-dependent occurrence. Int J Radiat Oncol Biol Phys 2000; 48:53–58.
5. Price SJ et al. Early radiotherapy dose response and lack of hypersensitivity effect in normal brain tissue: a sequential dynamic susceptibility imaging study of cerebral perfusion. Clin Oncol (R Coll Radiol) 2007; 19:577–587.
6. Lee MC et al. Dynamic susceptibility contrast perfusion imaging of radiation effects in normal-appearing brain tissue: changes in the first-pass and recirculation phases. J Magn Reson Imaging 2005; 21:683–693.
7. Nilsen LB et al. Responses in the diffusivity and vascular function of the irradiated normal brain are seen up until 18 months following SRS of brain metastases. Neurooncol Adv 2020; 2:vdaa028.
8. Fahlström M et al. Perfusion Magnetic Resonance Imaging Changes in Normal Appearing Brain Tissue after Radiotherapy in Glioblastoma Patients may Confound Longitudinal Evaluation of Treatment Response. Radiol Oncol 2018; 52:143–151.
9. Jakubovic R et al. Non Tumor Perfusion Changes Following Stereotactic Radiosurgery to Brain Metastases. Technol Cancer Res Treat 2014.
10. Petr J et al. Early and late effects of radiochemotherapy on cerebral blood flow in glioblastoma patients measured with non-invasive perfusion MRI. Radiother Oncol 2016; 118:24–28.
11. Tsuruda JS et al. Radiation effects on cerebral white matter: MR evaluation. AJR Am J Roentgenol 1987; 149:165–171.
Figures