1033
Quantitative Susceptibility Mapping (QSM) is Sensitive to Hippocampal and Subcortical Gray Matter Changes in Temporal Lobe Epilepsy
Oliver C. Kiersnowski1, Gavin P. Winston2,3, Emma Biondetti1,4, Sarah Buck2, Lorenzo Caciagli2,5, John Duncan2, Karin Shmueli1, and Sjoerd B. Vos6,7
1Department of Medical Physics and Biomedical Engineering, University College London, London, United Kingdom, 2Department for Clinical and Experimental Epilepsy, University College London, London, United Kingdom, 3Department of Medicine, Division of Neurology, Queen's University, Kingston, ON, Canada, 4Institut du Cerveau – ICM, INSERM U 1127, CNRS UMR 7225, Sorbonne Université, Paris, France, 5Department of Bioengineering, University of Pennsylvania, Philadelphia, PA, United States, 6Centre for Medical Image Computing, Computer Science Department, University College London, London, United Kingdom, 7Neuroradiological Academic Unit, UCL Queen Square Institute of Neurology, University College London, London, United Kingdom
1Department of Medical Physics and Biomedical Engineering, University College London, London, United Kingdom, 2Department for Clinical and Experimental Epilepsy, University College London, London, United Kingdom, 3Department of Medicine, Division of Neurology, Queen's University, Kingston, ON, Canada, 4Institut du Cerveau – ICM, INSERM U 1127, CNRS UMR 7225, Sorbonne Université, Paris, France, 5Department of Bioengineering, University of Pennsylvania, Philadelphia, PA, United States, 6Centre for Medical Image Computing, Computer Science Department, University College London, London, United Kingdom, 7Neuroradiological Academic Unit, UCL Queen Square Institute of Neurology, University College London, London, United Kingdom
Synopsis
Although temporal lobe epilepsy (TLE) results in widespread changes in MRI measures of tissue volume, diffusion and functional connectivity, changes in tissue composition in TLE have not been investigated with MRI. Quantitative susceptibility mapping (QSM) is sensitive to changes in tissue composition, in particular to iron and myelin. Here, we show for the first time that QSM is sensitive to gray matter abnormalities in 31 patients with temporal lobe epilepsy (TLE) compared to 23 healthy controls, and showed significant susceptibility changes in the hippocampus in left TLE patients, and in the bilateral thalamus in both left and right TLE.
Introduction
Hippocampal sclerosis (HS) is the most common cause of drug-resistant temporal lobe epilepsy (TLE). Despite focal pathology in the hippocampus, the disease results in widespread alterations, with previous studies showing cortical and subcortical volumetric changes1, alteration of white matter diffusion properties2, and functional connectivity changes3. However, the sensitivity of prior work to alterations in tissue composition has been limited. Recently, quantitative susceptibility mapping (QSM) has been used in pediatric epilepsy patients with focal cortical dysplasia to reveal changes in tissue calcium, zinc and iron content4. Here, we extended the application of QSM in epilepsy to investigate susceptibility differences in deep gray matter regions in temporal lobe epilepsy (TLE) patients with hippocampal sclerosis (HS).Methods
We included 31 TLE patients with unilateral HS (mean age 38.5 years, range 19-67 years; 20 female; 17 LTLE / 14 RTLE) who attended our MRI unit for routine examination. We also included 23 healthy controls (mean age 29.4 years, range 17-55 years; 16 female).Subjects underwent imaging on a 3T General Electric Discovery MR750 scanner with a 32-channel coil. Sequences included a three-dimensional (3D) T1-weighted inversion-recovery fast spoiled gradient recalled echo (TE/TR/TI=3.1/7.4/400 ms, field of view (FOV) 224×256×256 mm, matrix 224×256×256, 1 mm isotropic voxel size, parallel imaging acceleration factor 2) and a multi-echo 3D gradient echo (SWAN) sequence, saving full complex data (TE1/ΔTE/TE5=12.9/5.0/32.8 ms, TR=37.1 ms, flip angle=15°, FOV=200×200×137 mm, matrix=384×384×114, reconstructed to a voxel size of=0.52×0.52×0.60 mm).
The 3D-T1 images were segmented using GIF5 to obtain regions of interest (ROI) in the amygdala, caudate, globus pallidus, putamen, and thalamus. Hipposeg6 was used to accurately segment the hippocampus in the presence of hippocampal pathology. The T1-weighted image was rigidly registered using Niftyreg7 to the first-echo magnitude image of the QSM (SWAN) data.
For each subject, a total field map and a noise map were obtained from a non-linear fit8,9 of the multi-echo complex SWAN data over all echo times. Residual phase wraps were removed with Laplacian unwrapping9,10. A brain mask $$$m$$$ was calculated using Otsu thresholding11 and thresholded at the mean of the inverse noise map to remove noisy voxels, except within the ROIs. To account for oblique slice acquisition12, the image volume was rotated into alignment with the main magnetic field $$$\mathbf{\hat{B}}_0$$$, using Niftyreg7 with trilinear interpolation13. Background fields were removed with projection onto dipole fields (PDF)9,14. Susceptibility ($$$\chi$$$) calculation was carried out using a non-linear weak harmonic (WH) formulation with total variation regularisation15 (Eq.1) from the FANSI toolbox16-18:
$$\underset{\chi,\phi_h}{\text{arg min}} \left\Vert W\left( e^{i\left(F^HDF\chi+\phi_h\right)} - e^{i\phi}\right)\right\Vert_2^2 + \frac{\beta}{2}\left\Vert m \nabla^2 \phi_h \right\Vert_2^2 + \alpha \left\vert \nabla \chi \right\vert_1 \tag{1}$$
where $$$W$$$ is a weighting proportional to the magnitude image, $$$F$$$ is the discrete Fourier transform and $$$F^H$$$ is its adjoint, $$$D=\gamma B_0 TE \left(\frac{1}{3}-\frac{k_z^2}{k^2}\right)$$$ is the dipole kernel in Fourier space, and $$$\phi_h$$$ contains residual harmonic background fields14 remaining after PDF. The WH weight chosen was $$$\beta$$$=150, ensuring that no structural information was contained in $$$\phi_h$$$. An L-curve-based zero-curvature search19 ($$$\alpha$$$ values from 0.0631 to 3.9811×10⁻⁵) gave an optimised $$$\alpha$$$=5.024×10⁻⁴. A convergence tolerance of 0.1 was chosen with a maximum of 500 iterations. The image volume was rotated back to the original orientation after $$$\chi$$$ calculation. This WH-QSM technique was used to reduce noise (due to the high resolution) and residual background fields relative to iterative Tikhonov QSM20 (Fig. 1).
Based on the significant difference in age between the groups (ANOVA p<0.01) mean ROI susceptibility values were corrected for age, based on least-squares linear fits in the healthy control subjects21. Three-group ANOVA was performed for each ROI to test for significant mean susceptibility differences between LTLE, RTLE, and control participants. Additionally, intra-subject left-right differences were investigated per group with a paired t-test.
Results
An example susceptibility map is shown in Figure 1, alongside a first- and last-echo gradient-echo magnitude image.The average susceptibility values for each ROI and group are shown in Table 1, with significant group differences for both thalami (p=0.024 left, p=0.035 right), left putamen (p=0.001), and left globus pallidus (p=0.021) as observed with ANOVA (Figure 2). Post-hoc t-tests revealed that: (i) the RTLE group had significantly higher susceptibility in the bilateral thalami compared to controls (p<0.01 left, p<0.05 right); (ii) the RTLE group had significantly higher susceptibility in the left putamen compared to controls (p<0.001) and the LTLE group (p<0.01); and (iii) the LTLE group had significantly lower susceptibility in the left globus pallidus compared to controls (p=0.013).
We found significant susceptibility differences between left and right-sided ROIs: (i) in the caudate (p=0.040) and globus pallidus (p<0.001) in healthy controls; and (ii) in the hippocampus (p=0.036) in LTLE, with more negative susceptibility in the pathological hippocampus compared to contralateral and control hippocampi (Table 1), a pattern also observed in RTLE, although not reaching significance.
Discussion and Conclusion
The observed pattern of higher susceptibility in the left vs. right globus pallidus and caudate in controls matches previous findings22. The asymmetry in the hippocampal susceptibilities in the LTLE group could reflect underlying hippocampal pathology. The observed susceptibility changes in the thalamus match known volumetry and connectivity differences in TLE1,3 and could reflect demyelination. Future work will investigate associations with clinical factors such as secondarily generalised tonic-clonic seizures.Acknowledgements
Note that KS and SBV contributed equally as senior authors. OCK is supported by the EPSRC-funded UCL Centre for Doctoral Training in Intelligent, Integrated Imaging in Healthcare (i4health) (EP/S021930/1). GPW was supported by a Medical Research Council Clinician Scientist Fellowship (MR/M00841X/1). KS is supported by European Research Council Consolidator Grant DiSCo MRI SFN 770939. We thank Dr Carlos Milovic for his assistance with FANSI.References
- Natsume J, et al. MRI volumetry of the thalamus in temporal, extratemporal, and idiopathic generalized epilepsy. Neurology 2003;60(8):1296;1300
- Hatton SN, et al. White matter abnormalities across different epilepsy syndromes in adults: and ENIGMA-Epilepsy study. Brain 2020;143(8):2454-2473
- Caciagli L, et al. Thalamus and focal to bilateral seizures: A multiscale cognitive imaging study. Neurology 2020;95(17):e2427-e2441
- Lorio S, et al. Quantitative susceptibility mapping reveals abnormal zinc, calcium, and iron levels in focal cortical dysplasia lesions. ISMRM 2020, p938
- Cardoso MJ, et al. Geodesic information flows: spatially-invariant graphs and their application to segmentation and fusion. IEEE Trans Med Imag 2015:34(9):1976-88
- Winston GP, et al. Automated hippocampal segmentation in patients with epilepsy: available free online. Epilepsia 2013;54(12):2166-73
- Modat M, et al. Global image registration using a symmetric block-matching approach. J of Med Imag 2014;1(2):024003–024003
- Liu T, et al. Nonlinear formulation of the magnetic field to source relationship for robust quantitative susceptibility mapping, Magn Reson Med 2013;69(2):467-76
- http://pre.weill.cornell.edu/mri/pages/qsm.html
- Schofield MA and Zhu Y, Fast Phase Unwrapping Algorithm for Interferometric Applications, Optics Letters, 2003;28(14):1194-96
- Otsu N. A Threshold selection method from gray-level histograms. IEEE Trans Sys Man Cybern 1979;9(1):62-66
- Kiersnowski OC, et al., The effect of oblique image slices on the accuracy of quantitative susceptibility mapping, ESMRMB 2020 Online, 37th Annual Scientific Meeting. Magn Reson Mater Phy 33, 69–233 (2020), Abstract No. L01.82., Pg.143
- Dixon EC. ‘Applications of MRI Magnetic Susceptibility Mapping in PET-MRI Brain Studies’, Doctoral Thesis, UCL (University College London), 2018 http://discovery.ucl.ac.uk/10053515/
- Liu T, et al. A Novel Background Field Removal Method for MRI Using Projection onto Dipole Fields (PDF). NMR in Biomed 2011;24(9):1129-36
- Milovic C, et al. Weak‐harmonic regularization for quantitative susceptibility mapping. Magn Reson Med 2019;81:1399-1411
- Bilgic B, et al. Sparse Methods for Quantitative Susceptibility Mapping; Wavelets and Sparsity XVI, SPIE 2015
- Milovic C, et al. Fast non-linear susceptibility inversion with variational regularization. Magn Reson Med 2018;80:814-21
- https://gitlab.com/cmilovic/FANSI-toolbox
- Milovic C, et al. Comparison of parameter optimization methods for quantitative susceptibility mapping. Magn Reson Med 2020;85:480-494
- Karsa A, et al. An optimized and highly repeatable MRI acquisition and processing pipeline r quantitative susceptibility mapping in the head-and-neck region. Magn Reson Med 2020;84:3206-3222.
- Cabronero et al. In vivo MRI mapping of brain iron deposition across the adult lifespan. J Neurosci 2016;36(2):364-74
- Santin MD, et al. Reproducibility of R2* and quantitative susceptibility mapping (QSM) reconstruction methods in the basal ganglia of healthy subjects. NMR in Biomed 2017;30:e3491
Figures

Figure 1:
Example T1-weighted image (left) with ROIs superimposed (caudate: R=yellow,
L=dark blue; putamen: R=red; L=dark green; globus pallidus: R=pink, L=light
blue; thalamus: R=light green, L=brown), first and final echo gradient echo
(GE) magnitude image, and susceptibility map calculated using iterative
Tikhonov regularisation and weak harmonic (WH) QSM for a representative control
subject. WH QSM was used here as its reduced noise and residual background
fields yielded significant $$$\chi$$$ differences unlike
the iterative Tikhonov technique.

Table 1
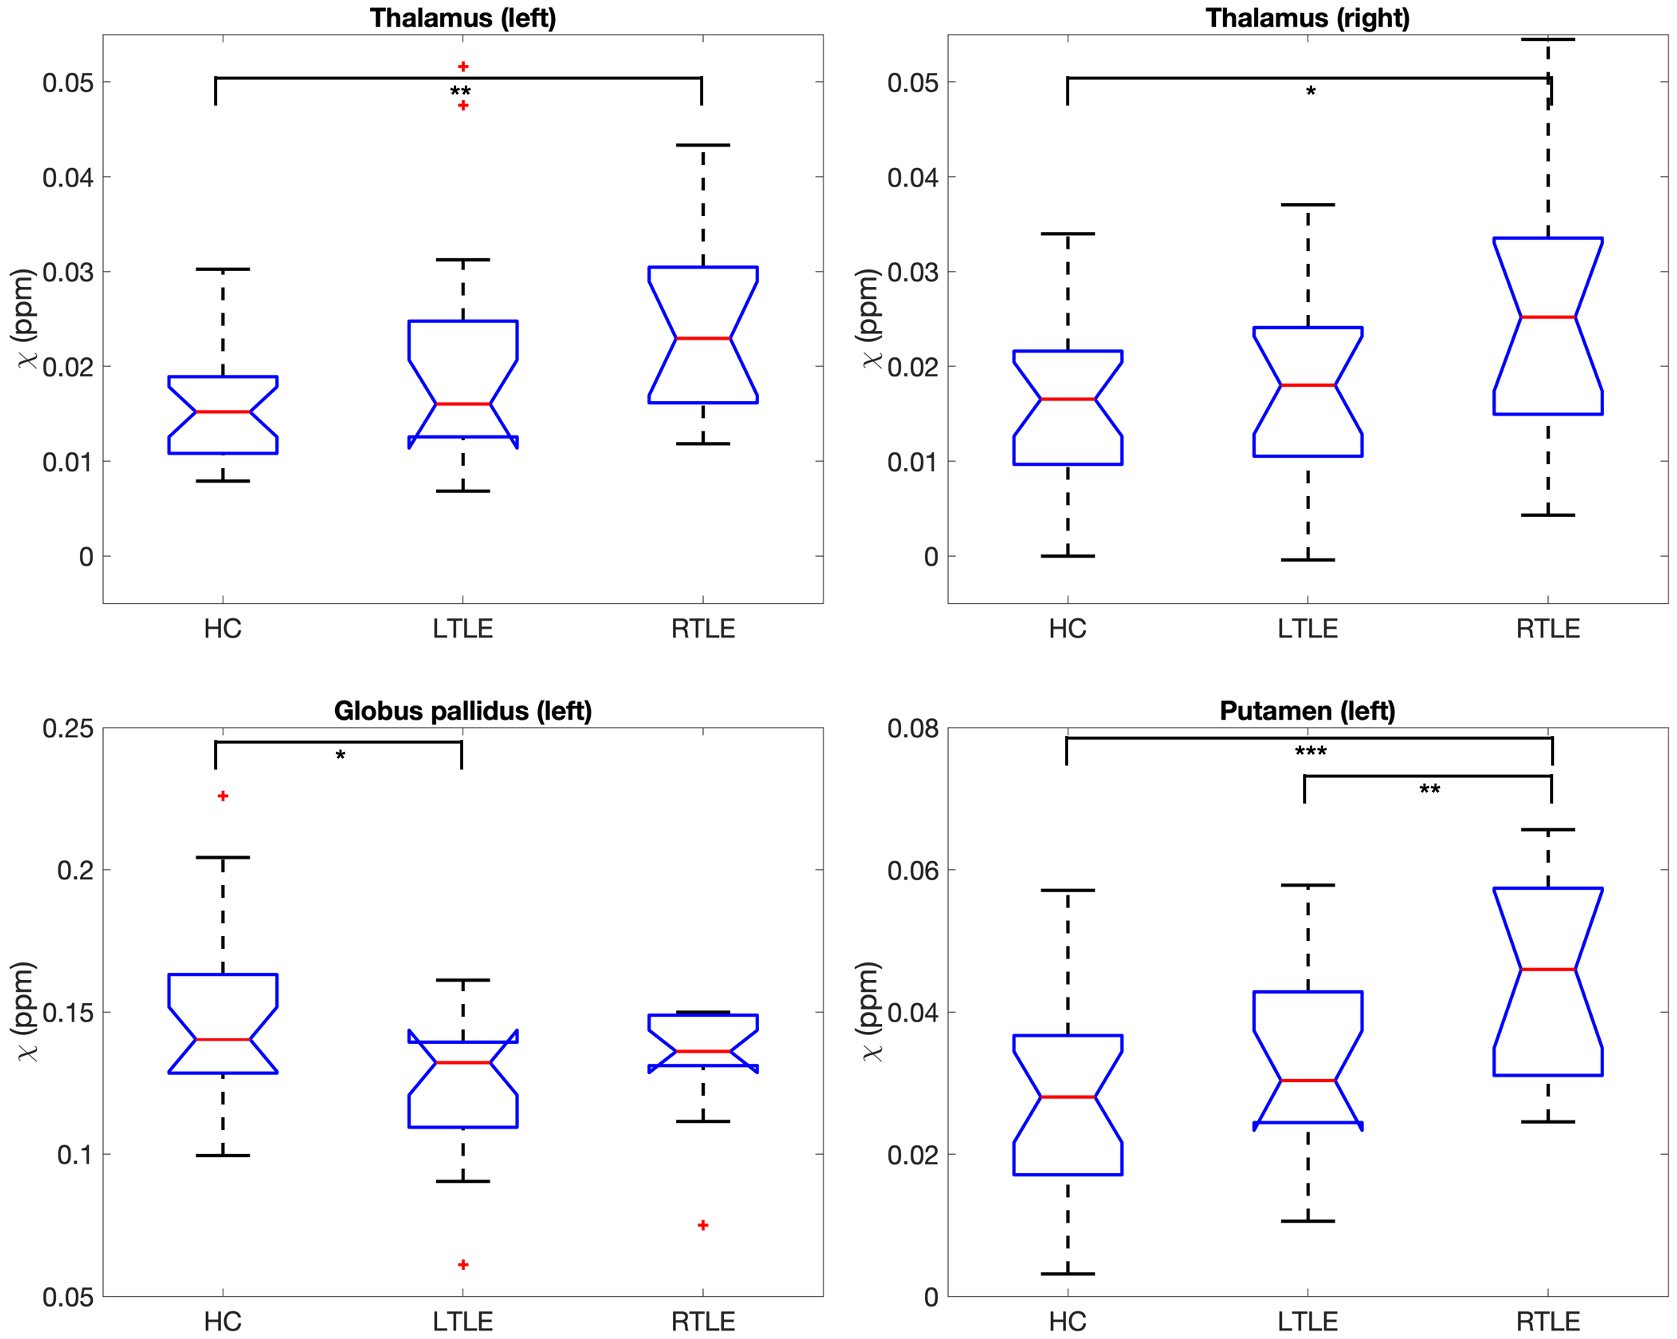
Figure 2: Box plots of deep gray matter regions with significant group differences in age-corrected mean susceptibility. HC=healthy controls, LTLE=left temporal lobe epilepsy, RTLE=right temporal lobe epilepsy. * indicates p<0.05, ** indicates p<0.01, *** indicates p<0.001.