0799
A Daily Quantitative Brain MRI Protocol for the 1.5 T MR-Linac: Feasibility of CEST with Preliminary Results on a Prospective Imaging Study1Physical Sciences, Sunnybrook Research Institute, Toronto, ON, Canada, 2Medical Biophysics, Sunnybrook Research Institute, Toronto, ON, Canada, 3Department of Radiation Oncology, Sunnybrook Health Sciences Centre, Toronto, ON, Canada, 4Department of Physics, Ryerson University, Toronto, ON, Canada, 5University of Toronto, Sunnybrook Health Sciences Centre, Medical Imaging, Toronto, ON, Canada, 6Department of Neurosurgery and Pediatric Neurosurgery, Medical University, Lublin, Poland
Synopsis
A multi-parametric imaging protocol, for monitoring patients with brain tumors treated using the 1.5T MR-Linac radiotherapy system, is presented with a focus on CEST. Phantom experiments were performed on the MR-Linac using varying concentrations of ammonium chloride mixtures. 24 subjects were included in the analysis. Mixed modelling was used to determine any differences between the gross tumor volume (GTV) and contralateral normal appearing white matter (cNAWM) regions, where three CEST parameters were investigated (MTRAmide, MTRNOE and Asymmetry). Results from phantom experiments confirmed detectable CEST asymmetry. Significant differences were found in all three CEST parameters between the GTV and cNAWM.
Introduction
The MR-Linac is a new MR-guided radiotherapy (MRgRT)1,2 device that combines radiation treatment with high-resolution MRI3,4, enabling diagnostic-quality images to be obtained at each radiation treatment fraction. The ability to perform real-time MR guidance for adapting the radiation beam1 offers new opportunities for response assessment and personalized treatment in radiotherapy using quantitative imaging5. The purpose of this work is to describe our implementation and initial results from a multi-parametric imaging protocol for monitoring patients with central nervous system (CNS) tumors during treatment on the MR-Linac. We present the first in vivo demonstration of chemical exchange saturation transfer (CEST) on the 1.5 T MR-Linac, which extends previous work on diagnostic scanners at 1.5T6 and 3T7-9.Methods
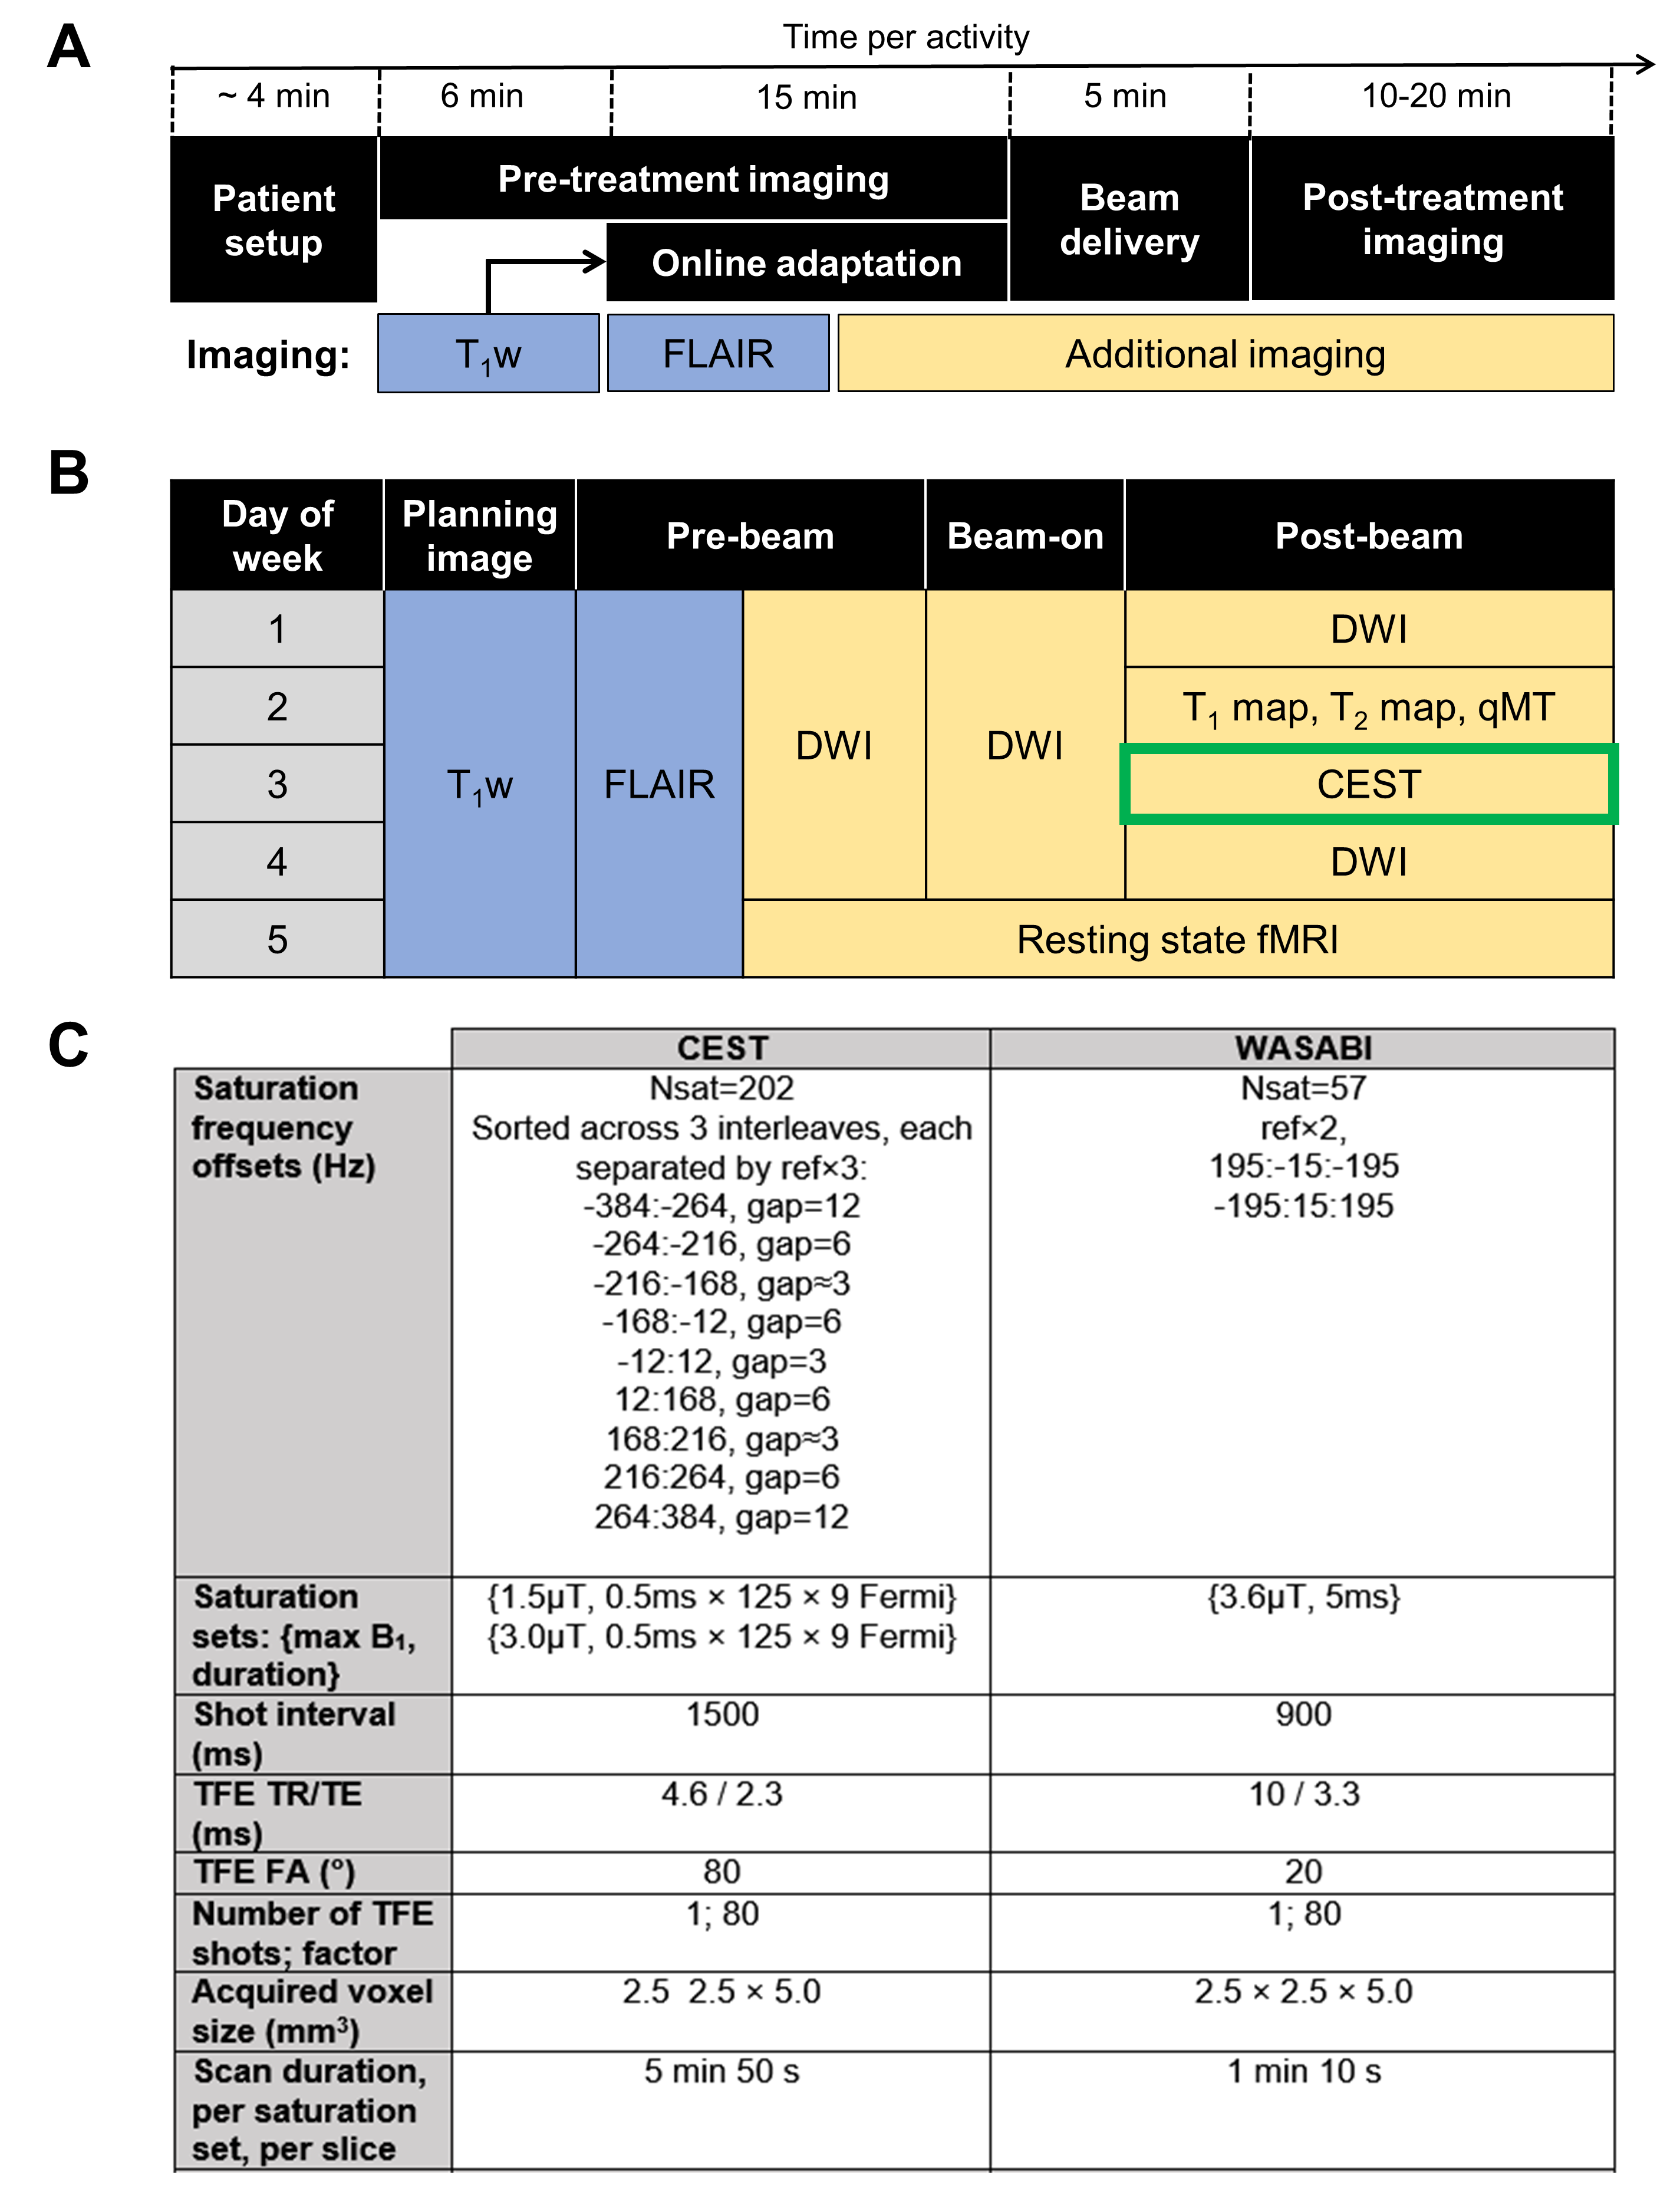
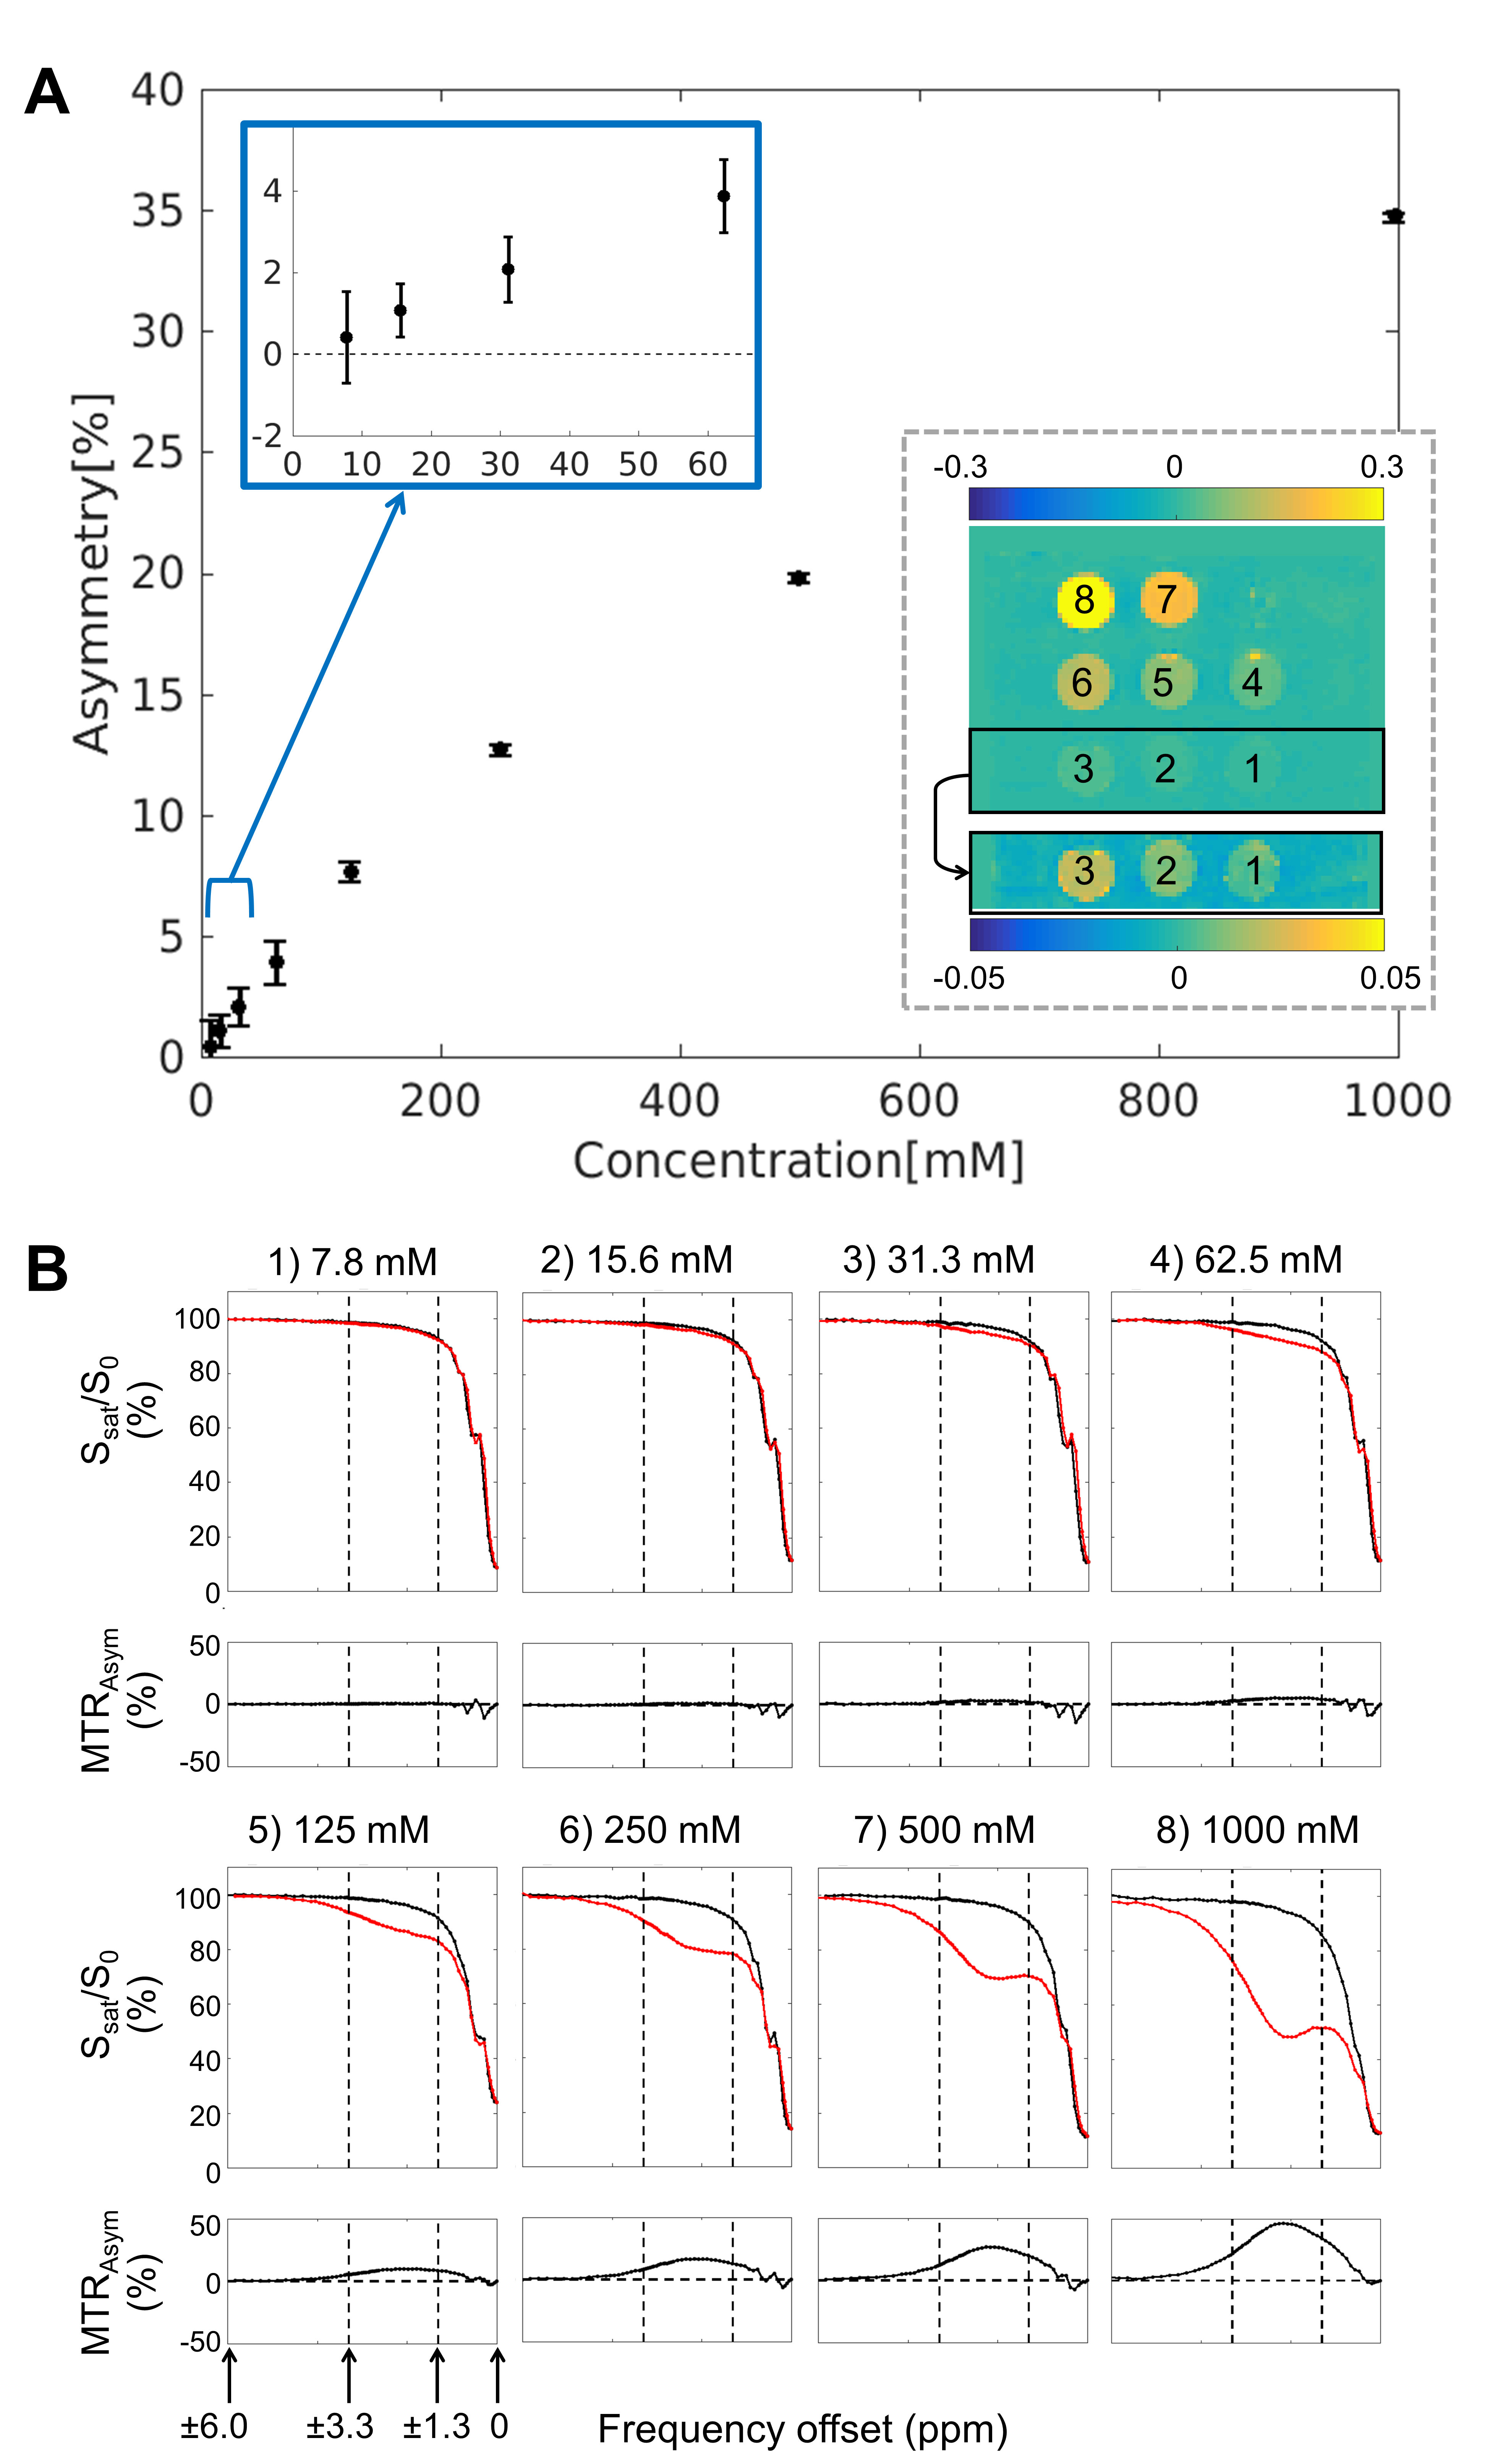
Study design: CNS patients were treated with chemoradiation using the 1.5 T Unity MR-Linac (Elekta, Stockholm, Sweden) with all patients enrolled in the MOMENTUM study10. The study was approved by the institutional research ethics board and informed consent was obtained. Patients were treated with 30 (total dose of 54 Gy or 60 Gy) or 15 fractions (total dose of 40 Gy). The treatment workflow and imaging schedules are shown in Figure 1A and B, including CEST.Phantom preparation: Mixtures of ammonium chloride (NH4Cl; concentrations {7.8, 15.6, 31.3, 62.5, 125, 250, 500, 1000} mM) doped with 1.0 mM copper sulfate (CuSO4×5H2O) were prepared to evaluate CEST sensitivity on the MR-Linac.
MR imaging: Anterior and posterior coils were used, each consisting of 4 channels11, with patients immobilized with a thermoplastic mask. CEST scans, performed during the allotted post-treatment imaging time, used pulsed saturation sequences previously developed and validated for a diagnostic Philips 1.5T scanner6 with comparisons to 3T12. In tumors, a single slice was acquired at the same superior-inferior location across days. WASABI13 was used for B0 and B1 correction. Figure 1C shows the MR parameters for CEST with total scan duration of 12.8min.
Image analysis: Gross tumor volume (GTV) was contoured as part of treatment planning and simulation using post-gadolinium T1-weighted images and T2-weighted FLAIR images. Contours at each fraction were obtained by rigidly co-registering the simulation image to the daily MR-Linac T1-weighted image (without intravenous contrast). For the CEST analysis, the GTV at the CEST slice position was extracted. FSL FAST14 was used to automatically segment the contralateral normal appearing white matter (cNAWM) regions. Three CEST parameters were quantified between 2 and 4 ppm in subjects (and 1.3-3.3 ppm in NH4Cl around the 2.3ppm peak): i) the magnetization transfer ratio (MTR) asymmetry, ii) MTRAmide and iii) MTRNOE. The Z-spectra from the two nominal RF amplitudes (1.5 and 3 μT) were interpolated to 2.5 μT in order to correct for B1 inhomogeneity. Voxelwise B0 correction was performed prior to computation of the CEST metrics. Image analysis used MATLAB (R2018b).
Statistical Analysis: Mixed effects modelling was used to assess any differences in CEST contrast between the two ROIs (GTV and cNAWM), using ROI as a fixed effect and subject as a random effect. This was performed for each of the three CEST parameters. Statistical analysis used R (v4.0.2x64).
Results
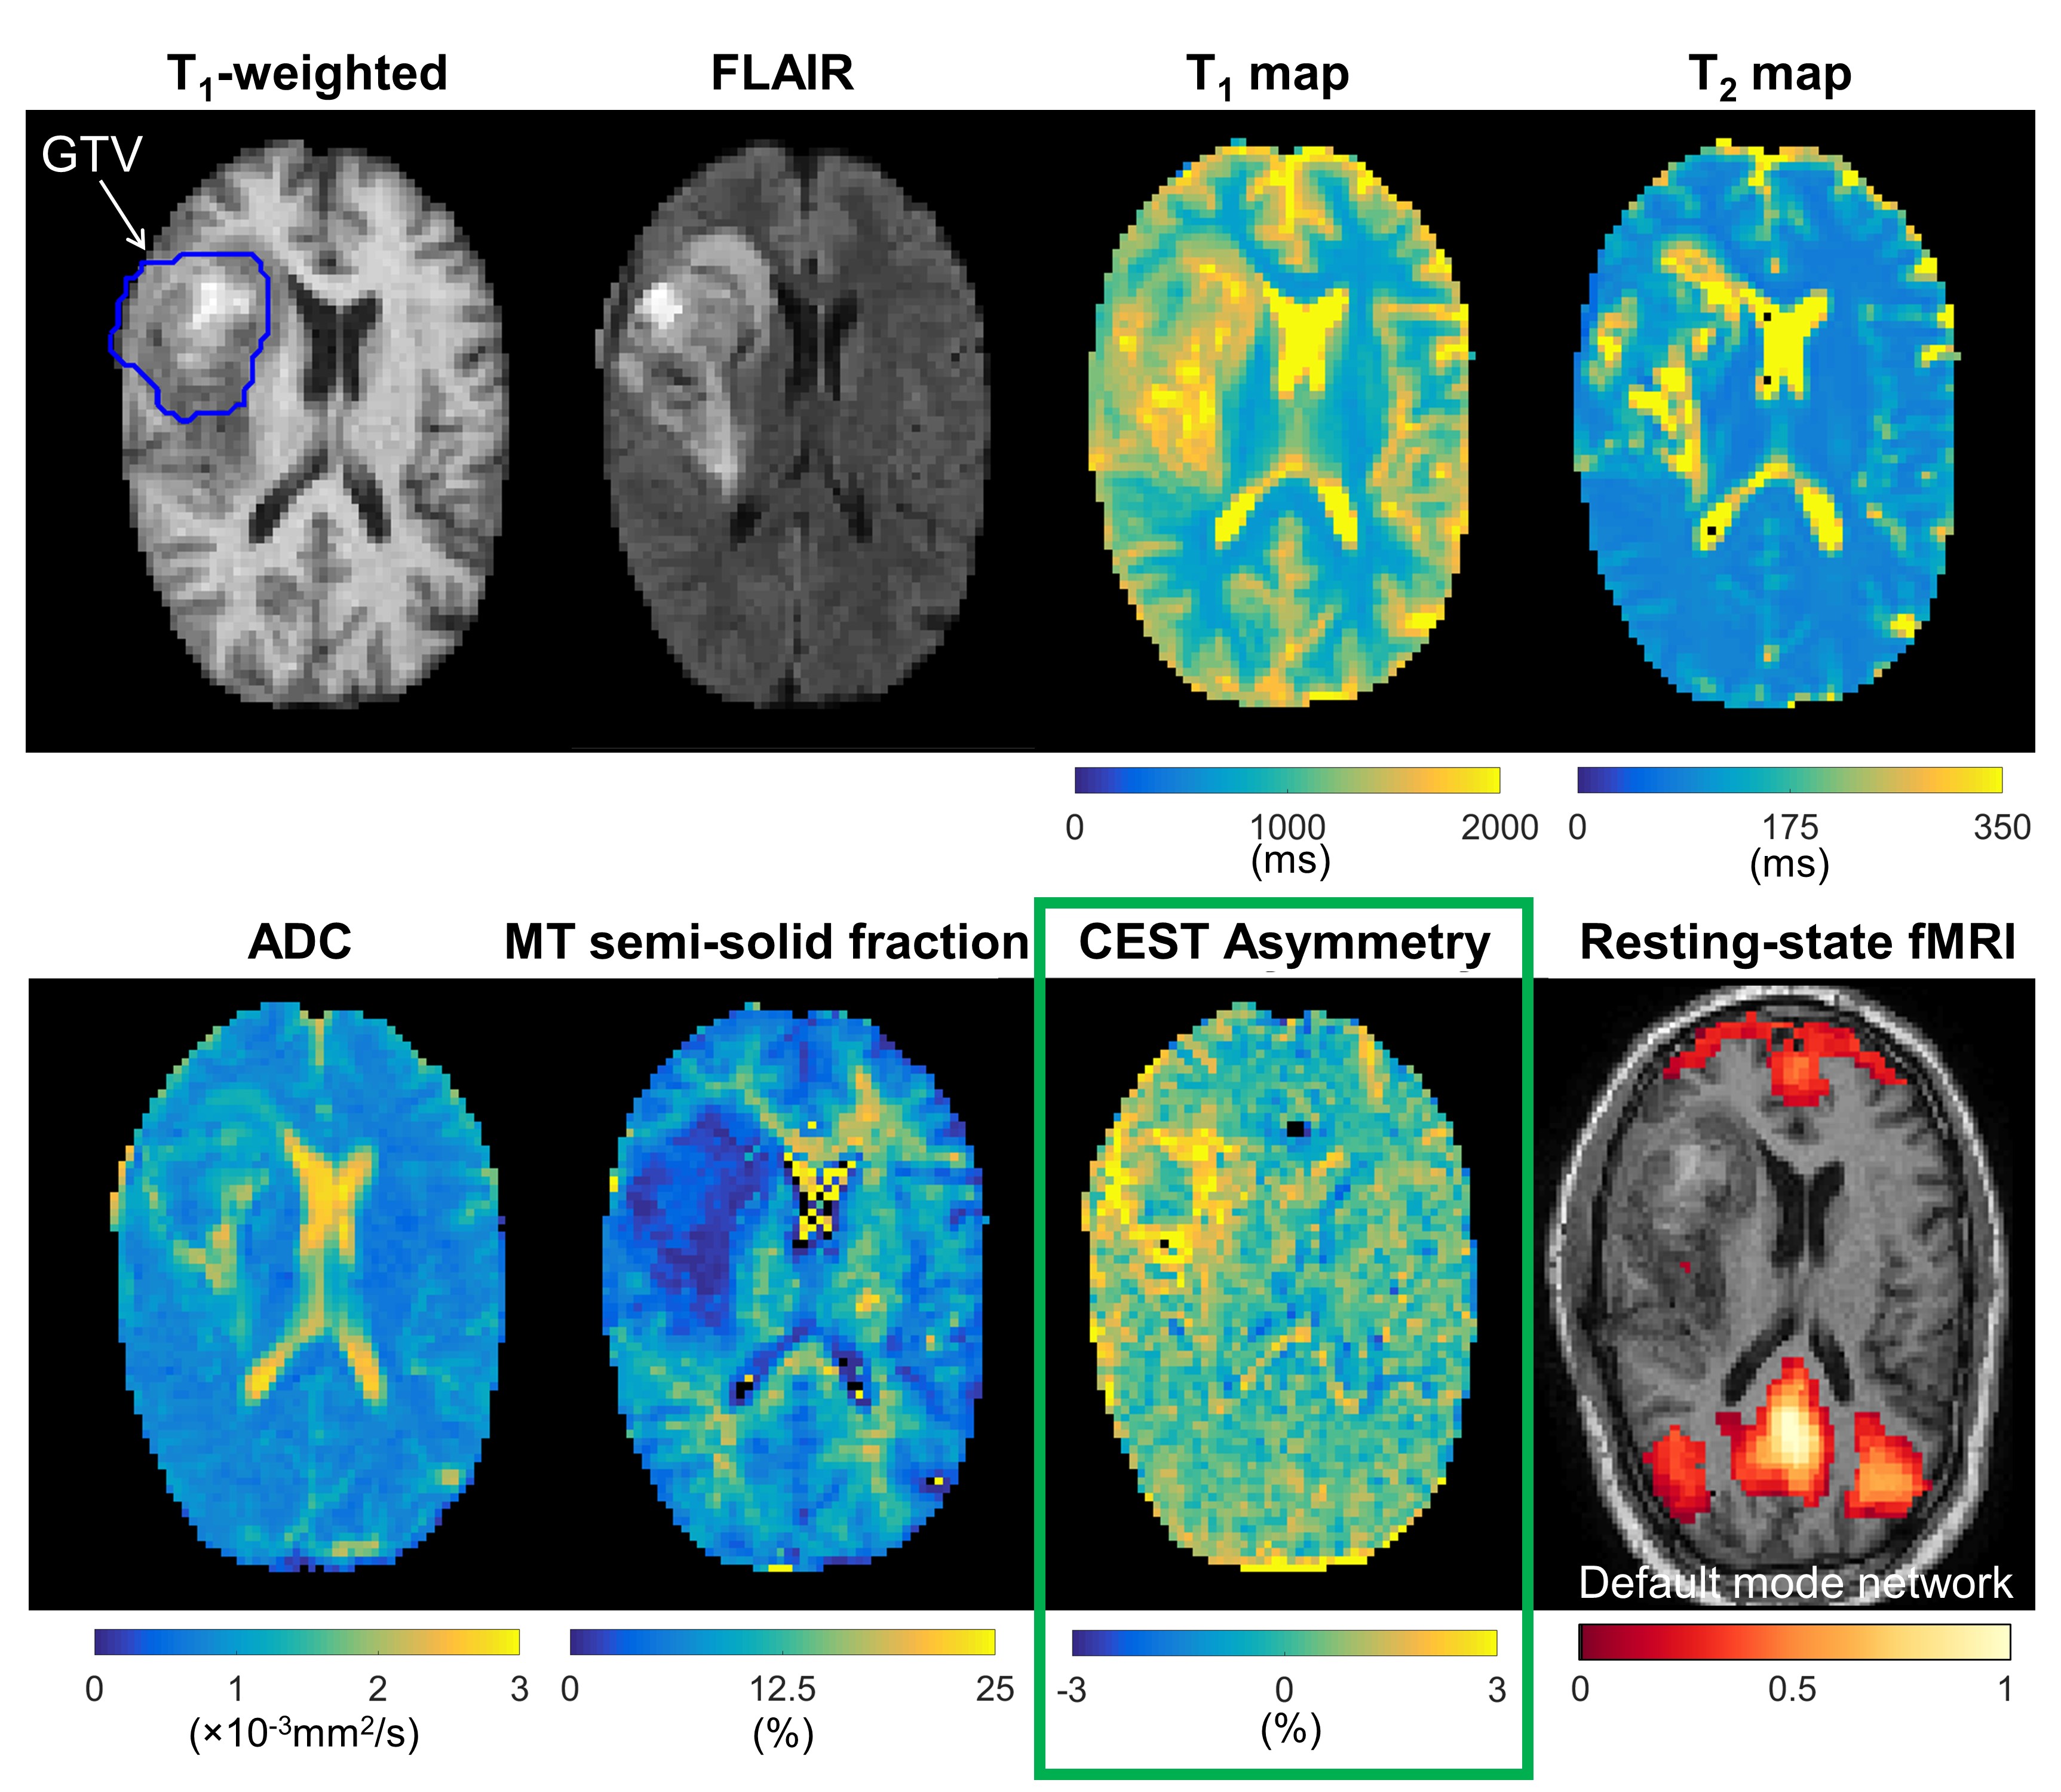
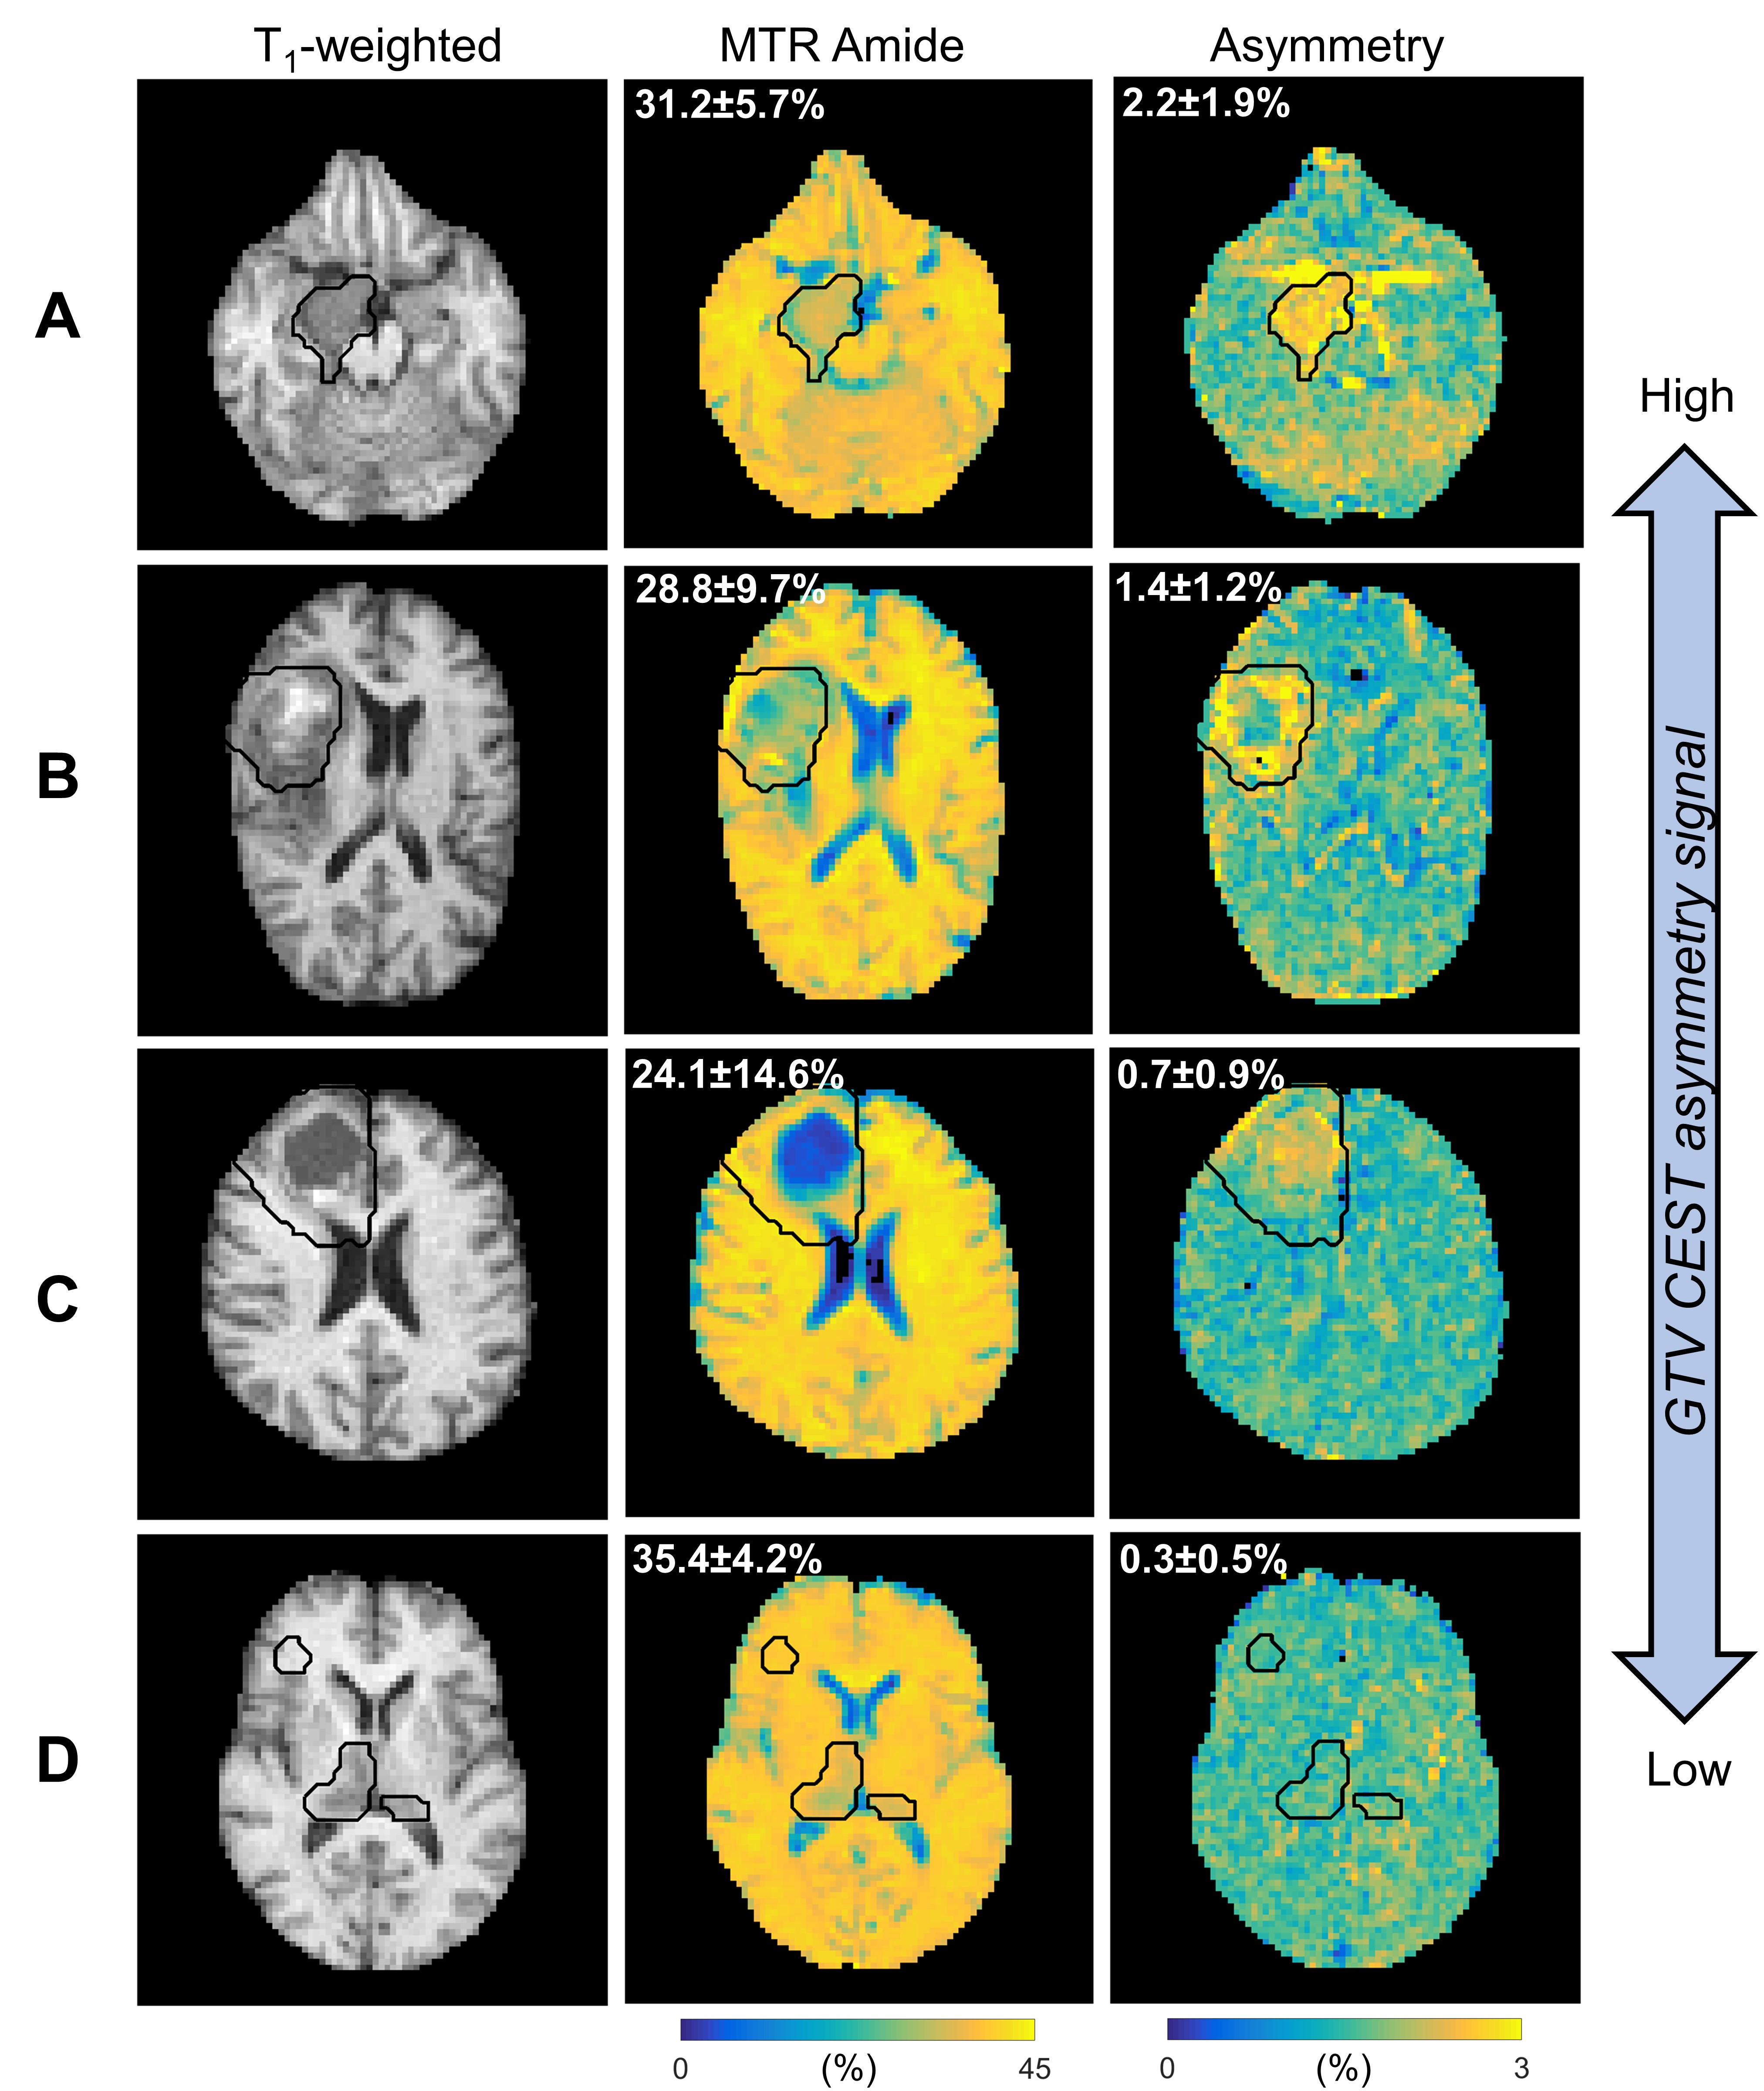
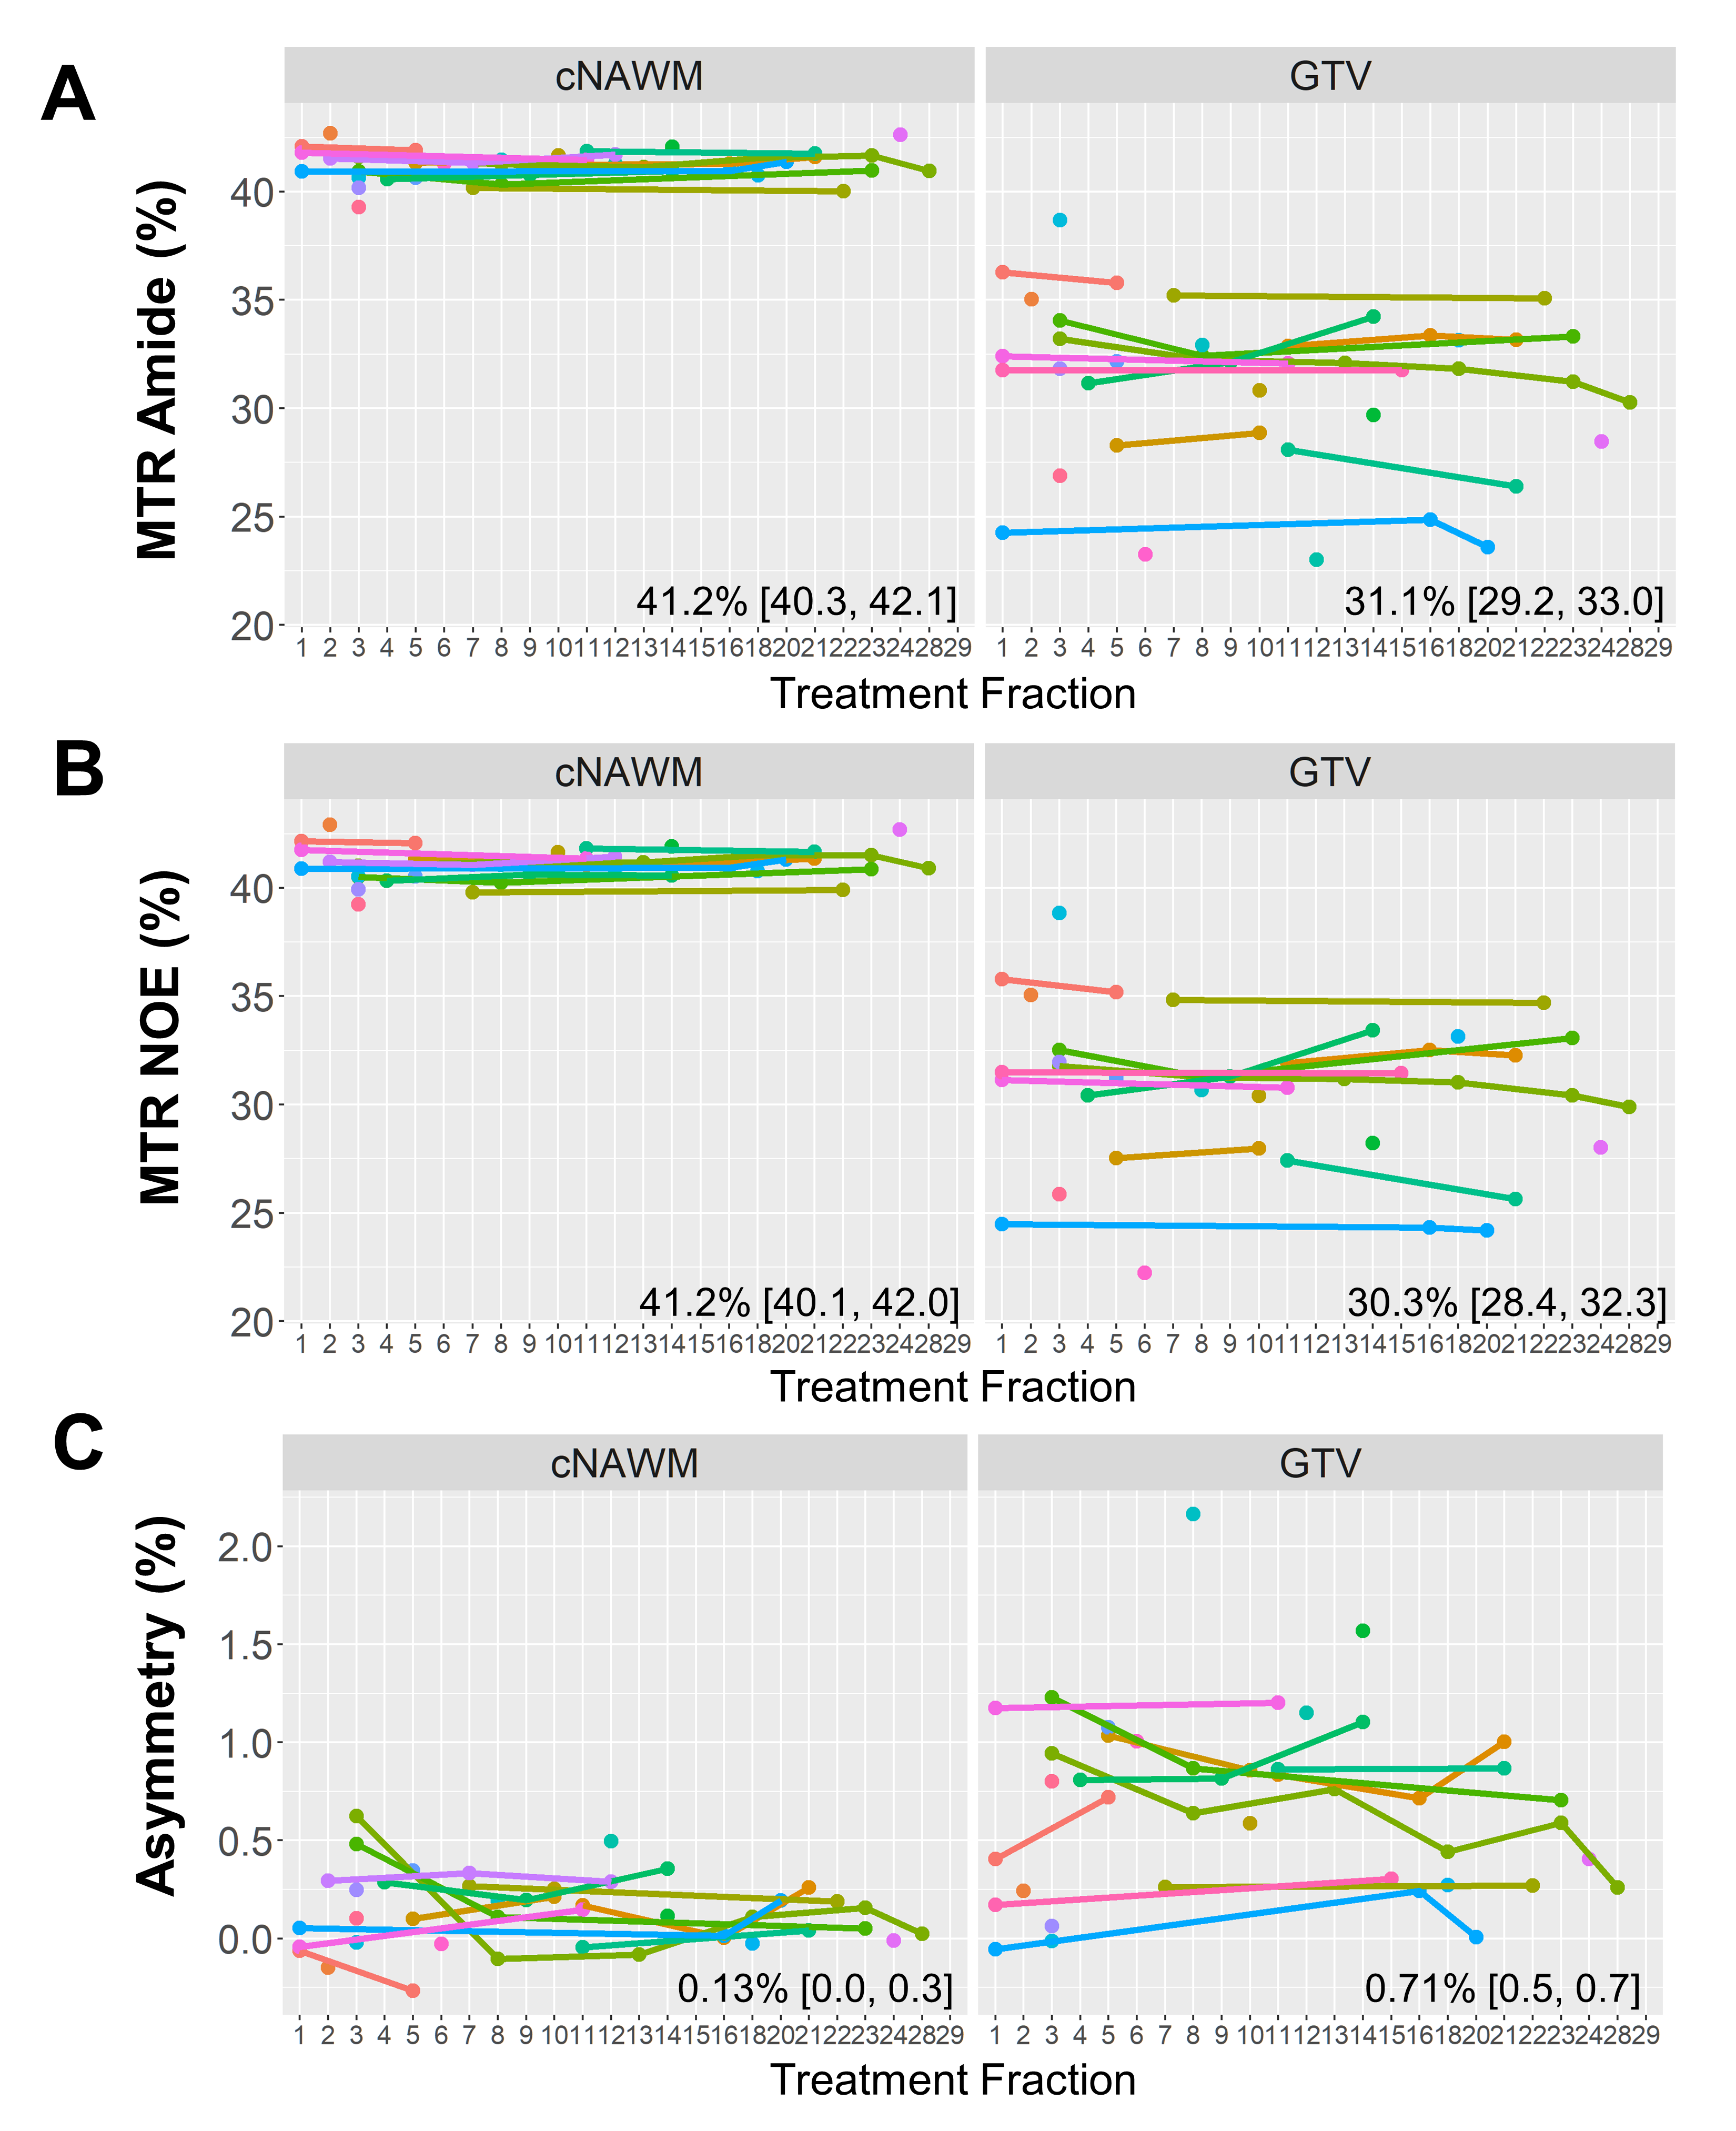
CEST analysis included 24 patients (including 12 GBM, 4 astrocytoma, 3 oligodendroglioma, 3 meningioma and 2 others), scanned on the MR-Linac at selected treatment fractions between 1 and 30. Figure 2 shows a multiparametric dataset acquired for a GBM patient including T1, T2, DWI, MT, CEST and BOLD maps. CEST asymmetry maps in NH4Cl phantoms are shown in Figure 3. The estimated asymmetry was 0.41±0.18% (mean±SD within ROI) for the lowest NH4Cl concentration (7.8mM) and 34.7±1.1% for the highest concentration (1000mM). Figure 4 shows example maps in CNS tumors, which demonstrate a range of GTV asymmetry values; from the set, the highest asymmetry (=2.2%±1.9%) was found in the meningioma (Figure 4A) and comparatively low asymmetry (=0.3±0.5%) was found for the astrocytoma (Figure 4D). The MTRAmide values are also displayed. In Figure 5, parameter values are shown for individual scans, for each subject, treatment fraction, and CEST parameter (MTRAmide, MTRNOE, Asymmetry). Based on mixed effects modelling, significant differences in CEST contrast were found between GTV and cNAWM, with p<0.001 for all three parameters.Discussion
Phantom scans confirmed that CEST asymmetry can be detected on the 1.5T MR-Linac for all NH4Cl concentrations (7.8-1000mM). The in vivo CEST contrast was significantly different between GTV and cNAWM. Reasons for high/low CEST signal across tumors need to be further investigated, and could depend on other factors including resection status, location, or histological subtype. Future work will quantify CEST parameter changes over time and correlate with clinical outcomes.Conclusion
An MR-Linac daily imaging protocol including CEST was presented for obtaining both structural and metabolic information for the purpose of monitoring radiation treatment. In phantoms, positive CEST asymmetry values were detected on the MR-Linac with commonly-used ammonium chloride in phantoms. In patients, significant CEST contrast between GTV and cNAWM signals were found over the entire cohort, for each of the three CEST parameters.Acknowledgements
We would like to thank the MR-Linac radiation therapists Danny Yu, Katie Wong, Helen Su, Monica Foster, Shawn Binda, Rebekah Shin, Ruby Bola, Susana Sabaratram, Christina Silverson and Anne Carty for scanning and for their assistance with the protocol. We gratefully acknowledge the following sources of funding: Natural Sciences and Engineering Research Council (NSERC); the Terry Fox Research Institute; Canadian Institutes of Health Research; the Canadian Cancer Society Research Institute.References
1. Hall WA, Paulson ES, van der Heide UA, Fuller CD, Raaymakers BW, Lagendijk JJW, et al. The transformation of radiation oncology using real-time magnetic resonance guidance: A review. Eur J Cancer 2019;122:42–52. https://doi.org/10.1016/j.ejca.2019.07.021.
2. Cao Y, Tseng CL, Balter JM, Teng F, Parmar HA, Sahgal A. MR-guided radiation therapy: transformative technology and its role in the central nervous system. Neuro Oncol 2017;19:ii16–29. https://doi.org/10.1093/neuonc/nox006.
3. Raaymakers BW, Jürgenliemk-Schulz IM, Bol GH, Glitzner M, Kotte ANTJ, Van Asselen B, et al. First patients treated with a 1.5 T MRI-Linac: Clinical proof of concept of a high-precision, high-field MRI guided radiotherapy treatment. Phys Med Biol 2017;62:L41–50. https://doi.org/10.1088/1361-6560/aa9517.
4. Lagendijk JJW, Raaymakers BW, van Vulpen M. The Magnetic Resonance Imaging–Linac System. Semin Radiat Oncol 2014;24:207–9. https://doi.org/10.1016/j.semradonc.2014.02.009.
5. Kooreman ES, van Houdt PJ, Nowee ME, van Pelt VW, Tijssen RH, Paulson ES, Gurney-Champion OJ, Wang J, Koetsveld F, van Buuren LD, Ter Beek LC. Feasibility and accuracy of quantitative imaging on a 1.5 T MR-linear accelerator. Radiotherapy and Oncology. 2019 Apr 1;133:156-62.
6. Chan RW, Chen H, Myrehaug S, Atenafu EG, Stanisz GJ, Stewart J, Maralani PJ, Chan AK, Daghighi S, Ruschin M, Das S. Quantitative CEST and MT at 1.5 T for monitoring treatment response in glioblastoma: early and late tumor progression during chemoradiation. Journal of Neuro-Oncology. 2020 Nov 16:1-2. https://doi.org/10.1007/s11060-020-03661-y
7. Mehrabian H, Myrehaug S, Soliman H, Sahgal A, Stanisz GJ. Evaluation of Glioblastoma Response to Therapy With Chemical Exchange Saturation Transfer. Int J Radiat Oncol Biol Phys 2018;101:713–23. https://doi.org/10.1016/j.ijrobp.2018.03.057.
8. Mehrabian H, Desmond KL, Soliman H, Sahgal A, Stanisz GJ. Differentiation between radiation necrosis and tumor progression using chemical exchange saturation transfer. Clin Cancer Res 2017;23:3667–75. https://doi.org/10.1158/1078-0432.CCR-16-2265.
9. Mehrabian H, Lam WW, Myrehaug S, Sahgal A, Stanisz GJ. Glioblastoma (GBM) effects on quantitative MRI of contralateral normal appearing white matter. Journal of neuro-oncology. 2018 Aug 1;139(1):97-106.
10. de Mol van Otterloo, S. R. Christodouleas JP, Blezer ELA, Akhiat H, Brown K, Choudhury A, Eggert D, et al. The MOMENTUM Study: An International Registry for the Evidence-Based Introduction of MR-Guided Adaptive Therapy. Front Oncol 2020;10:1328.
11. Hoogcarspel SJ, Zijlema SE, Tijssen RHN, Kerkmeijer LGW, Jürgenliemk-Schulz IM, Lagendijk JJW, et al. Characterization of the first RF coil dedicated to 1.5 T MR guided radiotherapy. Phys Med Biol 2018;63:025014. https://doi.org/10.1088/1361-6560/aaa303.
12. Chan RW, Myrehaug S, Stanisz GJ, Sahgal A, Lau AZ. Quantification of pulsed saturation transfer at 1.5T and 3T. Magn Reson Med 2019;82:1684–99. https://doi.org/10.1002/mrm.27856.
13. Schuenke P, Windschuh J, Roeloffs V, Ladd ME, Bachert P, Zaiss M. Simultaneous mapping of water shift and B 1 (WASABI)—Application to field-Inhomogeneity correction of CEST MRI data. Magn Reson Med 2017;77:571–80. https://doi.org/10.1002/mrm.26133.
14. Jenkinson M, Beckmann CF, Behrens TEJ, et al (2012) FSL. Neuroimage 62:782–790. https://doi.org/10.1016/j.neuroimage.2011.09.015
Figures