0682
Pulmonary acinar structure and function assessed by hyperpolarized 129Xe stimulated echo NMR1Institute of Diagnostic and Interventional Radiology, Hannover Medical School, Hannover, Germany, 2Biomedical Research in Endstage and Obstructive Lung Disease Hannover (BREATH), German Center for Lung Research (DZL), Hannover, Germany, 3Department of Clinical Airway Research, Fraunhofer Institute for Toxicology and Experimental Medicine, Hannover, Germany, 4Department of Respiratory Medicine, Hannover Medical School, Hannover, Germany
Synopsis
A pulse sequence for hyperpolarized 129Xe NMR based on accumulated stimulated echoes has been implemented. Pairs of 90° pulses are repeatedly irradiated at the frequency of 129Xe in tissue-plasma and the decaying signal transferred to the gas phase is subsequently acquired. A study with healthy volunteers and patients of chronic obstructive pulmonary disease (COPD) has been performed to assess the method’s sensitivity for disease. A significant reduction of initial stimulated echo signal and trend for faster decay are observed in COPD. The proposed method has been demonstrated to be highly sensitive for emphysema and hyperinflation and shows promising diagnostic potential.
Introduction
Gas transport in the lung is driven by two mechanisms–convection and diffusion. Since diffusional transport in acinar airways is slow, the lung’s efficiency is reduced, an effect known as acinar screening.1 The situation changes in exercise and disease: Early emphysema leads to reduced alveolar surface area but only mildly diminished gas uptake at rest since the effect of acinar screening is reduced.2 This protective mechanism of the lung may be a reason why early emphysematous lung disease frequently remains unnoticed. 3He MRI has been used for measurements of diffusion in the long regime using stimulated echo-techniques, which are thought to be particularly sensitive to alterations of acinar microstructure and airway connectivity.3,4 The gas uptake process itself, however, remains inaccessible for 3He MRI. Xenon, by contrast to other MR-visible gases, has the unique property of being soluble in biological tissues, opening new avenues for assessing both gas uptake and lung structure noninvasively by hyperpolarized 129Xe MRI.5–7 Purpose of this work was to develop a pulse sequence particularly sensitive for early emphysematous changes in the acinus by creating stimulated echoes (STE) in gas phase 129Xe transferred from accumulated excitations of dissolved-phase 129Xe and to test its sensitivity in a clinical study with patients of chronic obstructive pulmonary disease (COPD) and healthy volunteers.Methods
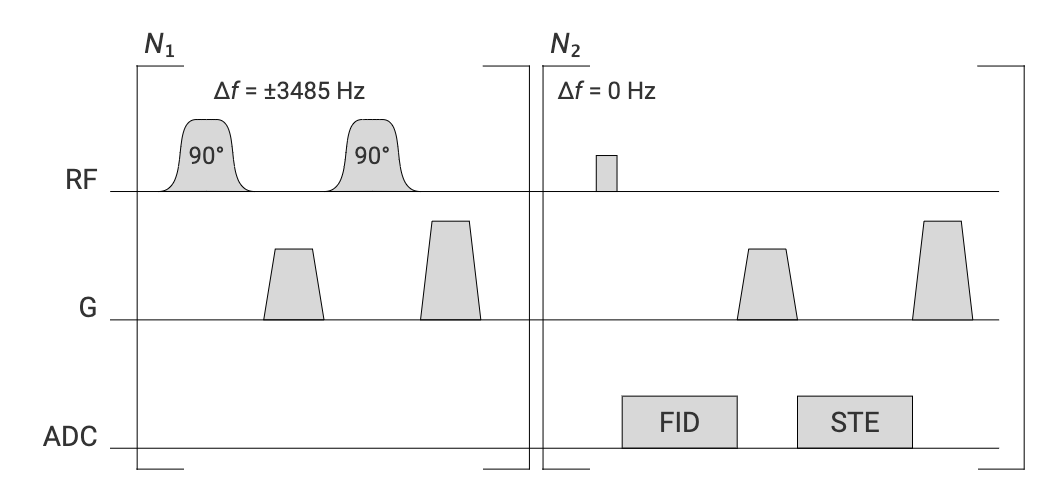
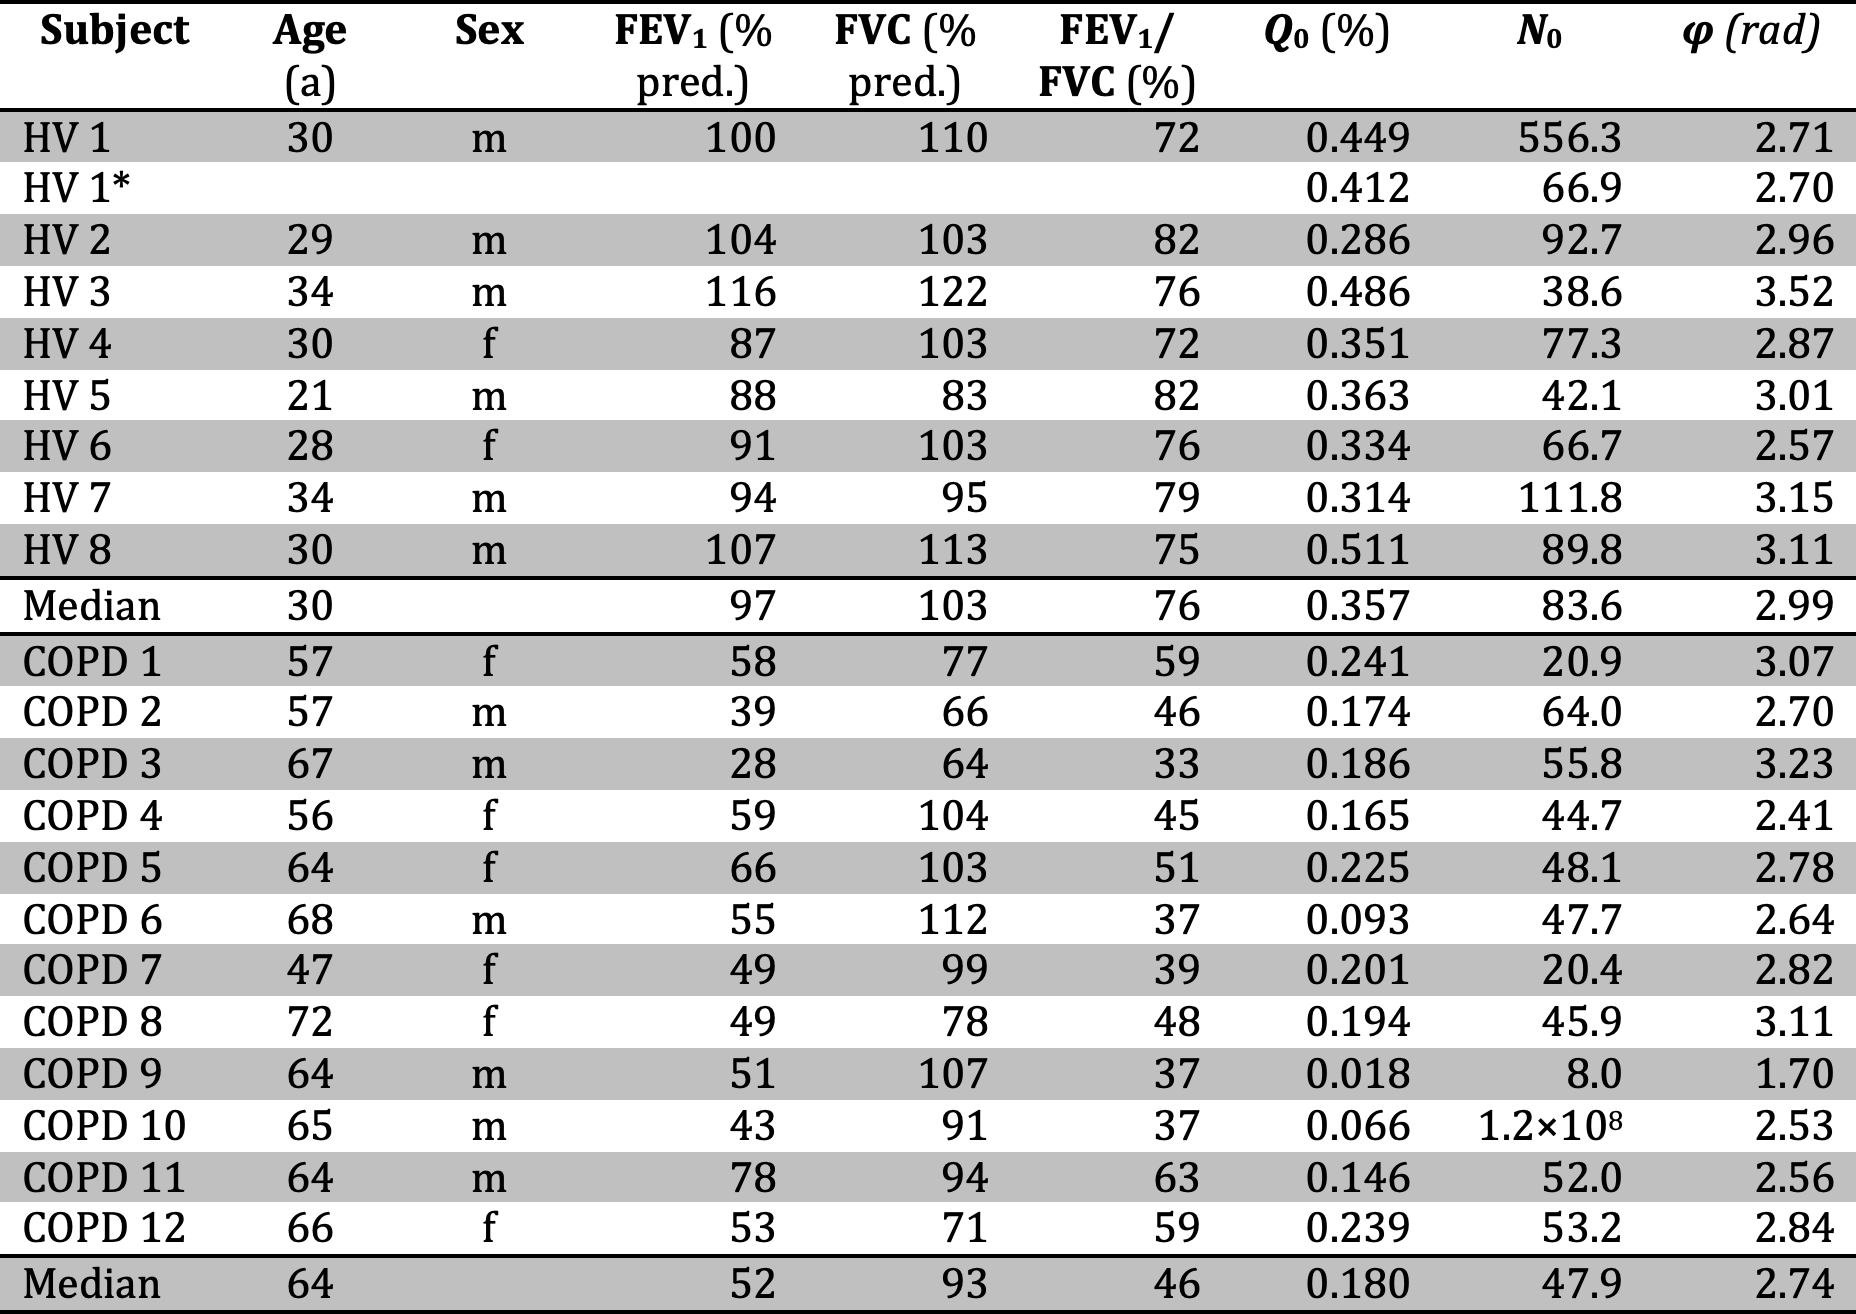
A pulse sequence according to the diagram in Figure 1 was implemented. A 90° Fermi-shaped pulse of width 2300µs centered on the tissue/plasma resonance at Δf=3485Hz is irradiated followed by a dephasing gradient and another 90° pulse of same frequency and phase. To accumulate spatially modulated magnetization, this first module was repeated N1=20 times with TR1=21.8ms. Subsequently, a train of N2=50 excitation and readout elements was played out with TR2=12.3ms to obtain both FID and STE signals. As a control acquisition, the pulse sequence was repeated with off-resonance frequency Δf=–3485Hz and orthogonal orientation of the de-/rephasing gradients.The performed study was approved by the institutional review board and written informed consent was obtained from all subjects. 12 patients of COPD and 8 healthy volunteers (HV) were included in the study, see Table 1 for subject demographics. 129Xe imaging was performed at 1.5T (Avanto, Siemens, Erlangen, Germany) using a custom-made coil (Rapid Biomedical, Rimpar, Germany). A repeated MRI scan was performed in HV1. All subjects underwent conventional lung function testing.
Data were corrected for off-resonance apparent in FID signals and Fourier-transformed for visual inspection. Signals in the STE pathway were subsequently phase corrected using averaged data from the first three acquisitions. The real parts of both signals were integrated and the ratio Q of phase-corrected STE and FID signal was computed for each acquisition. Since the total diffusion-weighting b caused by the STE dephasing gradients increases linearly with acquisition number, an approximately exponential decay of the STE signal due to diffusion attenuation is expected and the following function was fit to the data,
$$Q(N)=Q_0\mathrm{exp}(-N/N_0)$$
with N the acquisition number.
Results
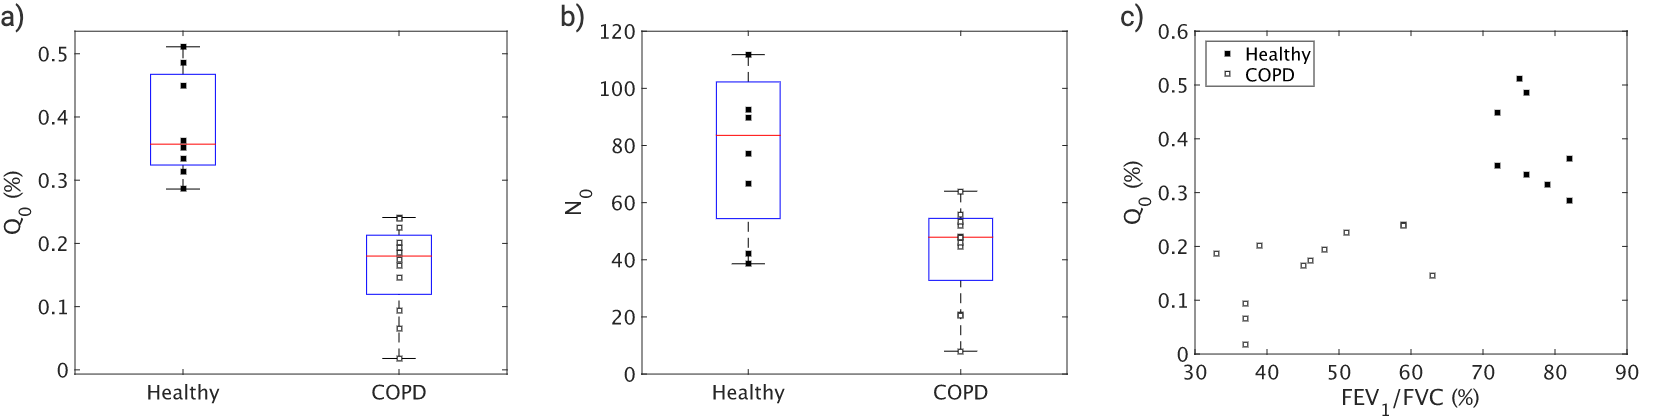
Figure 2 shows exemplary FID and STE spectra from a healthy volunteer and a COPD patient for both off-resonance frequencies. Only small contamination possibly from parasitic excitation is apparent in the control acquisition. A clear decay of the ratio Q with increasing acquisition number was observed in all subjects as apparent in Figure 3. Fitting results are shown in Table 1. The phase of the STE signal is mostly close to, but significantly different from π in a Wilcoxon signed-rank test in COPD patients, P=0.0024. Plots comparing fitting results of Q0 and N0 are shown in Figure 4. In a Wilcoxon rank-sum test Q0 is significantly reduced in COPD, P=2.5e–4, while there is also a trend for reduced N0, P=0.0698. Q0 is significantly correlated with FEV1/FVC in the study population, Spearman-ρ=0.81, P=1.5e–5.Discussion
We developed a new hyperpolarized 129Xe MR pulse sequence for assessment of pulmonary acinar structure and function, which has been shown to be particularly sensitive for emphysema and/or hyperinflation. In order to improve the SNR, we implemented a train of 90° pulse pairs for accumulating STE signal as motivated by work from Gutjahr et al.8 Compared to existing methods probing hyperpolarized 129Xe exchange like XTC,9 the proposed method does not necessitate control acquisitions in principle. The method probes gas diffusion on the time scale of ~1s corresponding roughly to the acinar length scale and thus suggesting sensitivity to acinar structure, which still needs to be validated by histological comparison. One limitation of the proposed approach is the more qualitative assessment of emphysema by the quantities Q0 and N0, which are expected to depend on sequence parameters. Further, in some COPD patients the obtained signal Q0 was apparently too small to allow accurate quantification of N0. The method is also suspected to be susceptible to motion. This could possibly be reduced by adding 1D readouts for resolving the spatially modulated magnetization in the STE pathway. This may require parameter optimization or use of higher 129Xe doses and polarization levels to achieve higher SNR.Conclusion
A new pulse sequence for assessment of pulmonary acinar structure and function has been developed which has been shown to be highly sensitive for emphysema and hyperinflation and thus shows promising diagnostic potential.Acknowledgements
This work was funded by the German Center for Lung Research (DZL).References
1. Weibel ER, Sapoval B, Filoche M. Design of peripheral airways for efficient gas exchange. Respir Physiol Neurobiol 2005; 148: 3–21.
2. Sapoval B, Filoche M. Role of Diffusion Screening in Pulmonary Diseases. In: Poulin M, Wilson R (eds) Integration in Respiratory Control. Advances in Experimental Medicine and Biology. New York: Springer, 2008, pp. 173–178.
3. Owers-Bradley JR, Fichele S, Bennattayalah A, et al. MR tagging of human lungs using hyperpolarized 3He gas. J Magn Reson Imaging 2003; 17: 142–146.
4. Woods JC, Yablonskiy DA, Chino K, et al. Magnetization Tagging Decay to Measure Long-Range 3He Diffusion in Healthy and Emphysematous Canine Lungs. Magn Reson Med 2004; 51: 1002–1008.
5. Kern AL, Gutberlet M, Qing K, et al. Regional investigation of lung function and microstructure parameters by localized 129 Xe chemical shift saturation recovery and dissolved-phase imaging: A reproducibility study. Magn Reson Med 2019; 81: 13–24.
6. Kern AL, Gutberlet M, Voskrebenzev A, et al. Mapping of regional lung microstructural parameters using hyperpolarized 129 Xe dissolved‐phase MRI in healthy volunteers and patients with chronic obstructive pulmonary disease. Magn Reson Med 2019; 81: 2360–2373.
7. Kern AL, Gutberlet M, Moher Alsady T, et al. Investigating short‐time diffusion of hyperpolarized 129 Xe in lung air spaces and tissue: A feasibility study in chronic obstructive pulmonary disease patients. Magn Reson Med 2020; 84: 2133–2146.
8. Gutjahr FT, Munz E, Jakob PM. Positive chemical exchange contrast in MRI using Refocused Acquisition of Chemical Exchange Transferred Excitations (RACETE). Z Med Phys 2019; 29: 184–191.
9. Ruppert K, Brookeman JR, Hagspiel KD, et al. Probing lung physiology with xenon polarization transfer contrast (XTC). Magn Reson Med 2000; 44: 349–357.
Figures