0568
Beat Pilot Tone: Exploiting Preamplifier Intermodulation of UHF/SHF RF for Improved Motion Sensitivity over Pilot Tone Navigators
Suma Anand1 and Michael Lustig1
1Electrical Engineering and Computer Sciences, University of California, Berkeley, Berkeley, CA, United States
1Electrical Engineering and Computer Sciences, University of California, Berkeley, Berkeley, CA, United States
Synopsis
Pilot Tone (PT) navigators are tones within the MR receiver bandwidth that are used to estimate subject motion. Unfortunately, PTs are bound to the Larmor frequency with a wavelength of 1-4.7m (7T to 1.5T), limiting their sensitivity to motion. We propose a new approach, Beat Pilot Tone (BPT), which overcomes this limitation using second order intermodulation in MR coil preamplifiers (preamps). Any two tones separated by the desired PT frequency are mixed at the preamp and digitized by the receiver. We demonstrate our approach at 2.4GHz, obtaining improved sensitivity (20x) compared to PT without reduction of image SNR.
Introduction
Accurate motion sensing is essential to resolve motion at multiple spatial and temporal scales within the human body. Conventional motion sensing requires on-patient hardware or sequence-specific changes (e.g. navigators) and may be inconsistent between subjects. Recently, Pilot Tone (PT) navigators have been proposed as an alternative method1-4. Requiring no on-patient hardware, PTs are pure tones within the MR bandwidth that are modulated by patient motion and received by the receiver coils. The PT contains respiratory and cardiac information and can be easily separated from the image1-4. However, the PT frequency is tied to the Larmor frequency and has a wavelength of 1-4.7m (7T-1.5T), which limits its sensitivity to motion within the body (Figure 1a-b).In this work, we propose a new approach, Beat Pilot Tone (BPT), that overcomes this limitation. The main idea is that even the most linear preamplifiers still exhibit some second order intermodulation. We transmit two high-frequency tones separated by the desired BPT frequency within the bandwidth of the MR receiver (Figure 1c). These signals are picked up by the receiver coils, mixed at the preamplification stage via intermodulation, then digitized by the receiver chain. Since the MR signal is small (< -30dBm)5, little transmit power is necessary to induce an intermodulation at a similar amplitude as the MR. For this work, we leverage consumer grade hardware for the 2.4GHz ISM band as a proof of concept. At this frequency, the wavelength is 12.5cm; therefore, BPT obtains greatly improved (20x) sensitivity to motion compared to PT. We demonstrate our method with a respiratory phantom, a volunteer, and an SNR map.
Methods
MechanismThe PT and BPT signals are sensitive to motion via two mechanisms:
- Impedance changes - Subject motion changes the impedance of the coil, causing mainly intensity changes.6
- Multi-path length - The transmitted wave experiences changes in path length, reflections, and attenuation from subject motion, resulting in amplitude and phase modulations.
We transmit two signals at two different frequencies $$$f_T$$$ (2.4GHz) and $$$f_T + f_{BPT}$$$, where $$$f_{BPT}$$$ is an offset frequency within the MR bandwidth, for example, $$$f_{BPT} = f_{larmor} + 100kHz$$$. A beat frequency $$$f_{BPT}$$$ is created via mixing in the preamplifier; this signal is the BPT.
Hardware setup
Figure 2a shows the transmission setup. Each transmit frequency was controlled by an Ettus Research B200 software-defined radio (SDR; National Instruments, TX, USA) and synchronized to the system 10MHz clock. The ~10dBm signals were combined, amplified by 17dB, high-pass filtered, and transmitted by a panel antenna placed inside the bore above the subject (Figure 2b). For comparison, a PT close to the Larmor frequency was transmitted using a waveform generator (Siglent SDG6022X, Siglent Technologies, OH, USA). The calculated power output of the BPT was approximately 20dBm at the antenna. The gains of the PT and BPT were adjusted to similar received levels.
Acquired scans
All scans were acquired on a GE 3T MR750W system using a 2D axial balanced SSFP sequence. Phantom scans were acquired on a pneumatic phantom using a 32-channel body coil (TR=3.6ms, FA=35). Two scans were acquired on a volunteer (TR=4.6ms, FA=35): a head scan using a 22-channel head-neck coil and an abdominal scan using a 32-channel body coil. In the first scan, the volunteer moved their head up and down (anterior/posterior). In the second scan, the volunteer breathed normally. To evaluate SNR, a uniform phantom was scanned with BPT, PT, and no PT using a 2D SPGR sequence (TR=34ms, FA=30, resolution=0.9mm). An SNR map was computed using the method developed by Kellman et al7.
Reconstruction
The BPT signal forms a line in ky-f space after taking a Fourier transform along the readout direction (Figure 2c). To reconstruct the BPT signal, we demodulate the raw data by the BPT frequency ($$$f_{BPT}$$$) for each TR and each coil. To avoid phase wrapping and inconsistency between the BPT hardware and MR system, we subtract the phase of a reference coil from each of the coil signals.
Results
Figure 3b shows the results of the motion phantom experiment, where the y-axis is the signal amplitude divided by the mean. The BPT shows 20x greater modulation in magnitude and in phase than the PT.Figure 4 shows the results of the in-vivo experiments. Figure 4b shows the signals from the three most modulated coils for the head motion experiment. The small (~cm) scale motion (black arrows) is evident in the BPT magnitude and phase, but difficult to see in the PT magnitude and phase. Figure 4e shows that both the BPT and PT capture respiratory motion comparably to bellows.
Figure 5 shows the computed SNR maps. The SNR maps (5a) and line profiles (5b) are nearly identical between conditions.
Conclusion
We have proposed BPT, a new, flexible motion sensing method that offers high sensitivity to small-scale motion within the body without on-subject hardware. We demonstrated that BPT outperforms PT in detecting motion while not affecting image SNR.Acknowledgements
We sincerely thank Alan Dong for suggesting the beat frequency idea, and acknowledge Karthik Gopalan, Jason Stockmann, and Jonathan Polimeni for their code to compute image SNR. We acknowledge support from NIH grants U01 EB025162, R01HL136965, and U01EB029427.References
- Speier, P., M., et al. "PT‐Nav: a novel respiratory navigation method for continuous acquisitions based on modulation of a pilot tone in the MR‐receiver." Proc. ESMRMB 32 (2015): 128.
- Bacher, M. et al. “Retrospective Analysis of Pilot Tone Derived Cardiac and Respiratory Motion Information in a Patient Cohort”. Proc. ISMRM (2020).
- Vahle, Thomas, et al. "Respiratory Motion Detection and Correction for MR Using the Pilot Tone: Applications for MR and Simultaneous PET/MR Examinations." Investigative Radiology 55.3 (2020): 153-159.
- Solomon, Eddy, et al. "Free-breathing radial imaging using a pilot-tone radiofrequency transmitter for detection of respiratory motion." Magnetic Resonance in Medicine (2020).
- Sporrer, Benjamin, et al. "A fully integrated dual-channel on-coil CMOS receiver for array coils in 1.5–10.5 T MRI." IEEE transactions on biomedical circuits and systems 11.6 (2017): 1245-1255.
- Stang, Pascal P., J. Pauly, and Greig C. Scott. "A versatile in-line sensor for power monitoring and calibration of transmit arrays." Proc. ISMRM (2009).
- Kellman, P. and Elliot R. McVeigh. "Image reconstruction in SNR units: a general method for SNR measurement." MRM 54.6 (2005): 1439-1447.
Figures
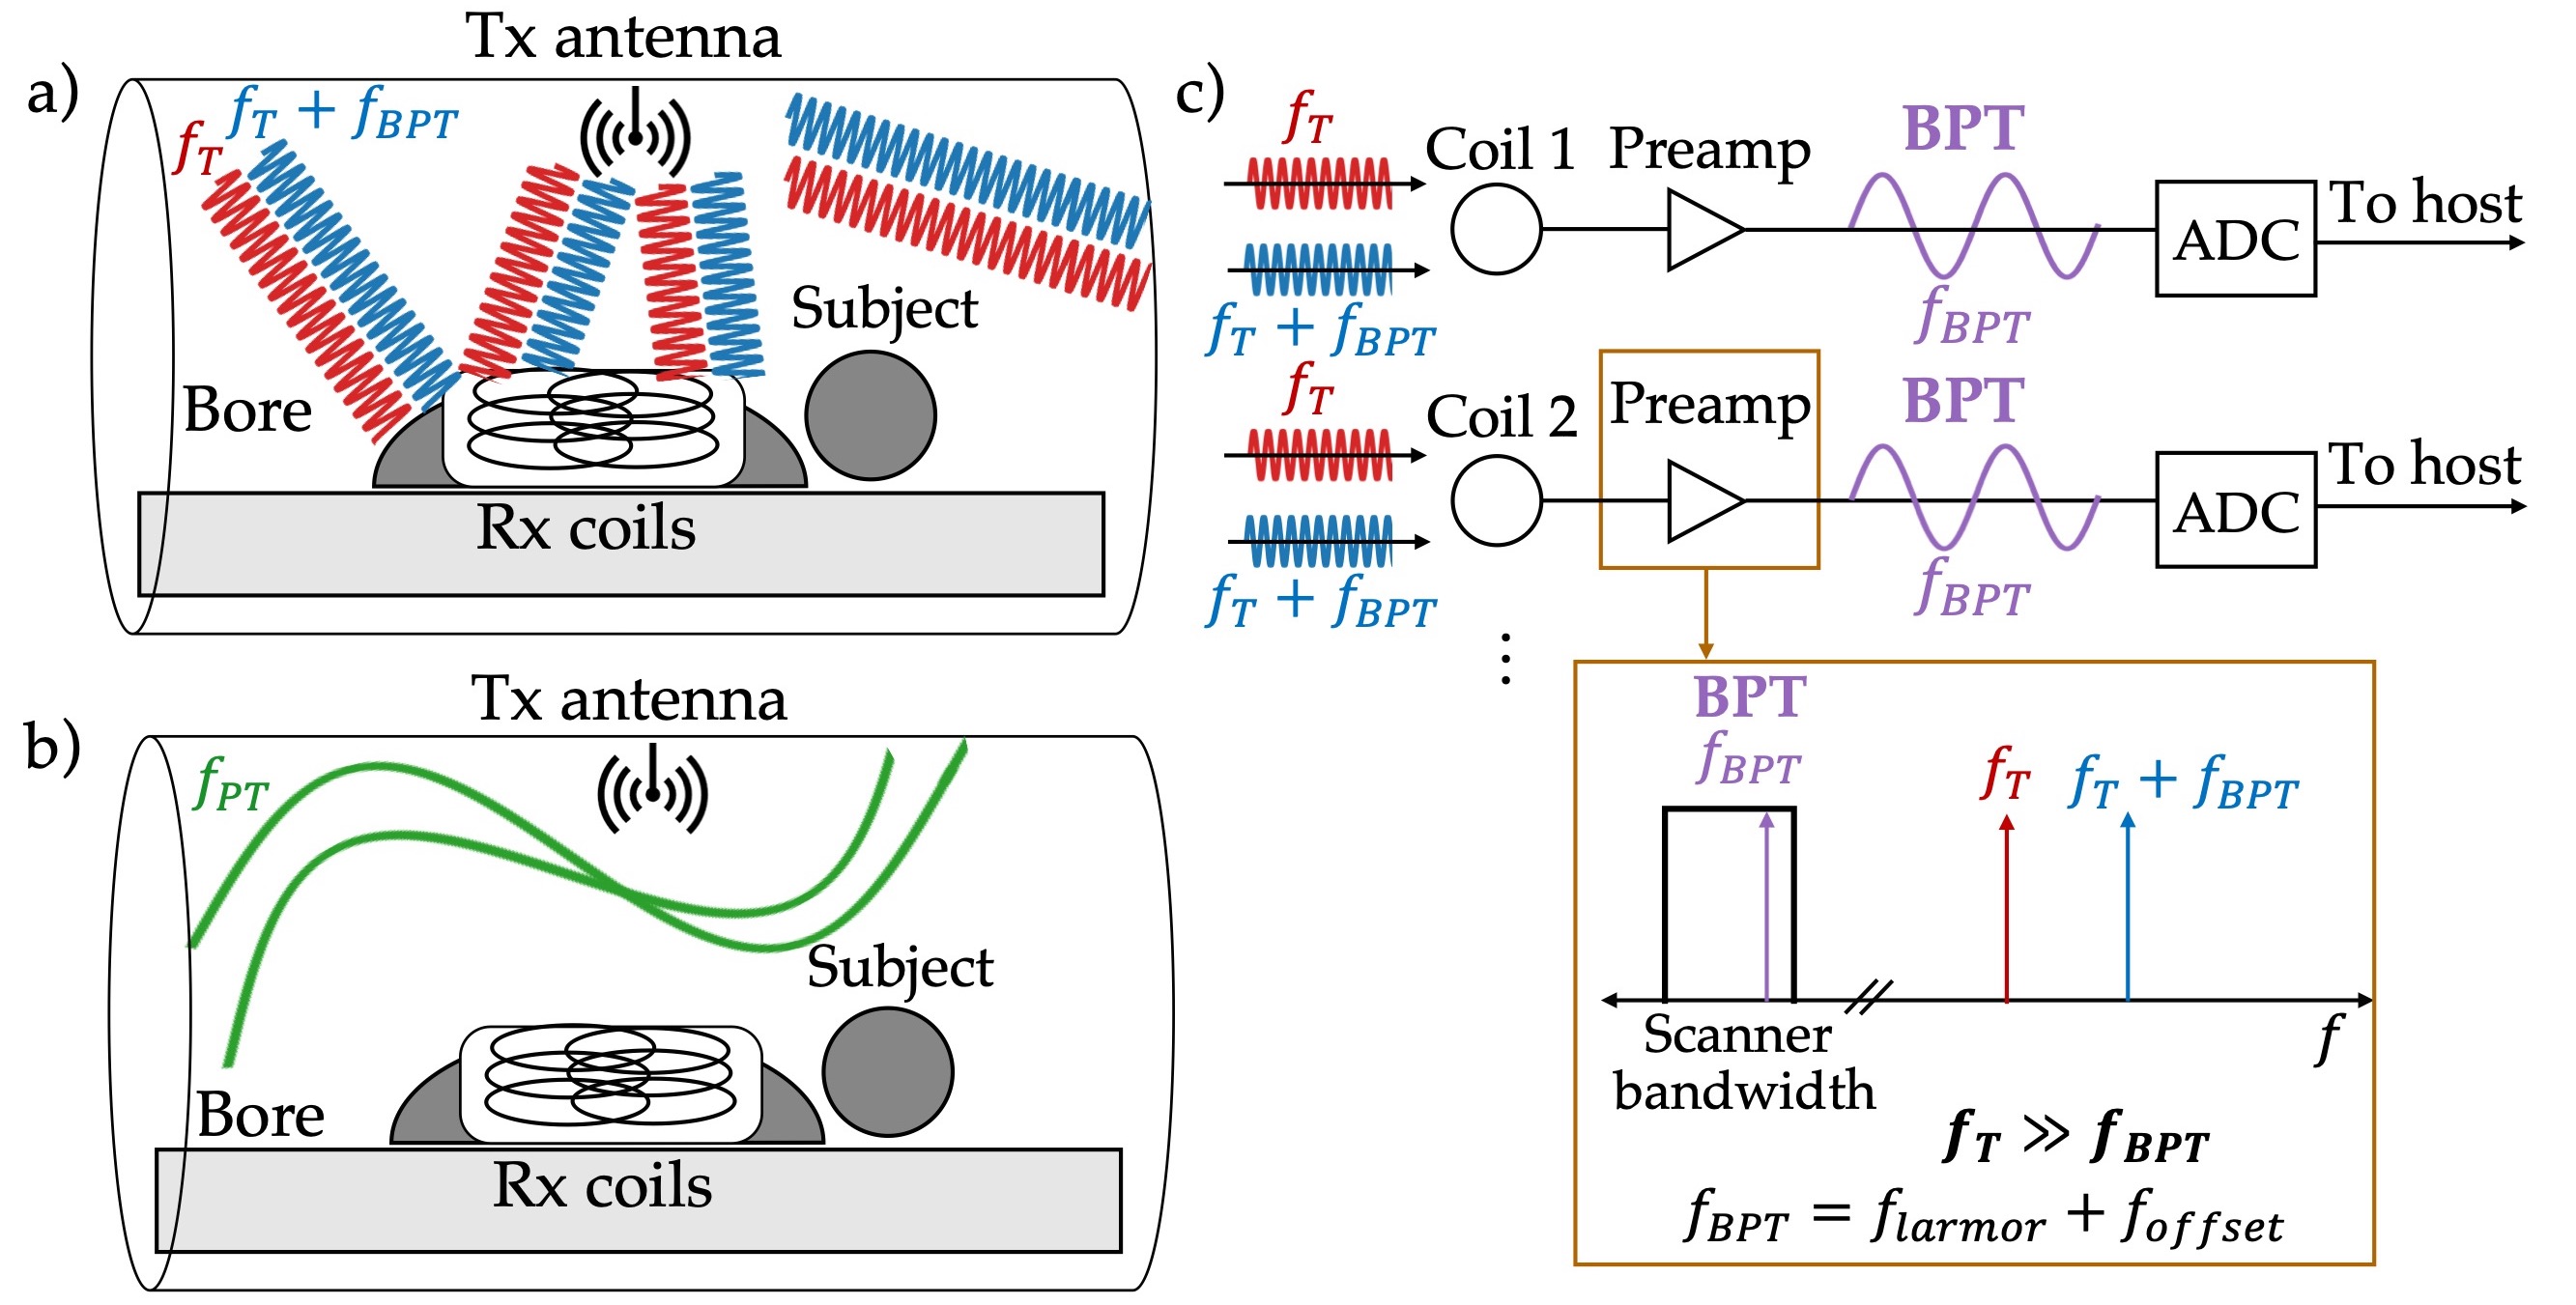
Figure 1: A schematic illustration of (a) Beat Pilot Tone (BPT) vs. (b) Pilot Tone (PT) acquisitions. PT has a 2.347m wavelength ($$$f_{PT} = 127.8MHz$$$), while BPT has a 12.5cm wavelength ($$$ f_T = 2.4GHz $$$); thus, there is much more interaction between BPT and the cm-scale motion of the body. c) BPT uses two frequencies, $$$f_T$$$ and $$$f_T+f_{BPT}$$$, where $$$f_{BPT}=f_{larmor} + f_{offset}$$$ (e.g., $$$f_{offset} = 100kHz$$$). A signal with a beat frequency $$$f_{BPT}$$$ is mixed in the coil preamplifier due to intermodulation; this signal is the BPT.
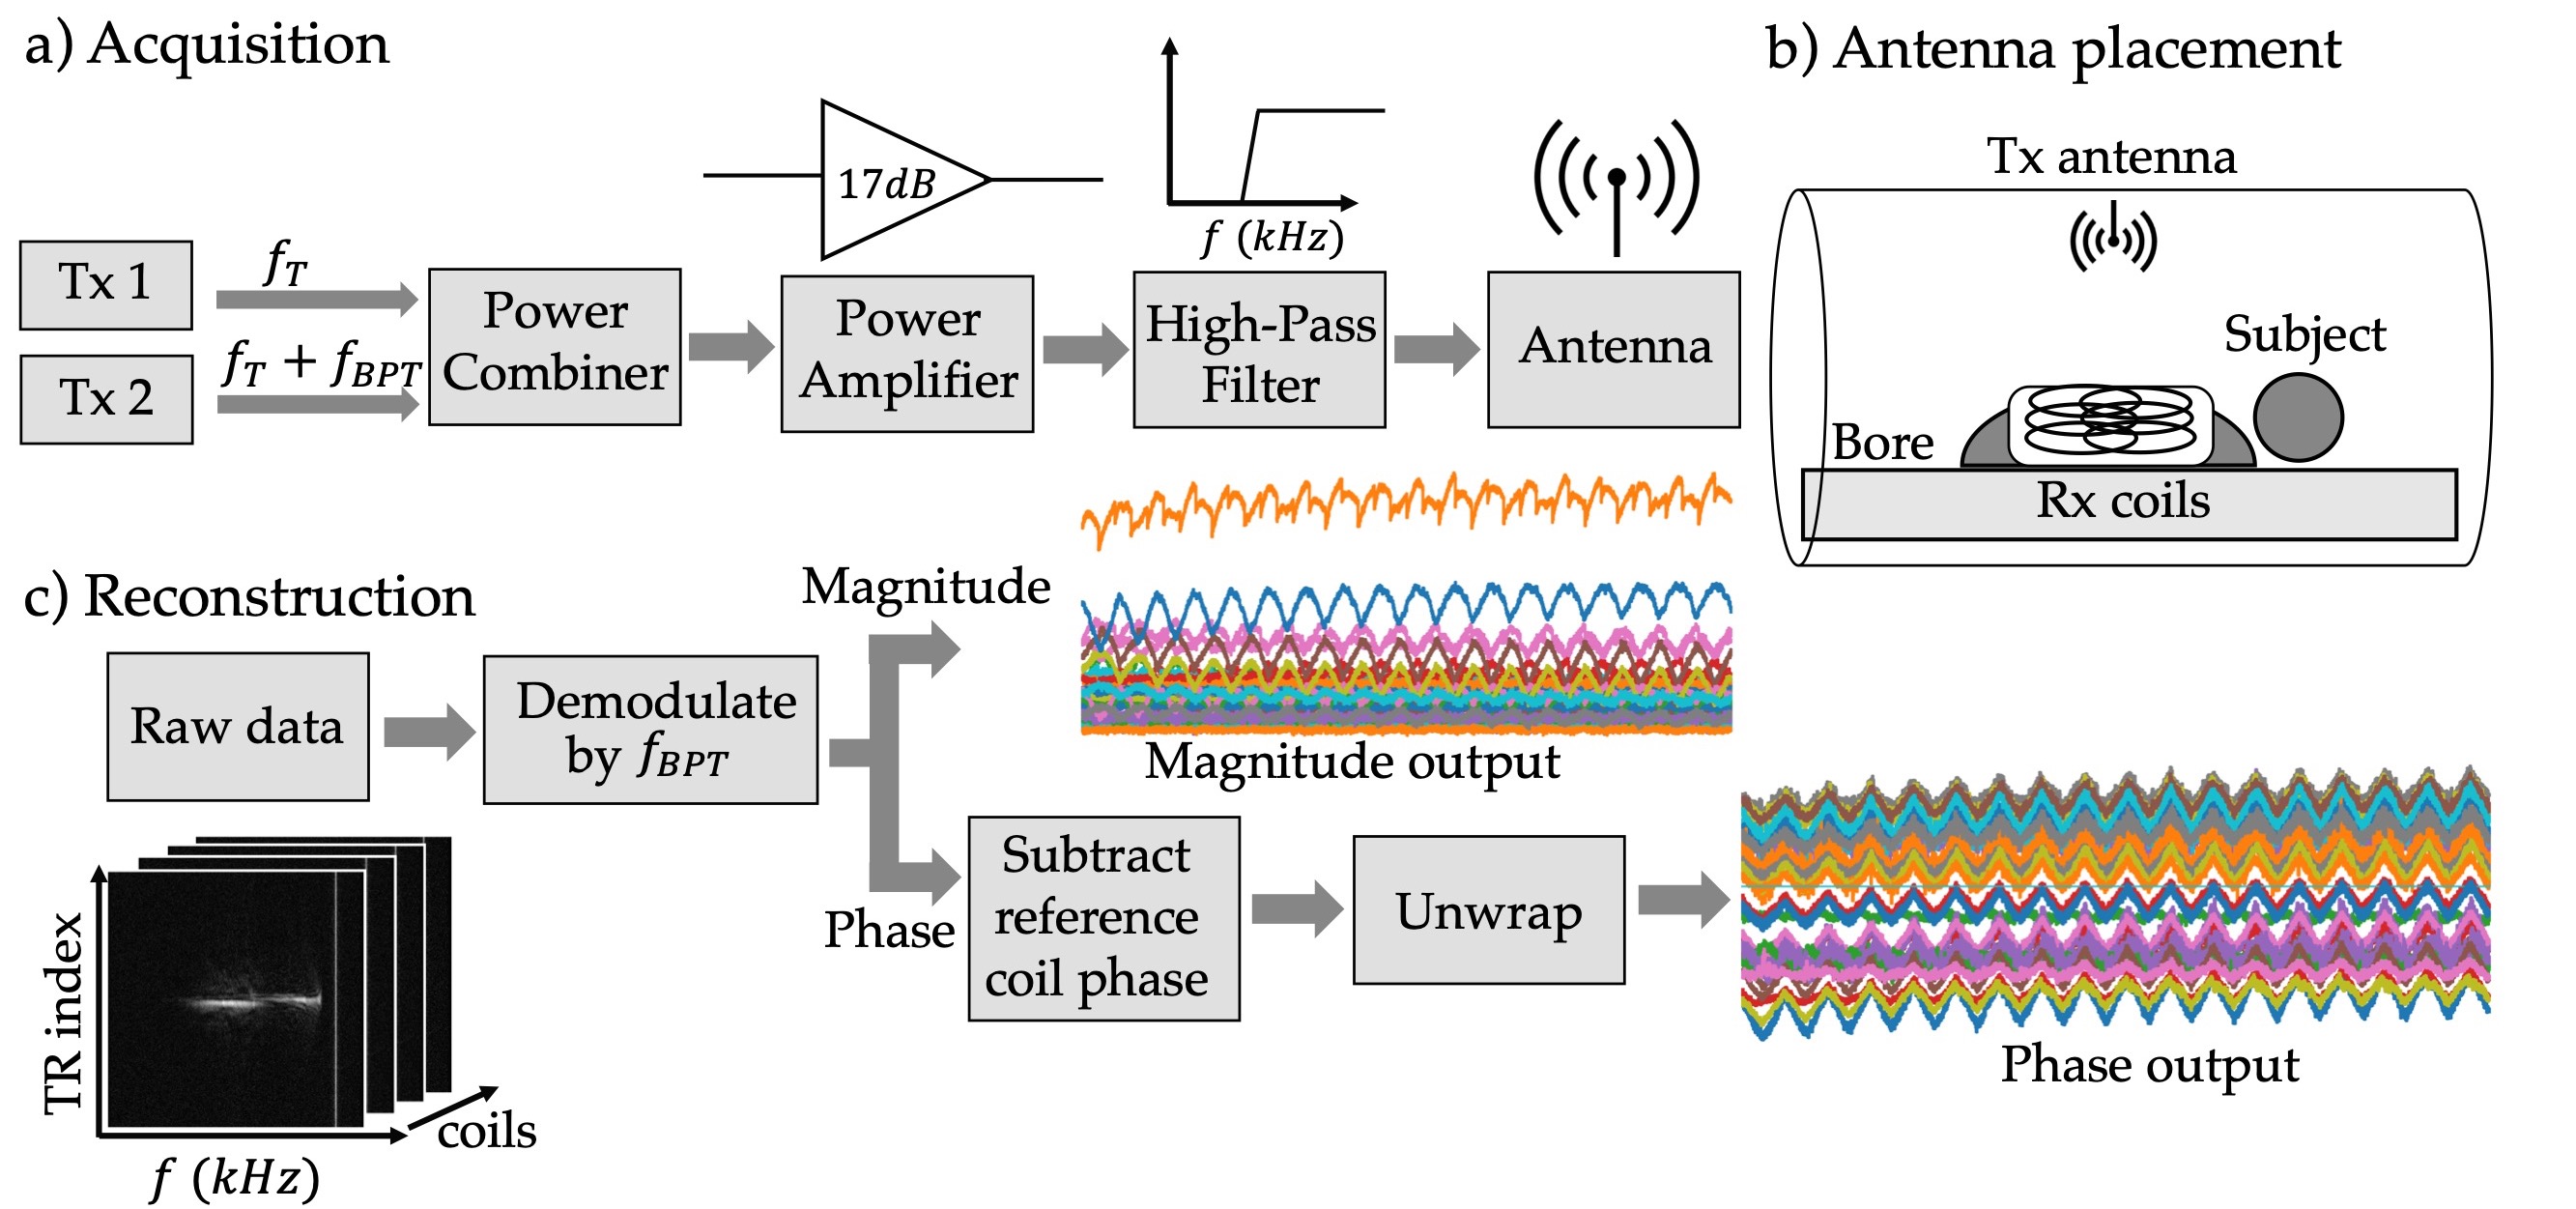
Figure 2: a) The BPT acquisition setup - two signals at frequencies $$$f_T$$$ and $$$f_T + f_{BPT}$$$ are combined, amplified, filtered, and transmitted to the antenna. b) The antenna is placed inside the bore above the subject with its plane parallel to the subject. c) The BPT forms a line in ky-f space after taking a Fourier transform along the readout direction. Raw data is demodulated by frequency $$$f_{BPT}$$$ for all coils. In order to unwrap the phase, a reference coil is chosen, and the reference coil phase is subtracted from the other coils, then unwrapped.
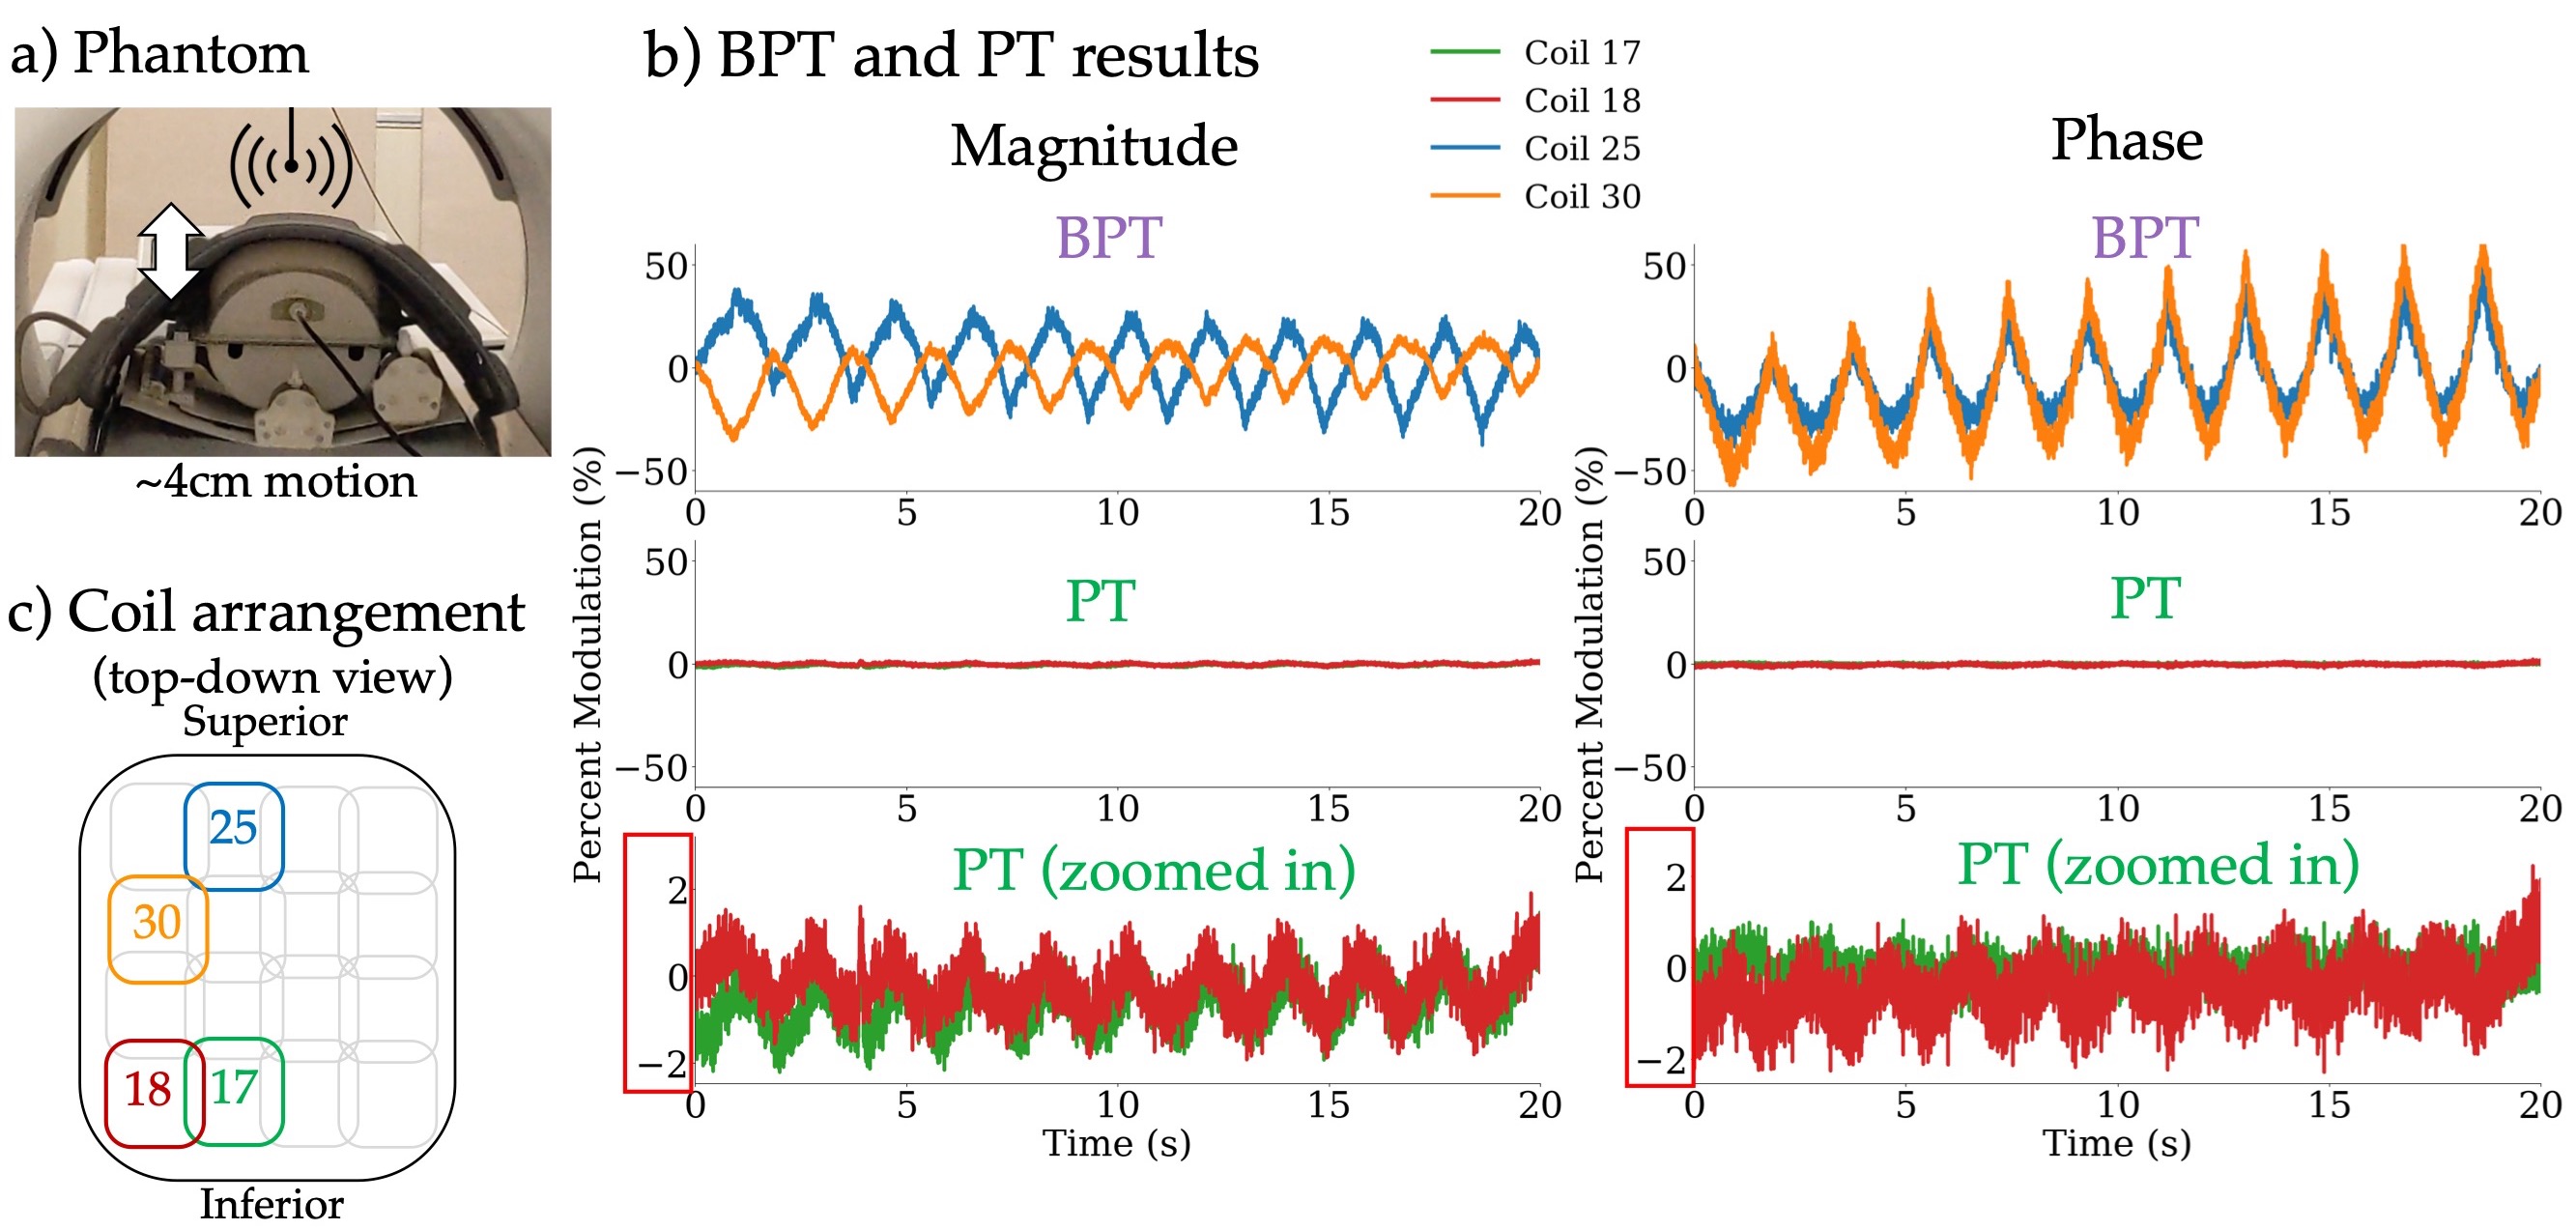
Figure 3: a) A pneumatic motion phantom was scanned with a 2D SSFP sequence with BPT and PT, scanned separately. The motion is in the range of 4cm. b) The percent modulation (defined as $$$\frac{amplitude}{mean}$$$) is compared between BPT and PT acquisitions for the two most modulated coils in each acquisition. The BPT shows 20x greater modulation in magnitude and in phase. The PT amplitude is first shown on the same scale as BPT, then zoomed in. The red box shows the scale of the PT. The coil arrangement is shown in c).
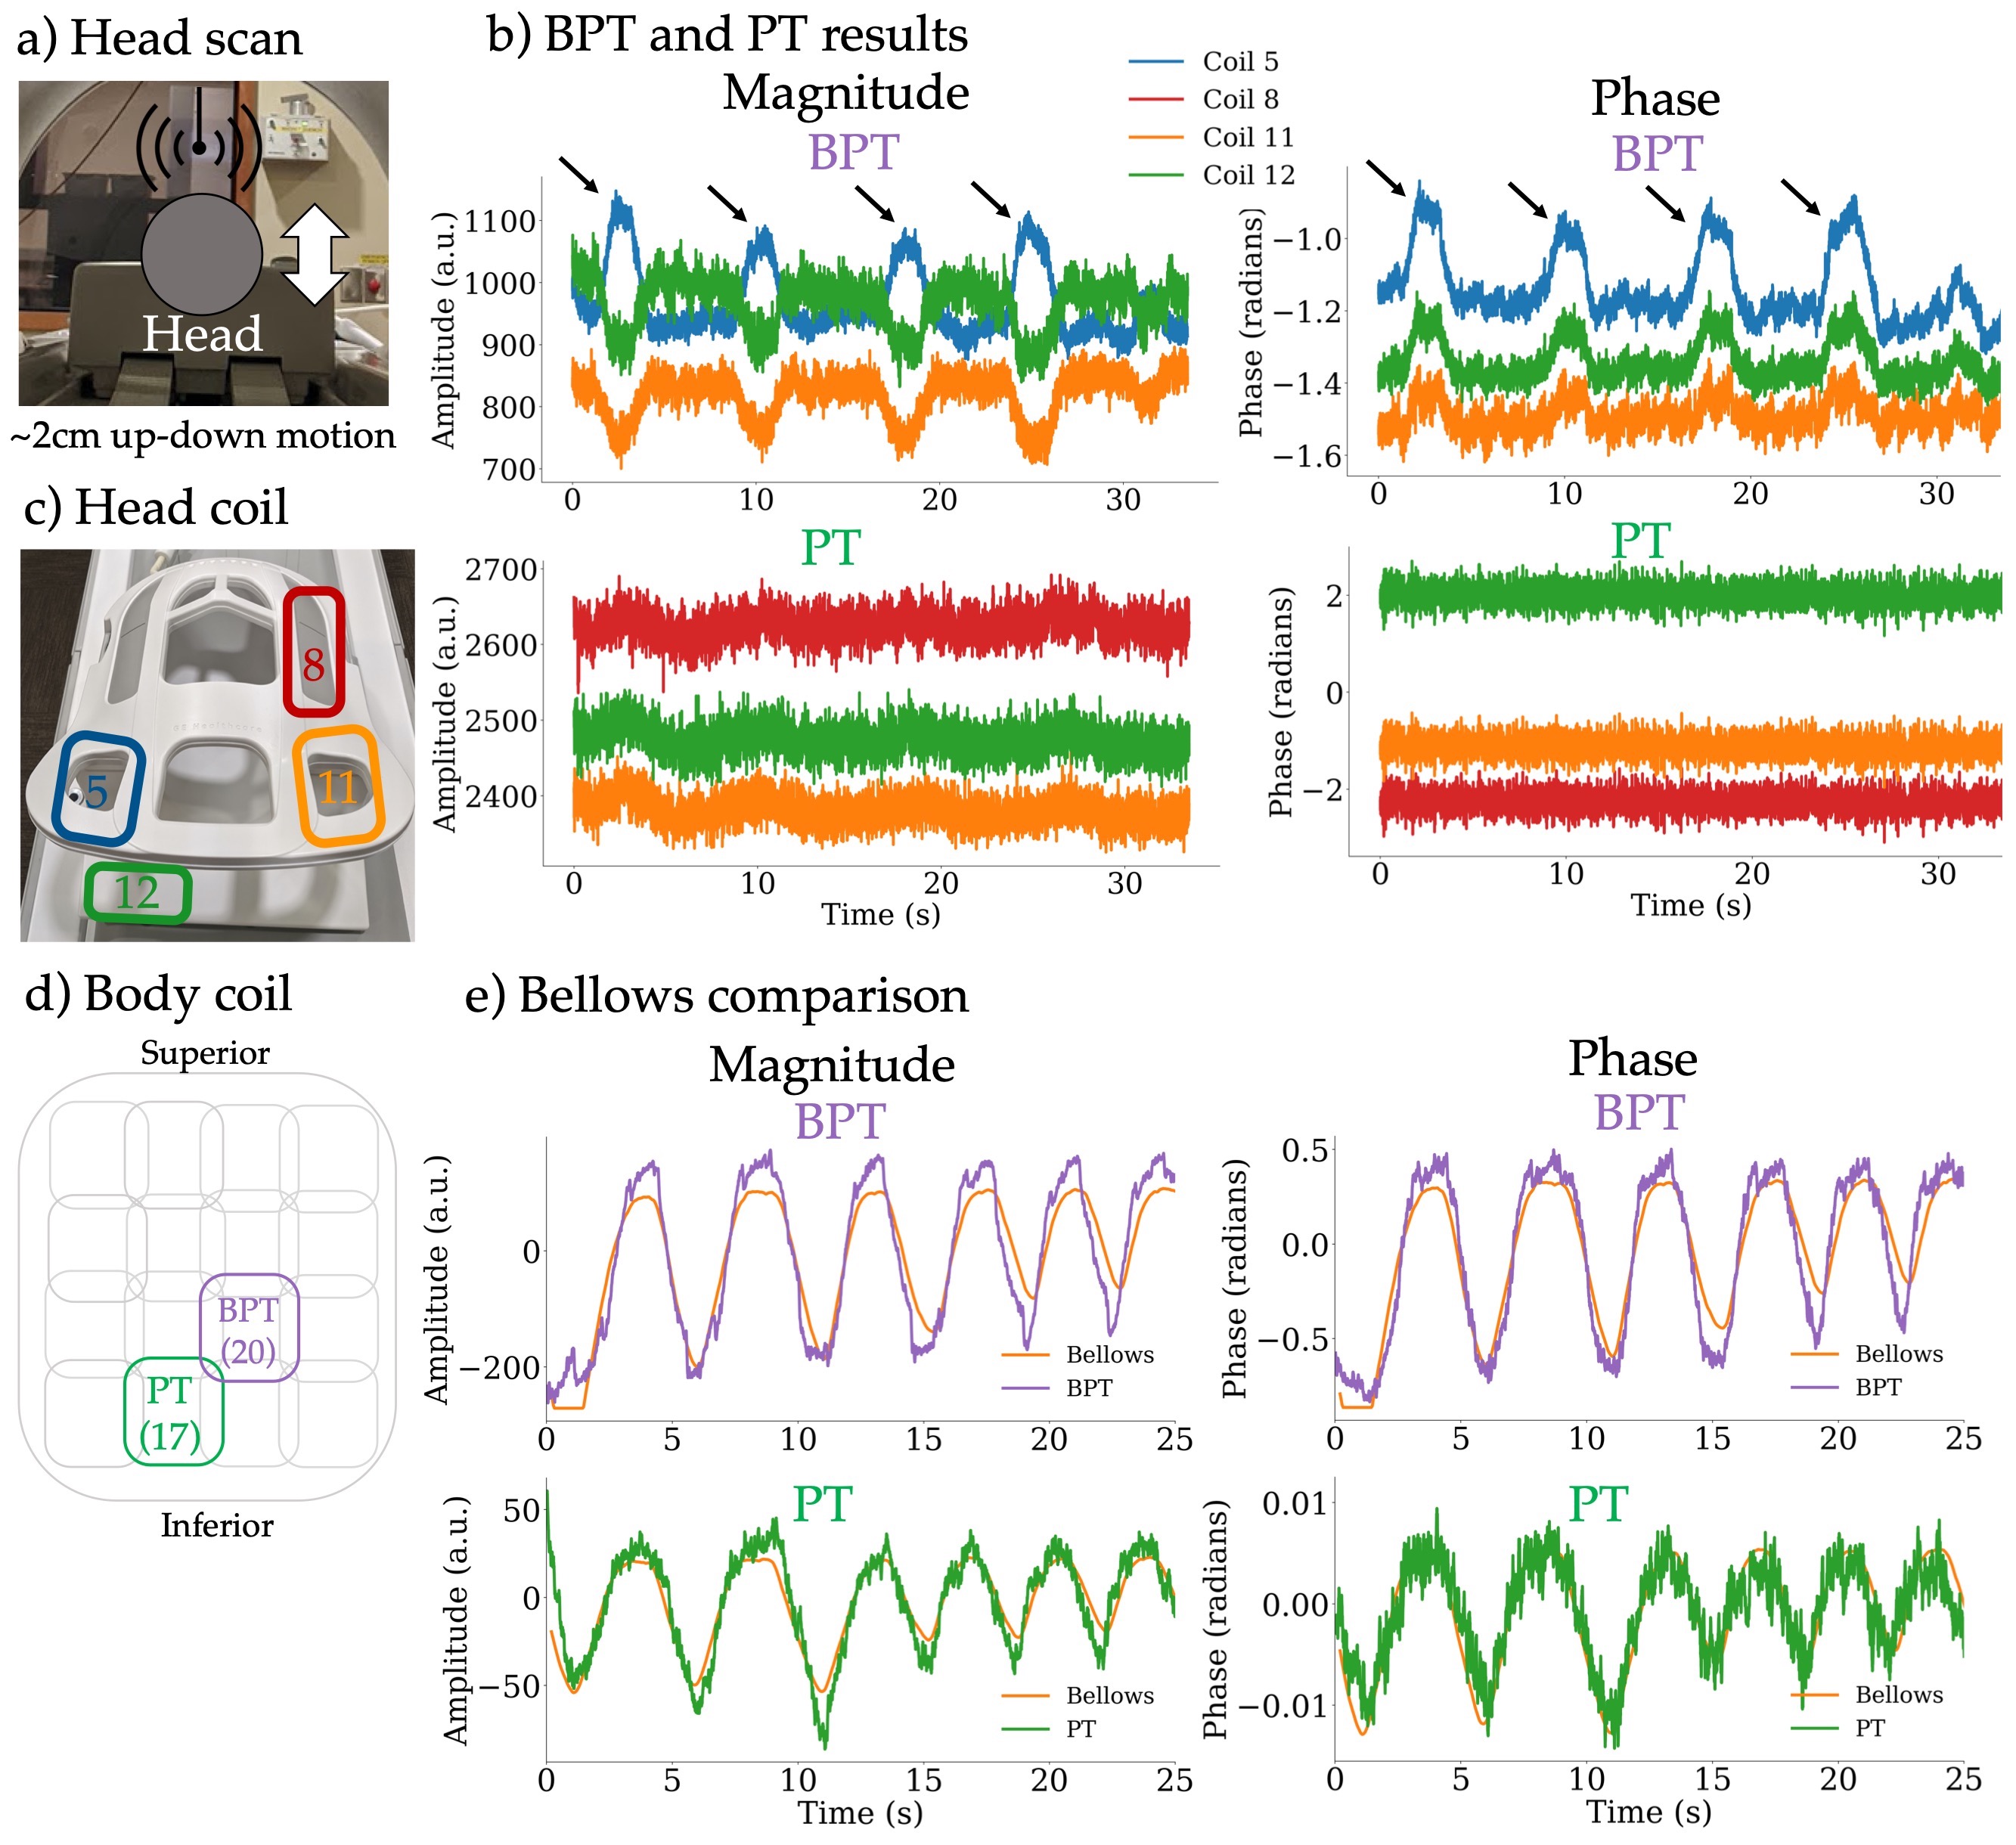
Figure 4: a) A volunteer was asked to move their head up and down during the scan, a motion in the range of 2cm. b) BPT from the 3 most modulated coils are compared to the PT, with the coil arrangement in c). The arrows show up-down motion, which is clearly visible in BPT, but barely so in PT. d) The two most modulated body coils (17 and 20) for the abdominal scan. e) The BPT and PT magnitudes and phases were filtered with a moving average and scaled to match the bellows signal, which they match closely.
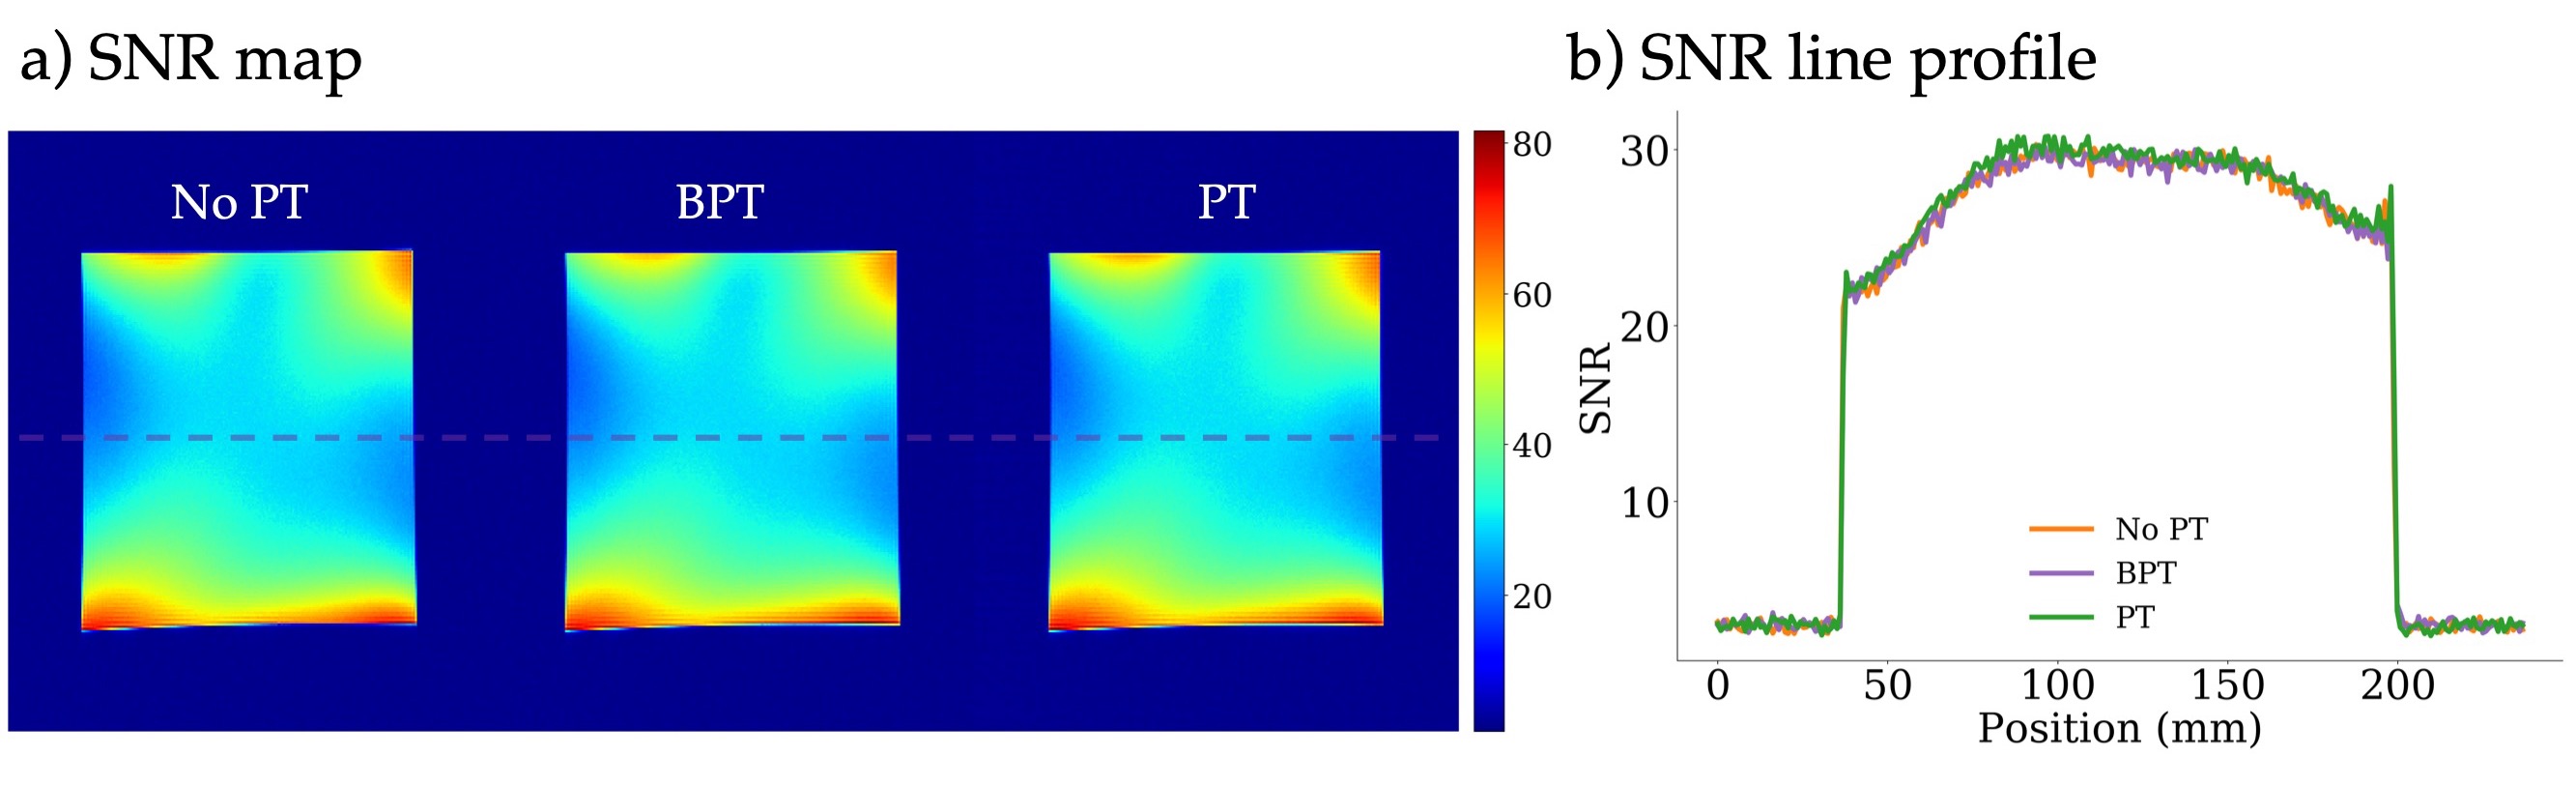
Figure 5: Image SNR was compared in three acquisitions with no PT, BPT, and PT using a uniform phantom with a 32-channel body coil. a) SNR maps across the three acquisitions. b) Line plots through the center of the maps, indicated by the dashed line. Both a) and b) are very similar among all three acquisitions.