0550
Simultaneous 3D T1 and B1+ mapping at 7T using MPRAGE with multiple volumes and driven equilibrium (DE)1Department of Medical Radiation Physics, Clinical Sciences Lund, Lund University, Lund, Sweden, 2Philips Healthcare, Copenhagen, Denmark
Synopsis
MP2RAGE has become popular for T1 mapping at 7T. Accuracy is yet improved by using a separately acquired flip angle map when creating the protocol-specific lookup table. Here, two additional volumes acquired at differing flip angles are added to an MP2RAGE sequence to obtain two separate states of driven equilibriums, effectively forming a dual flip angle protocol within the cycle. By estimating the accelerated effective relaxation, T1*, from the signals, both T1 and B1+ can be solved for analytically. Thus, a multi-volume MPRAGE sequence is turned into a dedicated high-resolution T1 and flip angle-mapping protocol.
Introduction
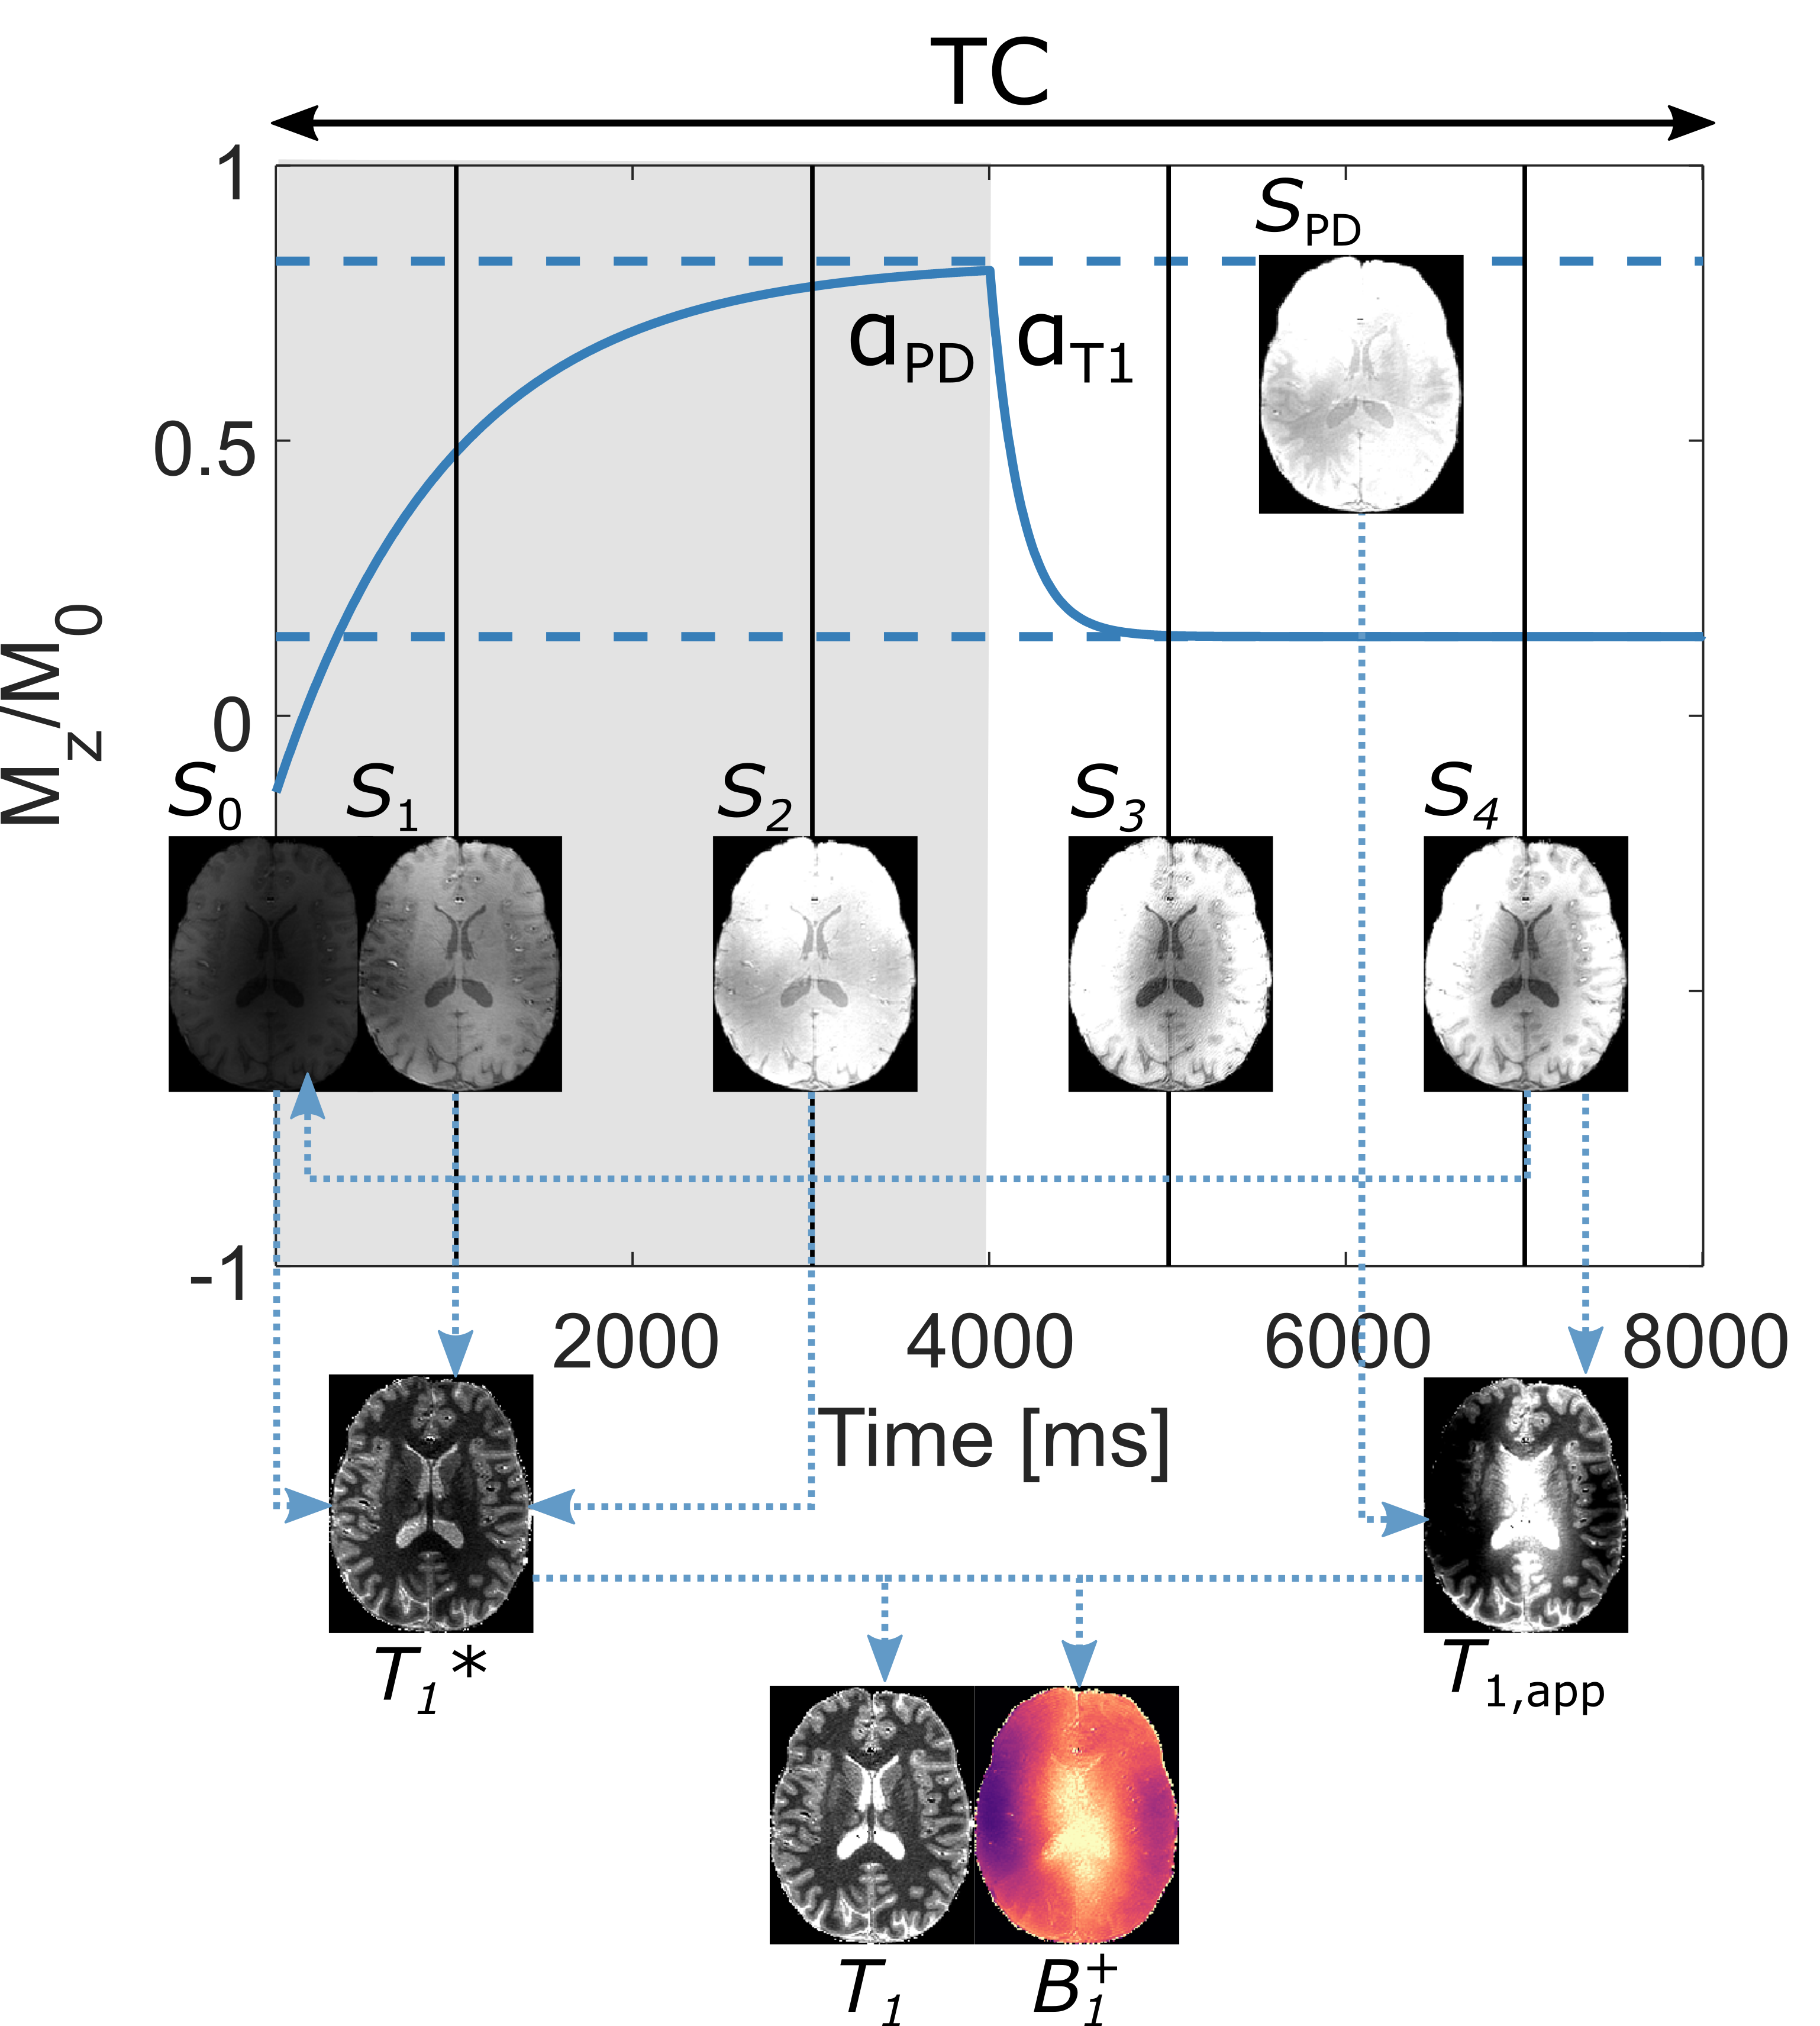
The well-known MP2RAGE sequence can be used to acquire maps of T1 by a protocol-specific lookup table (LUT) of the signal evolution1. Through a separately acquired flip angle map, the residual influence of transmit B1+ inhomogeneities can be alleviated. The concept has been expanded upon through acquisition of a third volume(dubbed “MP3RAGE”). Either, to correct for spatially varying inversion efficiency2 or to acquire a map of B1+ in addition to T13. The latter approach ideally requires that one pair of acquisitions is only sensitive to T1 while the other is only sensitive to B1+.Here we propose an alternative to the LUT approach using a driven equilibrium (DE) MPRAGE sequence with ≥3 volumes. First, two volumes ($$$S_1$$$, $$$S_2$$$) are acquired using small flip angles during relaxation with time constant T1* to a PD-weighted DE (Figure 1). Secondly, two additional T1-weighted volumes ($$$S_3$$$, $$$S_4$$$) are acquired directly at a lower DE by a higher flip angle. These two DEs form a dual flip angle T1-mapping scheme with a quadratic dependence on B1+4. This, in combination with fitting of the signal equation to obtain T1*, allows to analytically solve for both T1 and B1+, at the high resolution provided by MPRAGE.
Methods
The time constant, $$$T_1^*$$$, and the corresponding PD-weighted DE, $$$S_{PD}$$$, which the longitudinal magnetization relaxes towards was derived through fitting $$S_i=S_{PD}+(S_0-S_{PD})\exp(-TI_i/T_1^*)$$ where $$$S_0\approx-f_{inv}S_4\sin(\alpha_{PD})/\sin(\alpha_{T1})$$$ with $$$f_{inv}=0.96$$$ as in ref1. In addition, $$$S_{PD}$$$ was also obtained from a separate acquisition with the same $$$TR$$$ and flip angle to validate the concept. The apparent $$$T_{1,app}=T_1/f_T^2$$$, where $$$f_T$$$ is the B1+ bias, was calculated as4 $$T_{1,app}=2TR\frac{S_{PD}/\alpha_{PD}+S_4/\alpha_{T1}}{S_4\alpha{T1}-S_{PD}\alpha_{T1}}.$$ Using small flip angle approximations as above gives $$T_1^*=(T_1^{-1}+\frac{f_T^2\alpha_{PD}^2}{2TR})^{-1}$$ where $$$f_T^2$$$ can be replaced by $$$T_{1,app}$$$ and then $$$T_1$$$ solved for as: $$T_1=T_1^*(1+\frac{\alpha_{PD}^2T_{1,app}}{2TR}).$$ Finally, the B1+ map was obtained as: $$f_T=\sqrt{(T_{1,app}/T_1)}.$$A healthy adult subject (male, 29 years old) was scanned on a 7T Philips Achieva MR system (Philips Healthcare, Best, NL), using a dual channel transmit head coil with 32 receive elements (Nova Medical, Wilmington, MA) after giving informed written consent. Four interleaved volumes of 1 mm isotropic resolution were acquired without delays at TI=1012/3009/5006/7003 ms and α=3°,3°,16°,16° (αPD,αT1=3°,16°), TR/TE=7.8/3.4 ms and TF=256, resulting in a cycle duration of TC=8004 ms. The duration of all readout pulses were 700 μs to balance incidental magnetization transfer effects5. Application of SENSE=2, PF=0.775 and an elliptical k-space readout resulted in a total acquisition time of 7:12 min.
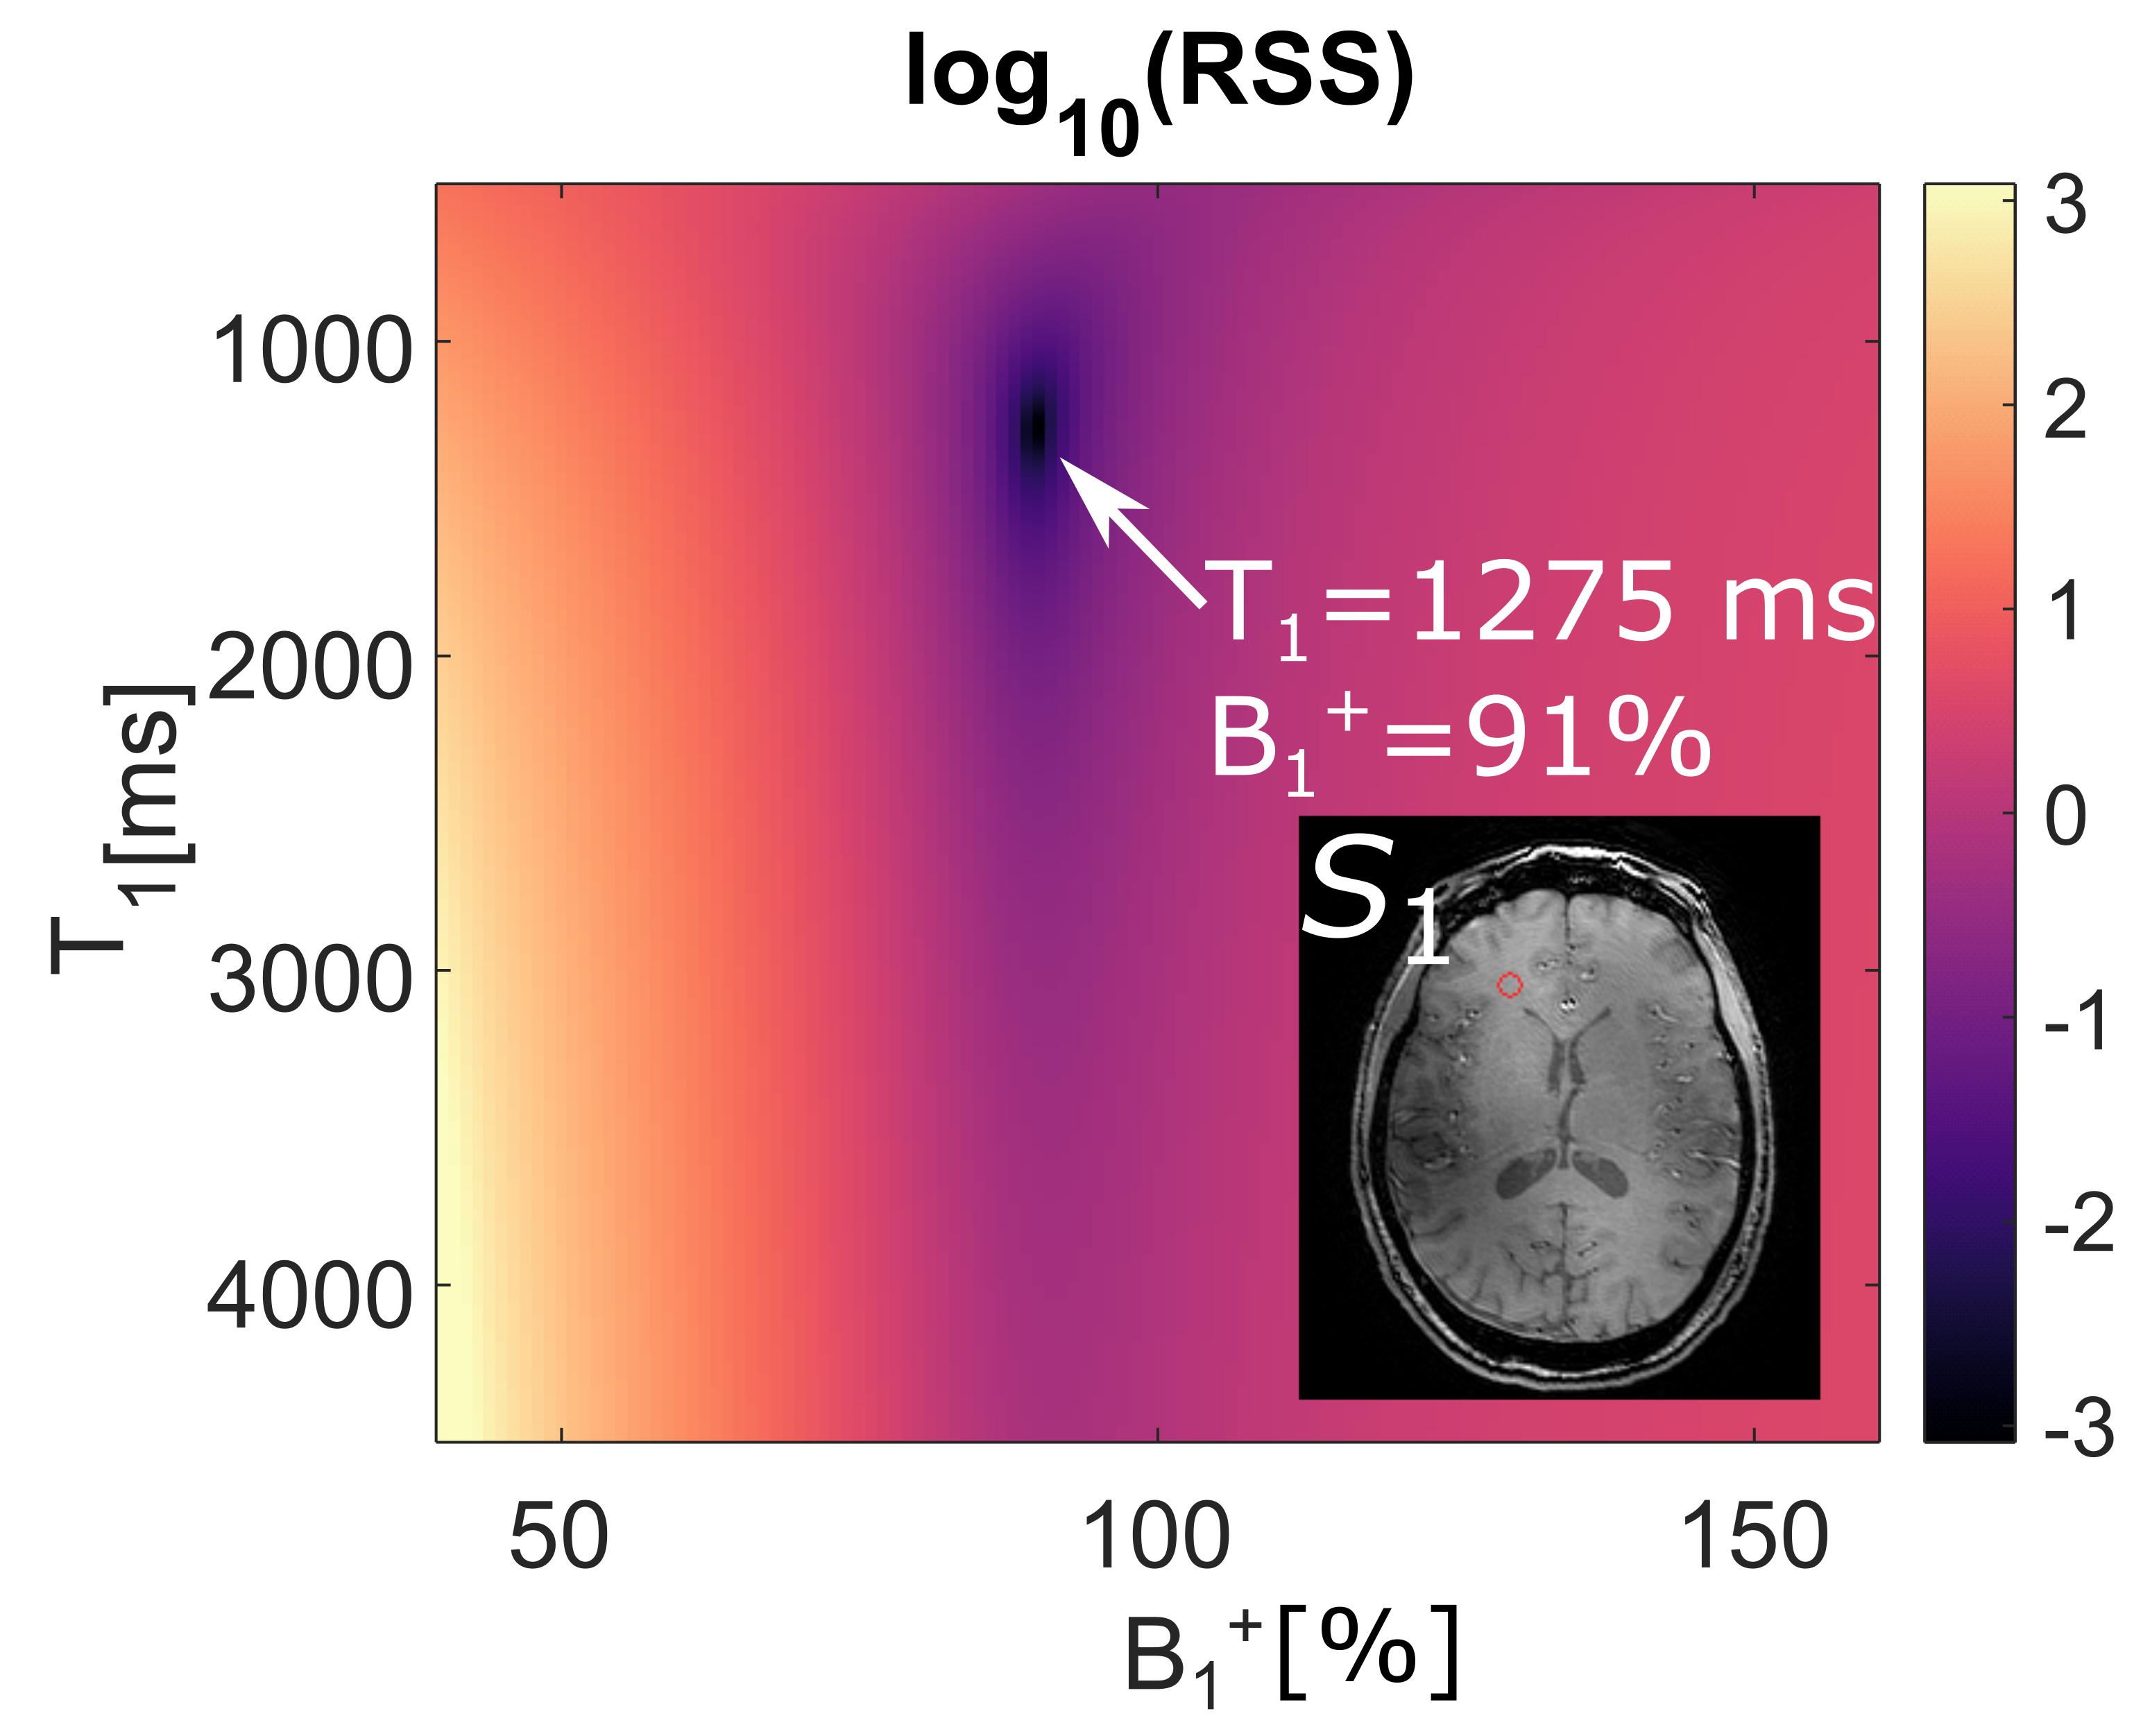
As a reference for B1+, four DREAM6 maps with preparation flip angles of 25°,40°,60°,90° at 3.75x3.75x3.50 mm3 were acquired and combined for better accuracy7. A LUT-based approach was also performed where the signal evolution for all combinations of 500≤T1≤4500 ms and 0.4≤fT≤1.6 was simulated and compared to the measured signal in $$$S_{1,2,3,4}$$$ normalized to $$$S_1$$$.
Results
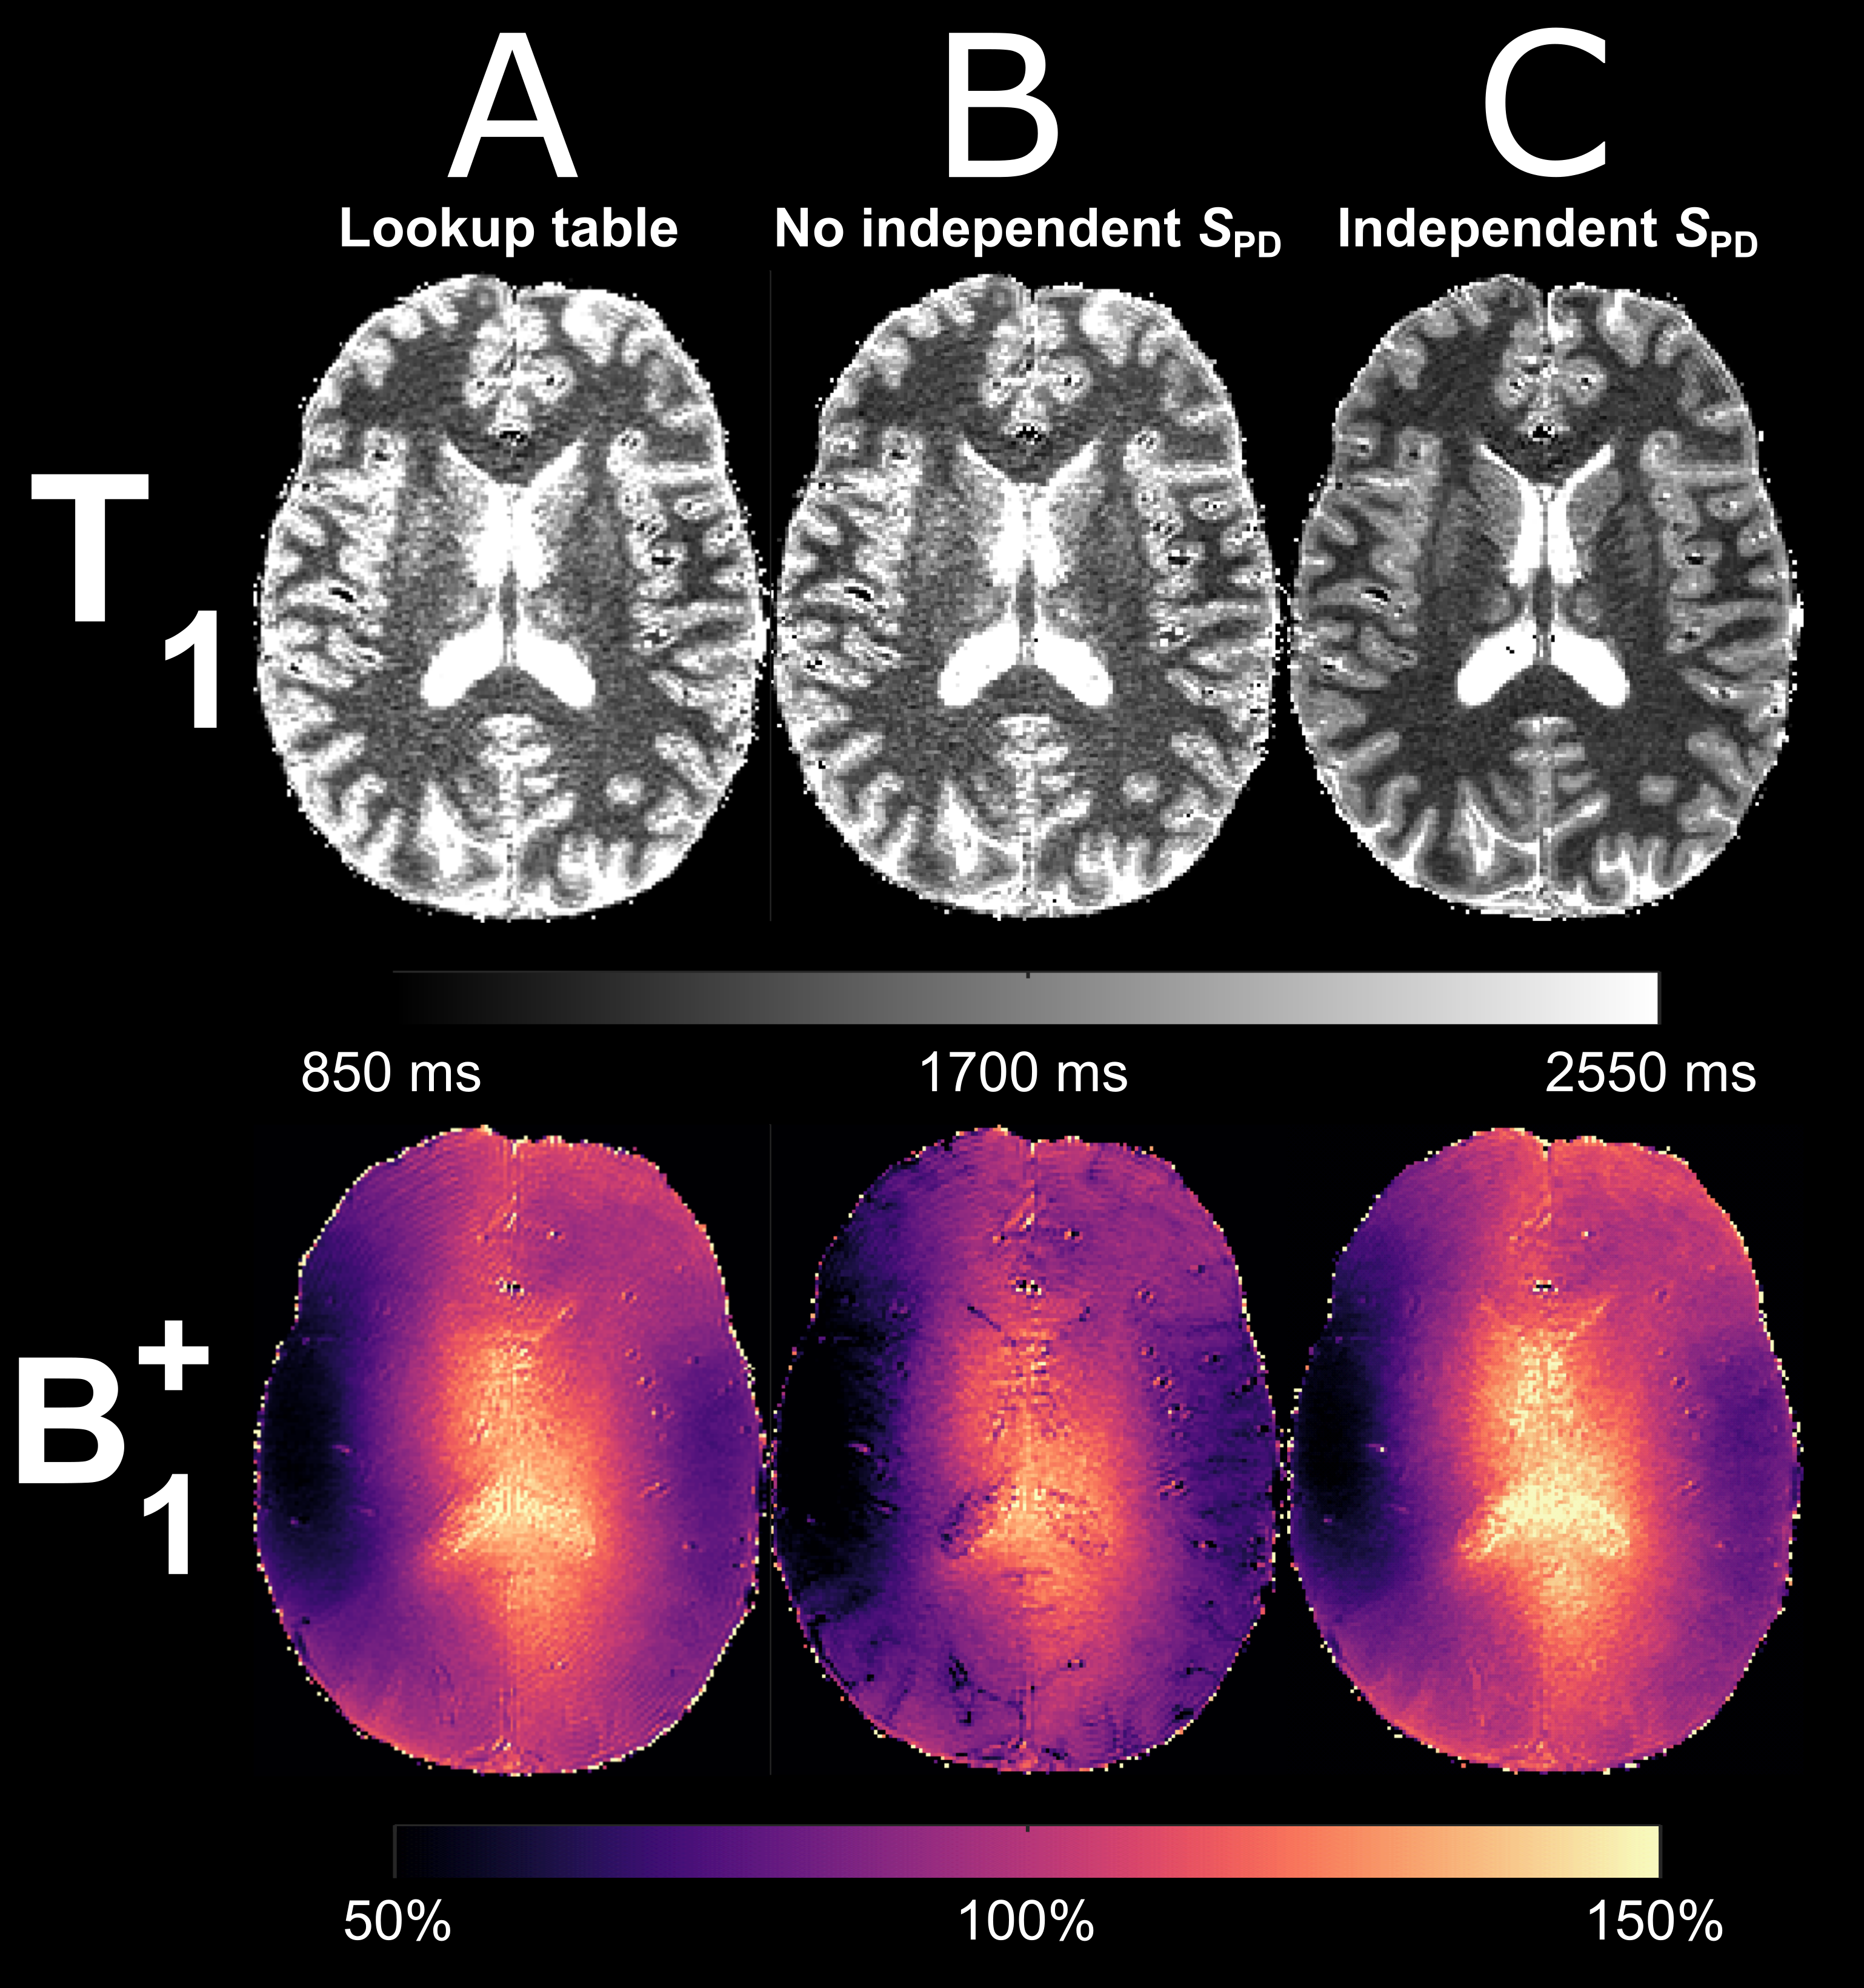
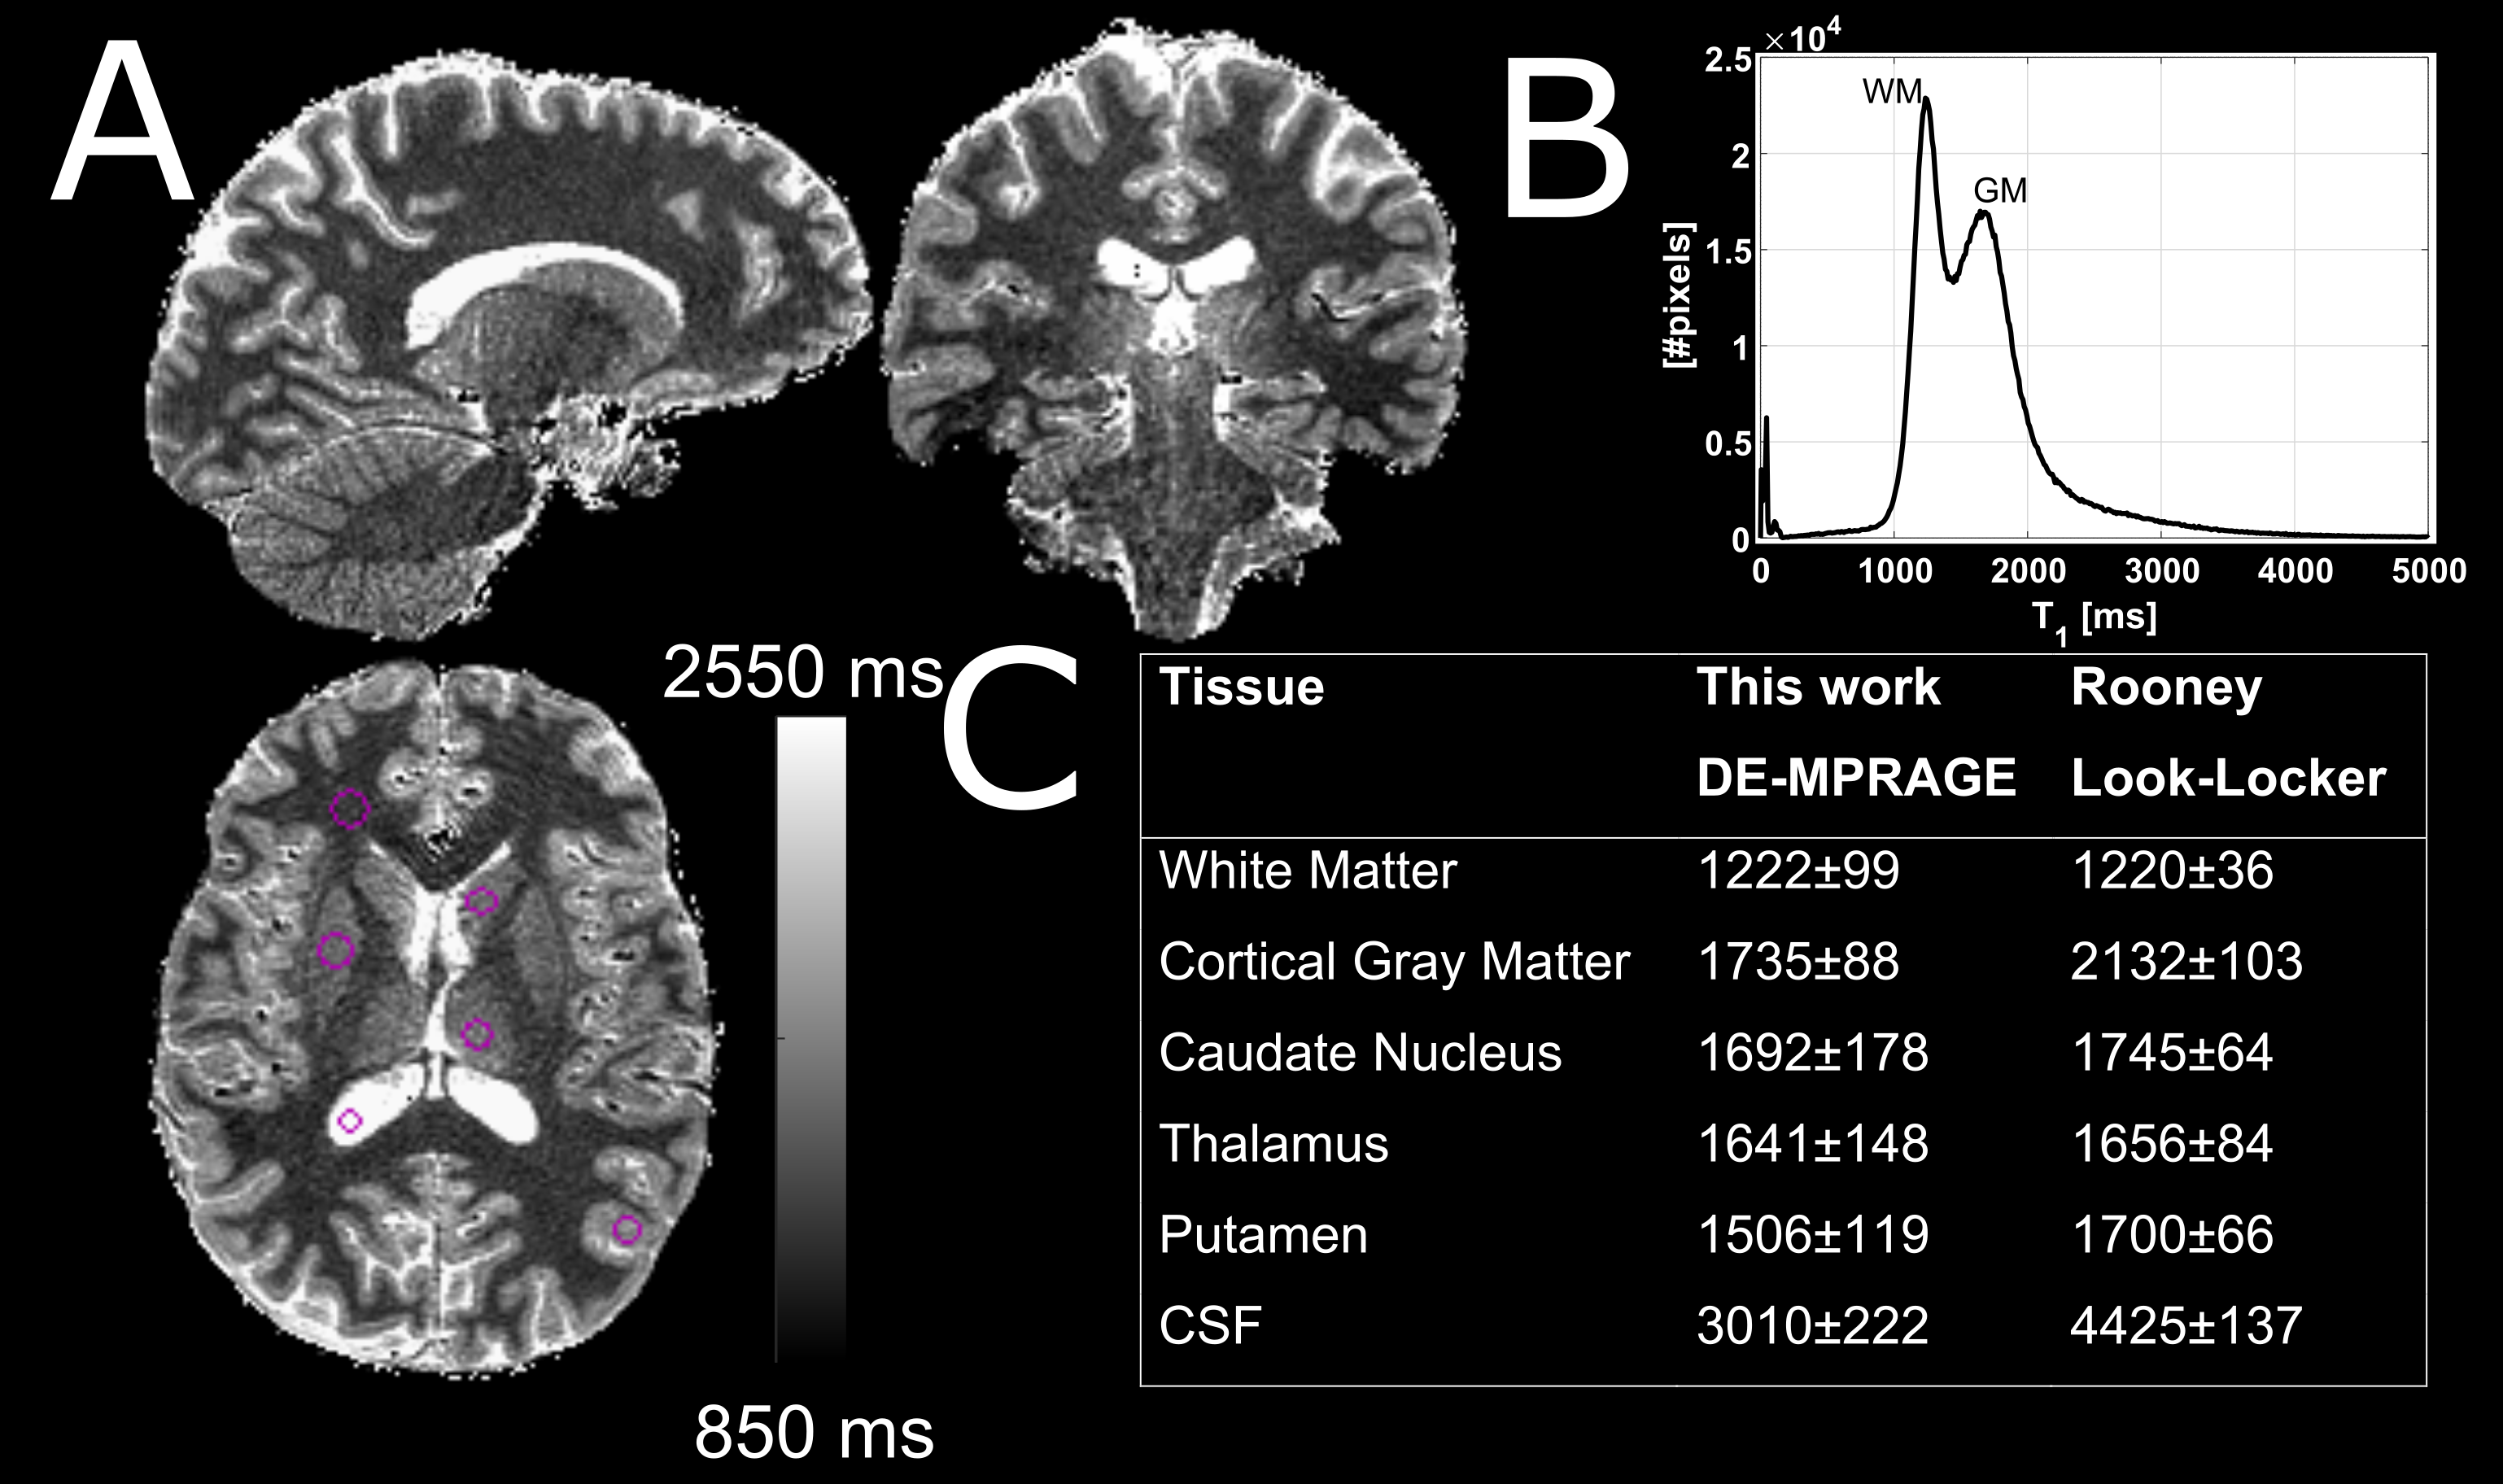
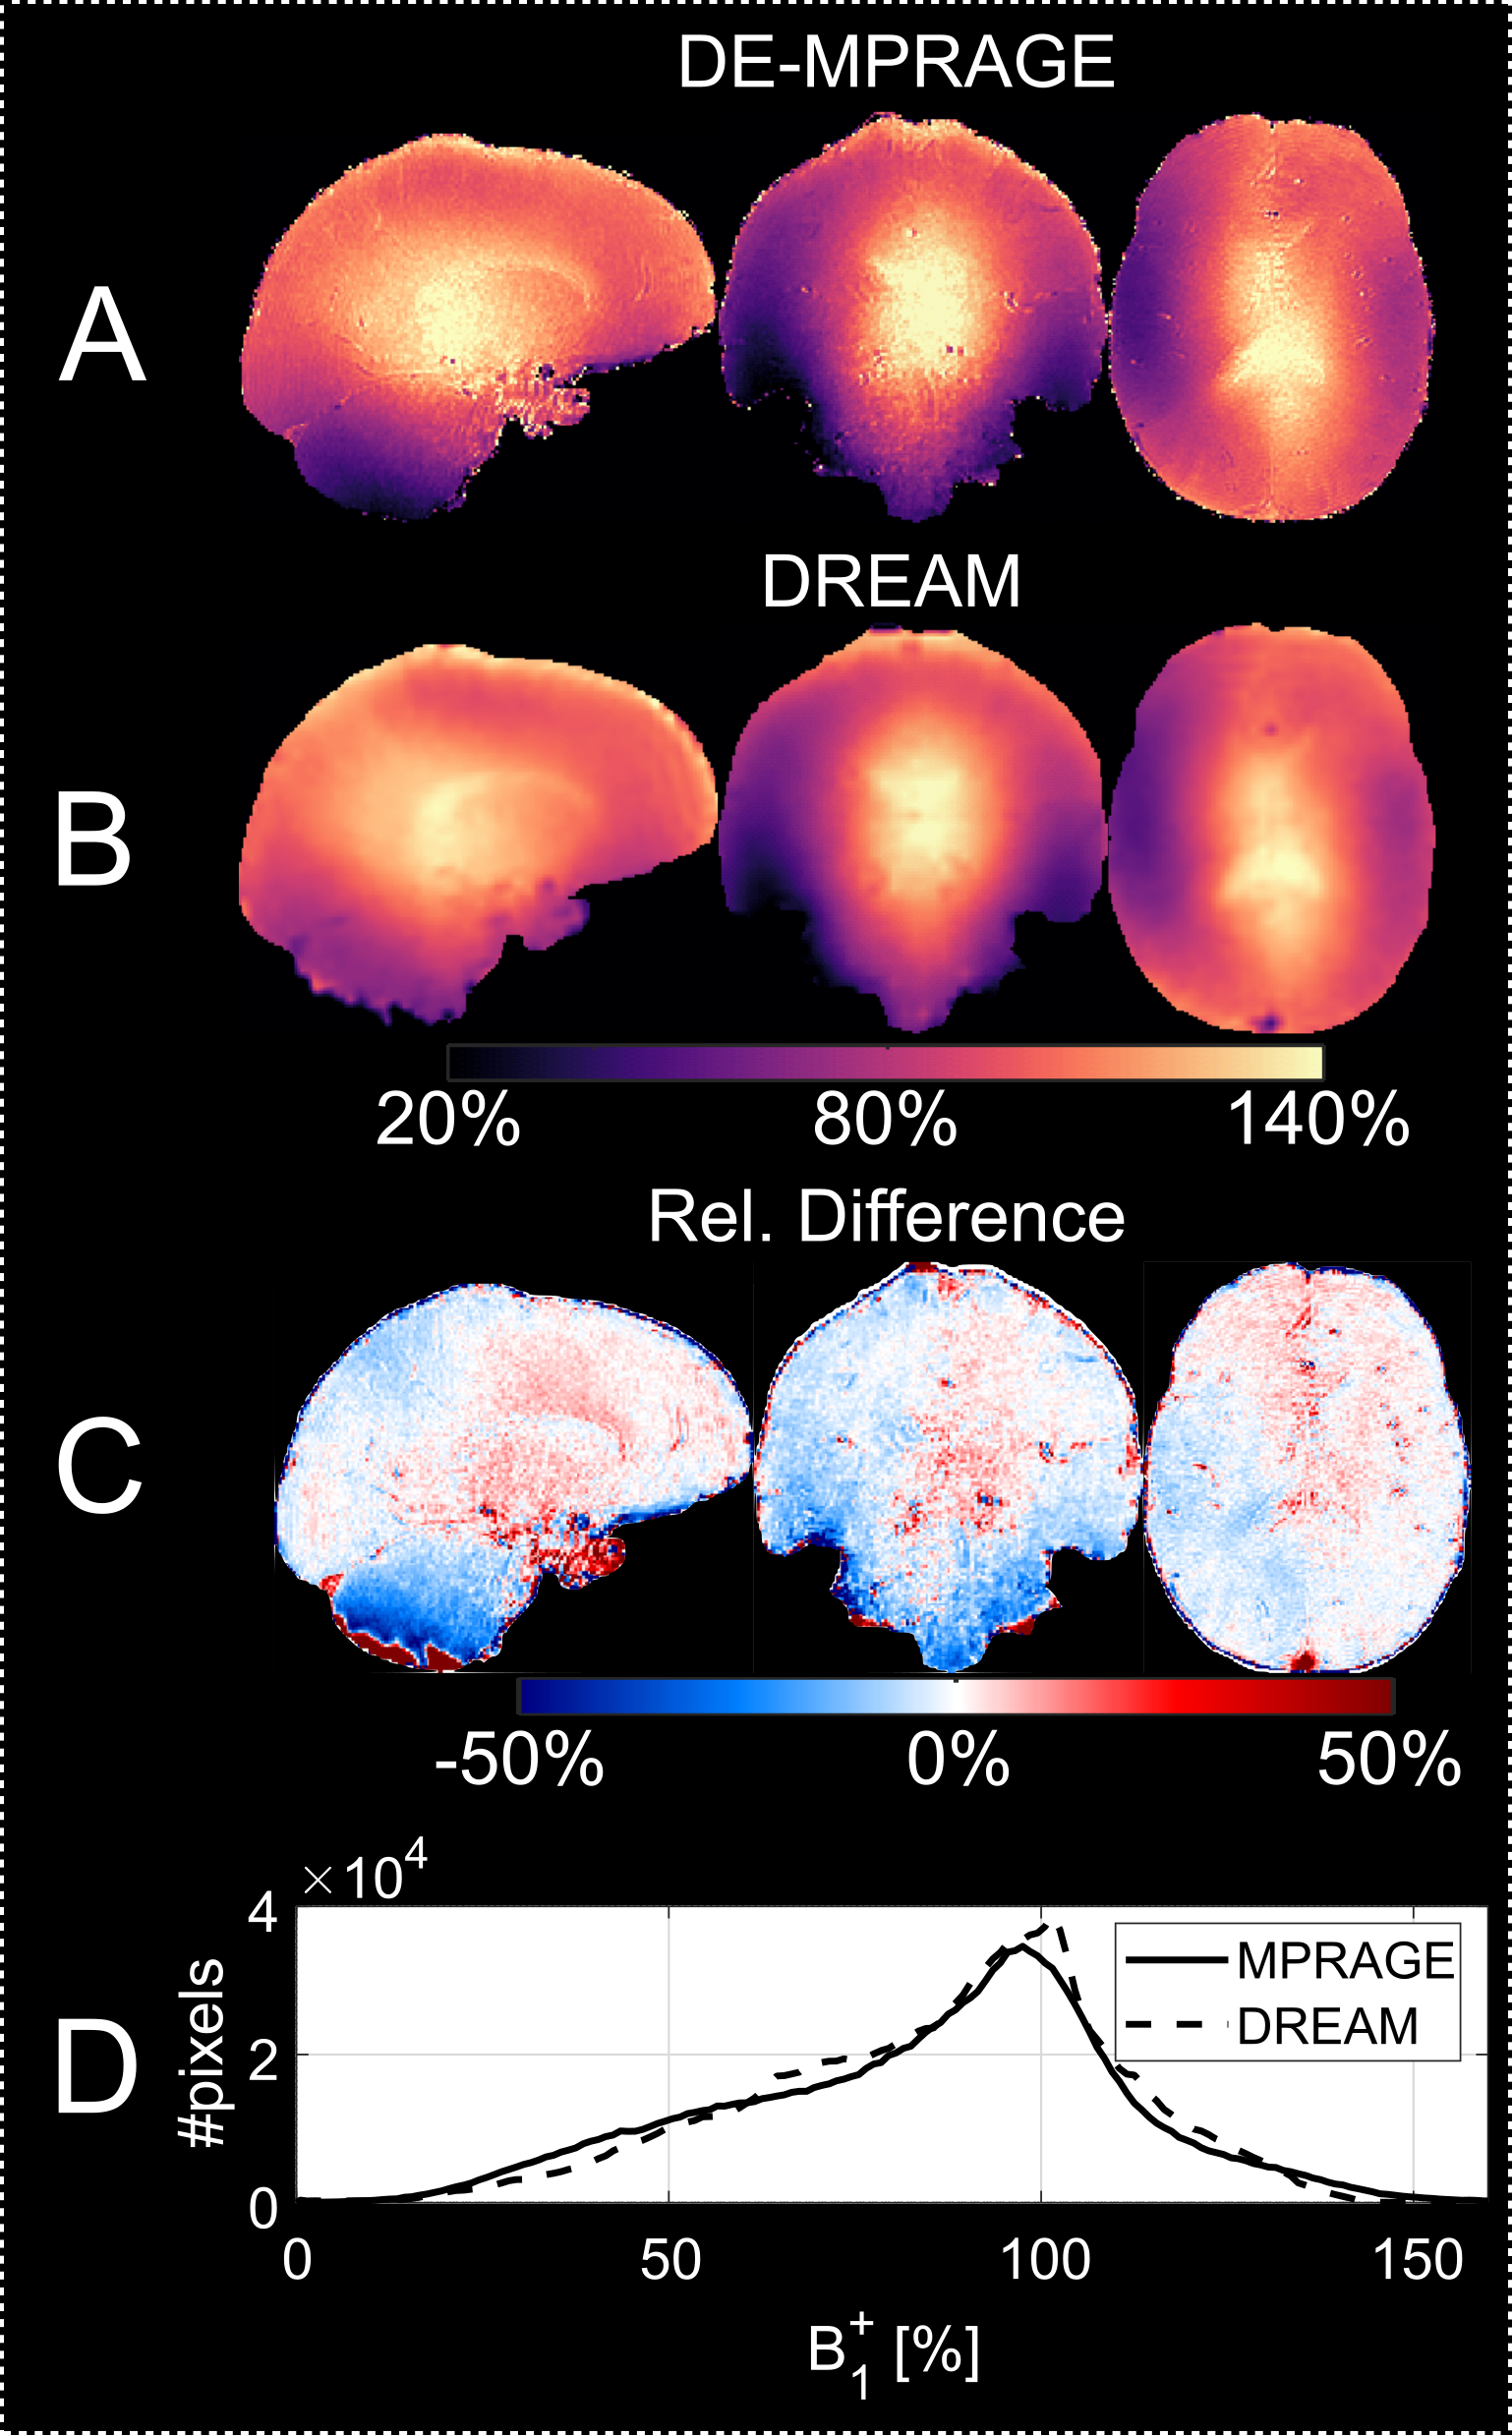
Without an external reference for $$$S_{PD}$$$, there was a positive bias in the derived T1 map which translated into a T1-related bias in the B1+ map (Figure 2). With the LUT-based approach, a global minimum for a specific T1 and B1+ was obtained but mirrored this overestimation of T1 (Figure 3). With an independent PD-weighted reference, a spatially homogenous T1 map that agreed with literature estimates8 was obtained although high T1 pixels such as in the CSF and to a lesser extent cortical gray matter appeared somewhat underestimated (Figure 4). The corresponding B1+ map showed excellent agreement with the lower resolution DREAM reference method (Figure 5) although in low B1+ regions such as the cerebellum, a somewhat lower B1+ was obtained.Discussion
The DE-MPRAGE-derived T1 map looks promising and the B1+ map showed excellent agreement with the reference DREAM method, effectively validating the proposed method. However, protocol optimization is needed to make the approach independent of a separate $$$S_{PD}$$$ measurement. The simulation in Figure 3 shows that the problem is well-defined. By reading out the center of k-space at the end of each acquisition train (reverse central encoding), the approach could be substantially improved. This would improve the definition of both DE states, and thus elimate the need for a 4th volume (only needed to obtain the DE in low B1+ areas), thus reducing acquisition time by 25%.Conclusion
We show that it is possible to obtain high resolution 3D maps of T1 and B1+ at 7T using a DE-MPRAGE sequence with multiple volumes. Thus, effectively expanding MP2RAGE to a dedicated T1 and B1+-mapping sequence while foregoing the use of a lookup table.Acknowledgements
Grant support by the Swedish Research Council (NT 2014-6193). Lund University Bioimaging Center (LBIC) is acknowledged for experimental resources (equipment grant VR RFI 829-2010-5928).References
1. Marques JP, Kober T, Krueger G, van der Zwaag W, Van de Moortele PF, Gruetter R. MP2RAGE, a self bias-field corrected sequence for improved segmentation and T1-mapping at high field. Neuroimage 2010;49(2):1271-1281.
2. Hung W, Chen P, Chuang T, Chang H, Wu M. High resolution volumetric T1 mapping using a novel MP3RAGE method. In Proceedings of the 21st Annual Meeting of ISMRM, Salt Lake City, Utah, USA, 2013. p. 2353.
3. Rioux JA, Saranathan M, Rutt BK. Simultaneous Whole-Brain T1 and Flip Angle Mapping with MP3RAGE. In Proceedings of the 22nd Annual Meeting of ISMRM, Milan, Italy, 2014. p. 3216.
4. Helms G, Dathe H, Dechent P. Quantitative FLASH MRI at 3T using a rational approximation of the Ernst equation. Magn Reson Med 2008;59(3):667-672.
5. Olsson H, Andersen M, Latt J, Wirestam R, Helms G. Reducing bias in dual flip angle T1 -mapping in human brain at 7T. Magn Reson Med 2020;84(3):1347-1358.
6. Nehrke K, Bornert P. DREAM-a novel approach for robust, ultrafast, multislice B1 mapping. Magn Reson Med 2012;68(5):1517-1526.
7. Olsson H, Andersen M, Helms G. Reducing bias in DREAM flip angle mapping in human brain at 7T by multiple preparation flip angles. Magn Reson Imaging 2020;72:71-77.
8. Rooney WD, Johnson G, Li X, Cohen ER, Kim SG, Ugurbil K, Springer CS, Jr. Magnetic field and tissue dependencies of human brain longitudinal 1H2O relaxation in vivo. Magn Reson Med 2007;57(2):308-318.
Figures