0452
Validation of a Deep Learning based Automated Myocardial Inversion Time Selection for Late Gadolinium Enhancement Imaging in a Prospective Study
Seung Su Yoon1,2, Michaela Schmidt2, Manuela Rick2, Teodora Chitiboi3, Puneet Sharma3, Tilman Emrich4,5, Christoph Tilmanns6, Ralph Waßmuth6, Jens Wetzl2, and Andreas Maier1
1Pattern Recognition Lab, Friedrich-Alexander-Universität Erlangen-Nürnberg, Erlangen, Germany, 2Magnetic Resonance, Siemens Healthcare GmbH, Erlangen, Germany, 3Siemens Medical Solutions USA, Inc., Princeton, NJ, United States, 4Department of Radiology, University Medical Center, Johannes Gutenberg-University Mainz, Mainz, Germany, 5Division of Cardiovascular Imaging, Department of Radiology and Radiological Science, Medical University of South Carolina, Charleston, SC, United States, 6Diagnostikum Berlin, Berlin, Germany
1Pattern Recognition Lab, Friedrich-Alexander-Universität Erlangen-Nürnberg, Erlangen, Germany, 2Magnetic Resonance, Siemens Healthcare GmbH, Erlangen, Germany, 3Siemens Medical Solutions USA, Inc., Princeton, NJ, United States, 4Department of Radiology, University Medical Center, Johannes Gutenberg-University Mainz, Mainz, Germany, 5Division of Cardiovascular Imaging, Department of Radiology and Radiological Science, Medical University of South Carolina, Charleston, SC, United States, 6Diagnostikum Berlin, Berlin, Germany
Synopsis
In cardiac MRI using the Late Gadolinium Enhancement technique, inversion recovery sequences are acquired for the correct myocardial nulling for optimal image contrast. In clinical practice, the selection of the proper inversion time to null healthy myocardium is manually performed by visual inspection. To standardize the process, we propose an automated deep-learning-based system which selects the “null inversion time” where the myocardium signal is darkest, and “contrast inversion time” where the contrast between the myocardium and blood pool is highest. We validated the system on a prospective study on different scanners. The system achieved high accuracy in observers’ annotation range.
Introduction
In cardiac MRI, late gadolinium enhancement (LGE), a contrast enhanced inversion recovery sequence is generally performed for the assessment of myocardial viability. For the image contrast optimization in LGE imaging, inversion recovery techniques are used to null healthy myocardium. In current clinical practice, the selection of the inversion time (TI) for correct myocardial nulling is done by visual inspection or a manual post-processing step. We propose an automated deep-learning-based system1 to select the TI where the myocardium intensities are the darkest (TInull) and the TI where the contrast is highest between the myocardium and blood pool signal (TIcontrast) to increase the efficiency and improve the reproducibility. In this work, we evaluate the system in a prospective study.Methods
The proposed prototype system automatically selects the TInull and TIcontrast based on the myocardium and blood pool signals. It consists of three deep neural networks and takes a TI scout sequence of a mid-ventricular short-axis (SAX) slice as input. The last frame is forwarded to a localization network based on Unet2 with ResNet3 blocks, which outputs two right ventricle (RV) insertion points and left ventricle (LV) midpoint. These landmarks are used for standardizing the SAX orientations. The orientation of the series is transformed by aligning the RV insertion points to be parallel to the vertical image axis, the LV point to be the center of the image and cropping a fixed size of 128x128 pixels with 1mm resolution. Secondly, the different contrasts of the standardized series over time points are transformed to a uniform, CINE-like contrast by the style transfer network built based on Unet2 with DenseNet4 blocks. The processed series is then transferred back to the original orientation. Third, the segmentation network5 trained on CINE images segments the LV endo-/epicardial and RV epicardial contours. The mean pixel intensities of the myocardium, LV and RV blood pool at each time point can then be calculated. The time point of the minimum myocardium signal is selected as TInull. By taking the TInull as starting point and examining the next TI window of 80ms, which is defined based on the analysis of TInull (Fig.3), the time point where the relative difference between the average LV, RV blood pool and myocardium signal is highest, is selected as TIcontrast.Experiments
The proposed system was evaluated on TI scout acquisitions in SAX orientations from 130 patients, acquired on $$$1.5\ T$$$ and $$$3\ T$$$ clinical scanners (MAGNETOM Avanto fit, Aera, Skyra and Prisma, Siemens Healthcare, Erlangen, Germany) at multiple centers. Detailed information about the data population and acquisition is shown in Fig. 2a. To validate the system, mean and standard deviation of the absolute difference between TIcontrast and TInull with two observers (both with $$$>20$$$ years of cardiac MR experience), and interobserver statistic were analyzed based on Bland-Altmann analysis. To test its robustness, the system was validated with a segmented inversion recovery CINE TrueFISP pulse sequence with and without compressed sensing. The results were qualitatively validated (Fig.4). Furthermore, the system was integrated into the scanner software (MAGNETOM Vida; Siemens Healthcare, Erlangen, Germany) and tested online in a prospective study (Fig.2b) ($$$n=6$$$). The results were qualitatively validated (Fig.5).Results
The mean difference of $$$1.5\ T$$$ data ($$$n=64$$$) with both observers was $$$-21.2\pm14.6\ ms$$$, $$$4.8\pm14.5\ ms$$$ for TInull, TIcontrast respectively (Fig.3). The mean difference of $$$3\ T$$$ data ($$$n=66$$$) with both observers was $$$-31.4\pm16.2\ ms$$$, $$$-1.9\pm15.2\ ms$$$ for TInull, TIcontrast, respectively. TInull shows reasonable deviation between the system output and both observers and was selected in all cases not later than observers' annotation. The search window for TIcontrast of $$$[$$$TInull, TInull$$$+80\ ms]$$$ was therefore chosen based on the deviation between the TInull and both observers’ annotations. TIcontrast was matched or off by one frame and shows high accuracy in the range of observers’ annotations. In addition, the interobserver variability indicates that the mean differences between two observers were $$$2.6\pm13.0\ ms$$$ for $$$1.5\ T$$$ and $$$-9.1\pm16.0\ ms$$$ for $$$3\ T$$$, and that the task is user dependent. In some cases, the TIcontrast was selected the TI with better contrast than the one chosen by observer as shown in Fig. 5a) and 5b).Conclusion
The results demonstrate the feasibility of the proposed system to automatically select the correct TI. The proposed system was integrated into a scanner software and successfully tested online. It shows great potential for improving automation and standardization of LGE imaging. Future work will focus on clinical evaluation and validation.Acknowledgements
No acknowledgement found.References
- Yoon S, et al. A Deep-Learning-based Automated Myocardial Inversion Time Selection for Late Gadolinium Enhancement Imaging. SCMR 2021.
- Ronneberger O, et al. U-net: convolutional networks for biomedical image segmentation. MICCAI 2015.
- He K, et al. Deep residual learning for image recognition. CVPR 2016.
- Huang G, et al. Densely connected convolutional networks. CVPR 2017.
- Chitiboi T, et al. Automated ventricular volume and strain quantification with deep learning. SCMR 2020.
Figures

Figure 1: Overview of the proposed
system based on an example. A SAX TI scout series is used as an input for the
system. By applying the localization, style transfer and segmentation network,
the time point where the mean pixel intensities from myocardium signal is
minimum is selected as TInull. By examining the 80ms window starting
from the TInull, the time point where the difference between the
average LV, RV blood pool and myocardium signal is highest, is selected as TIcontrast.

Figure 2: a) Details about the data population and the data
acquisition used for validation. b) Details about the data population and
acquisition of the prospective study.
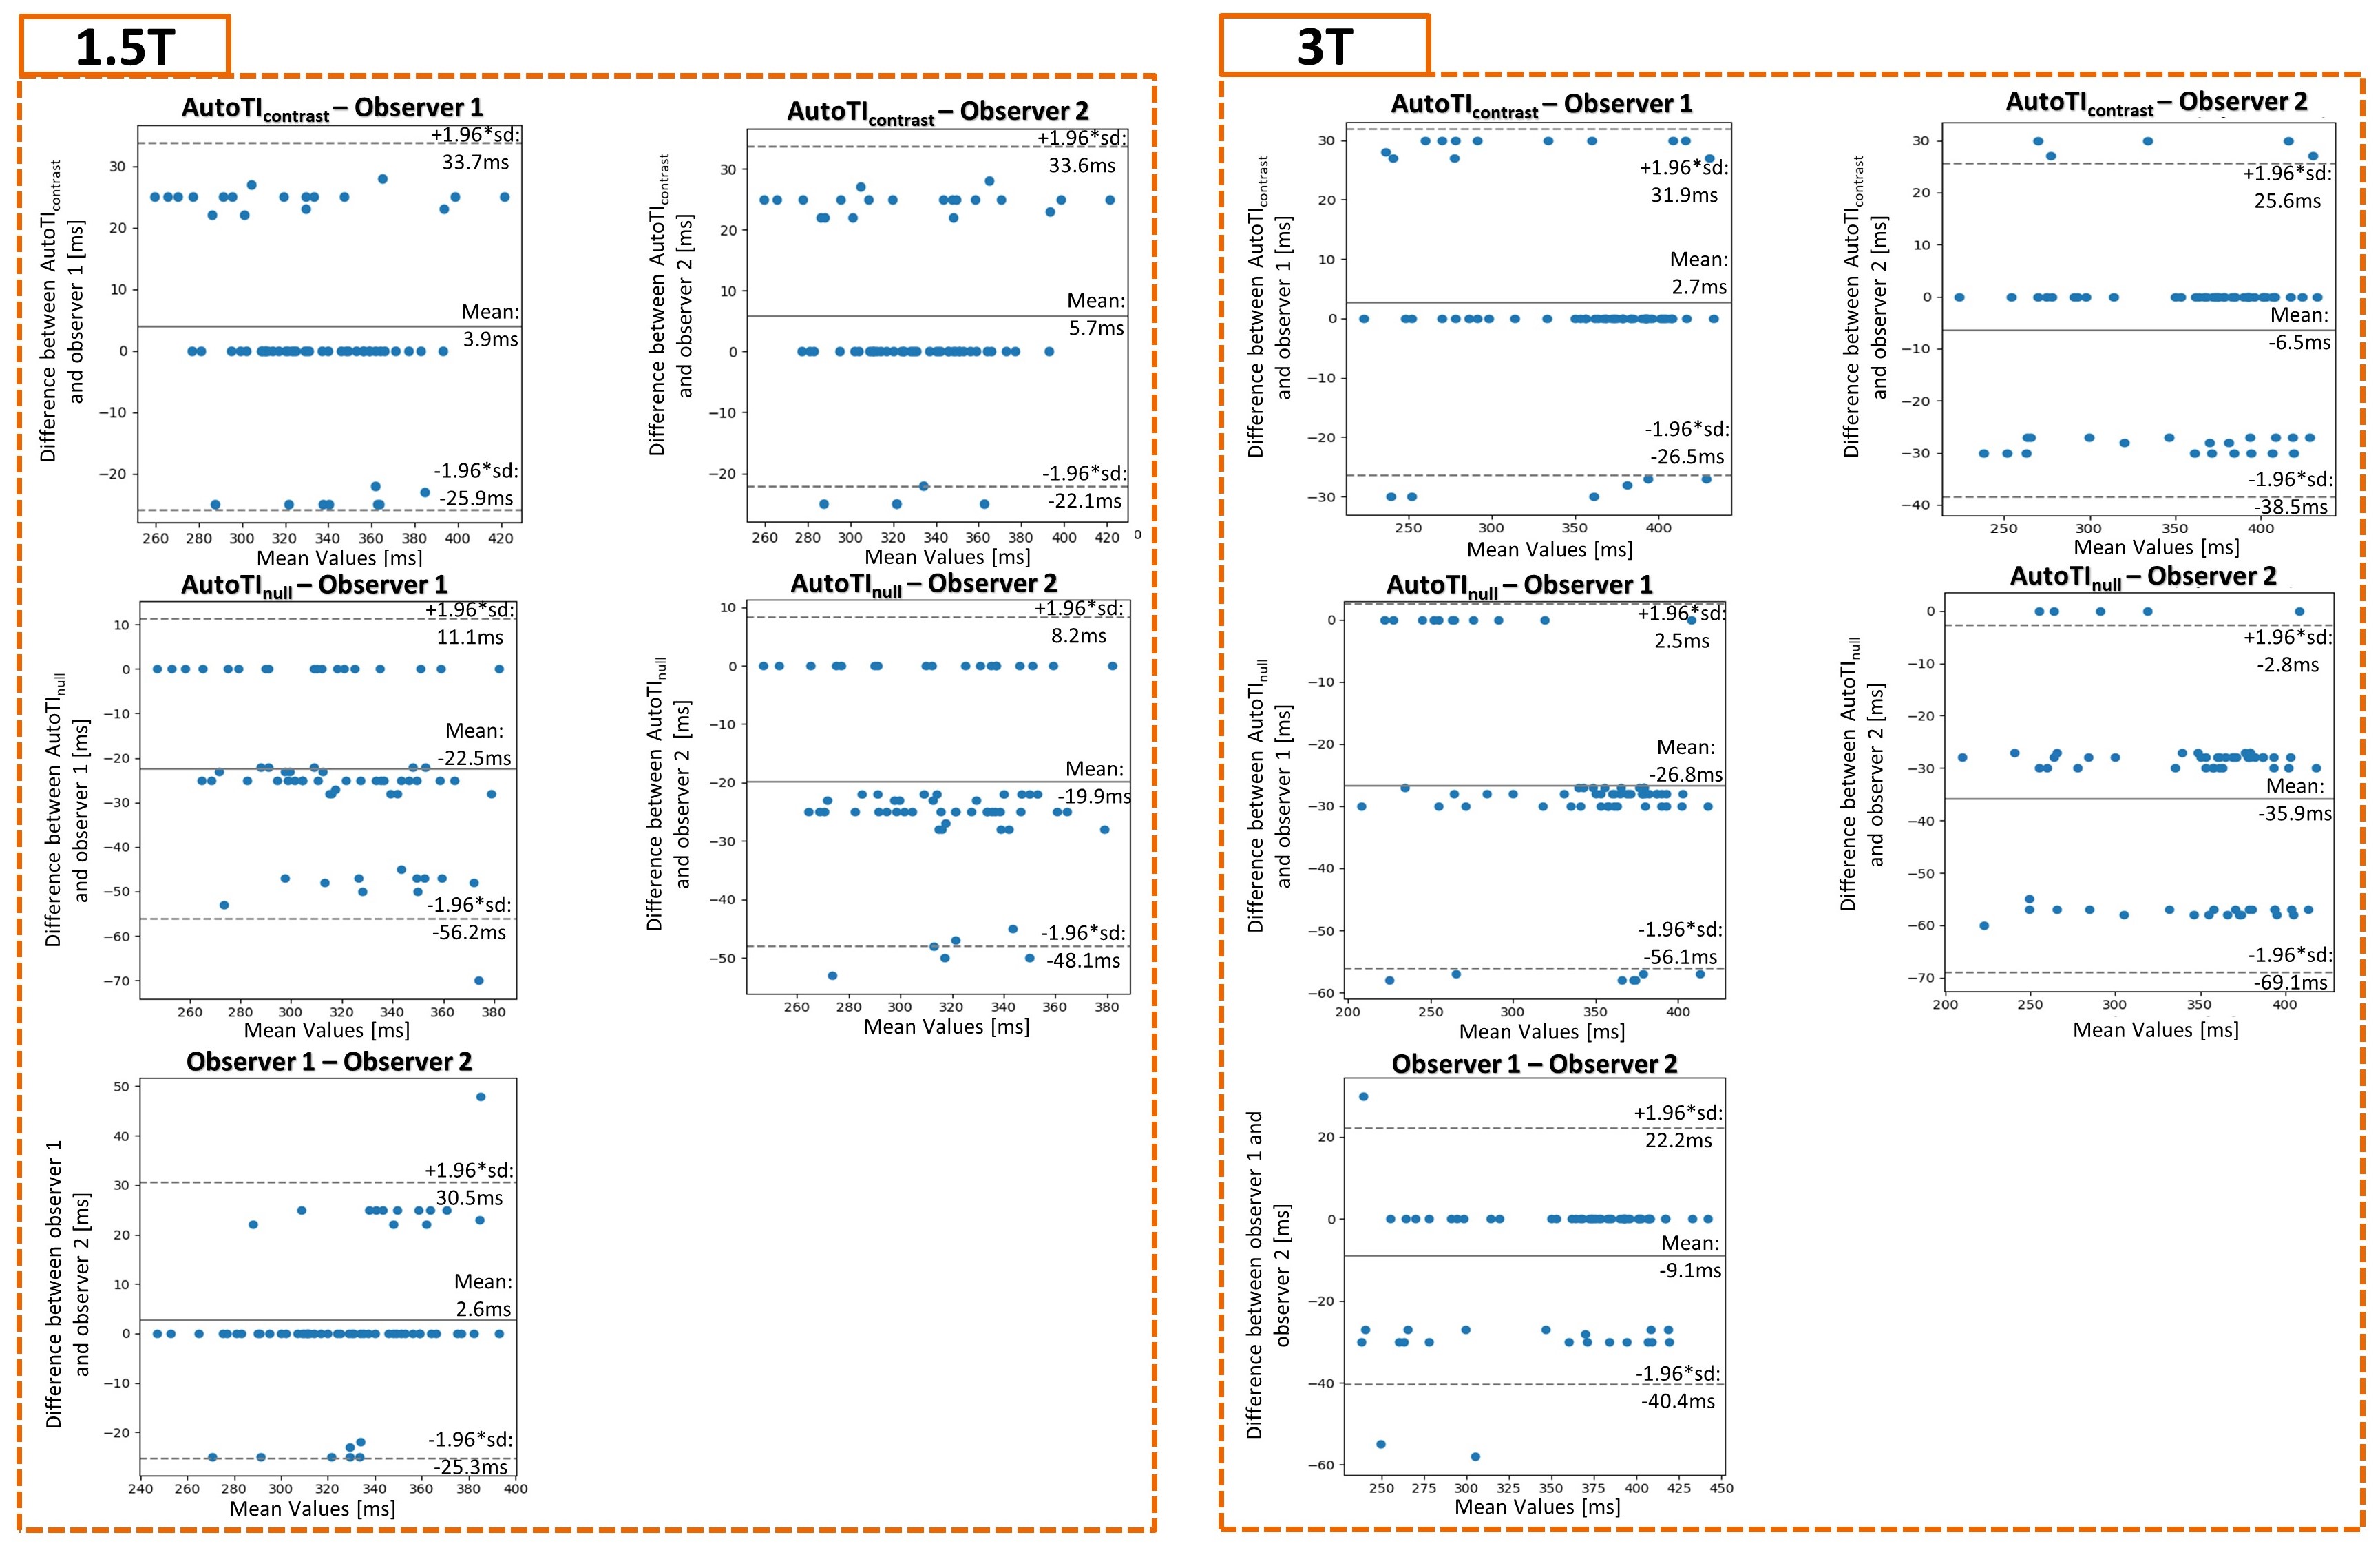
Figure 3: Left: The performance results from
1.5T data between the TIcontrast and each observer and the TInull
and each observer. Right: The performance results of 3.0T data between the TIcontrast
and each observer and the TInull and each observer. The
interobserver variability is shown in each block in the third row.
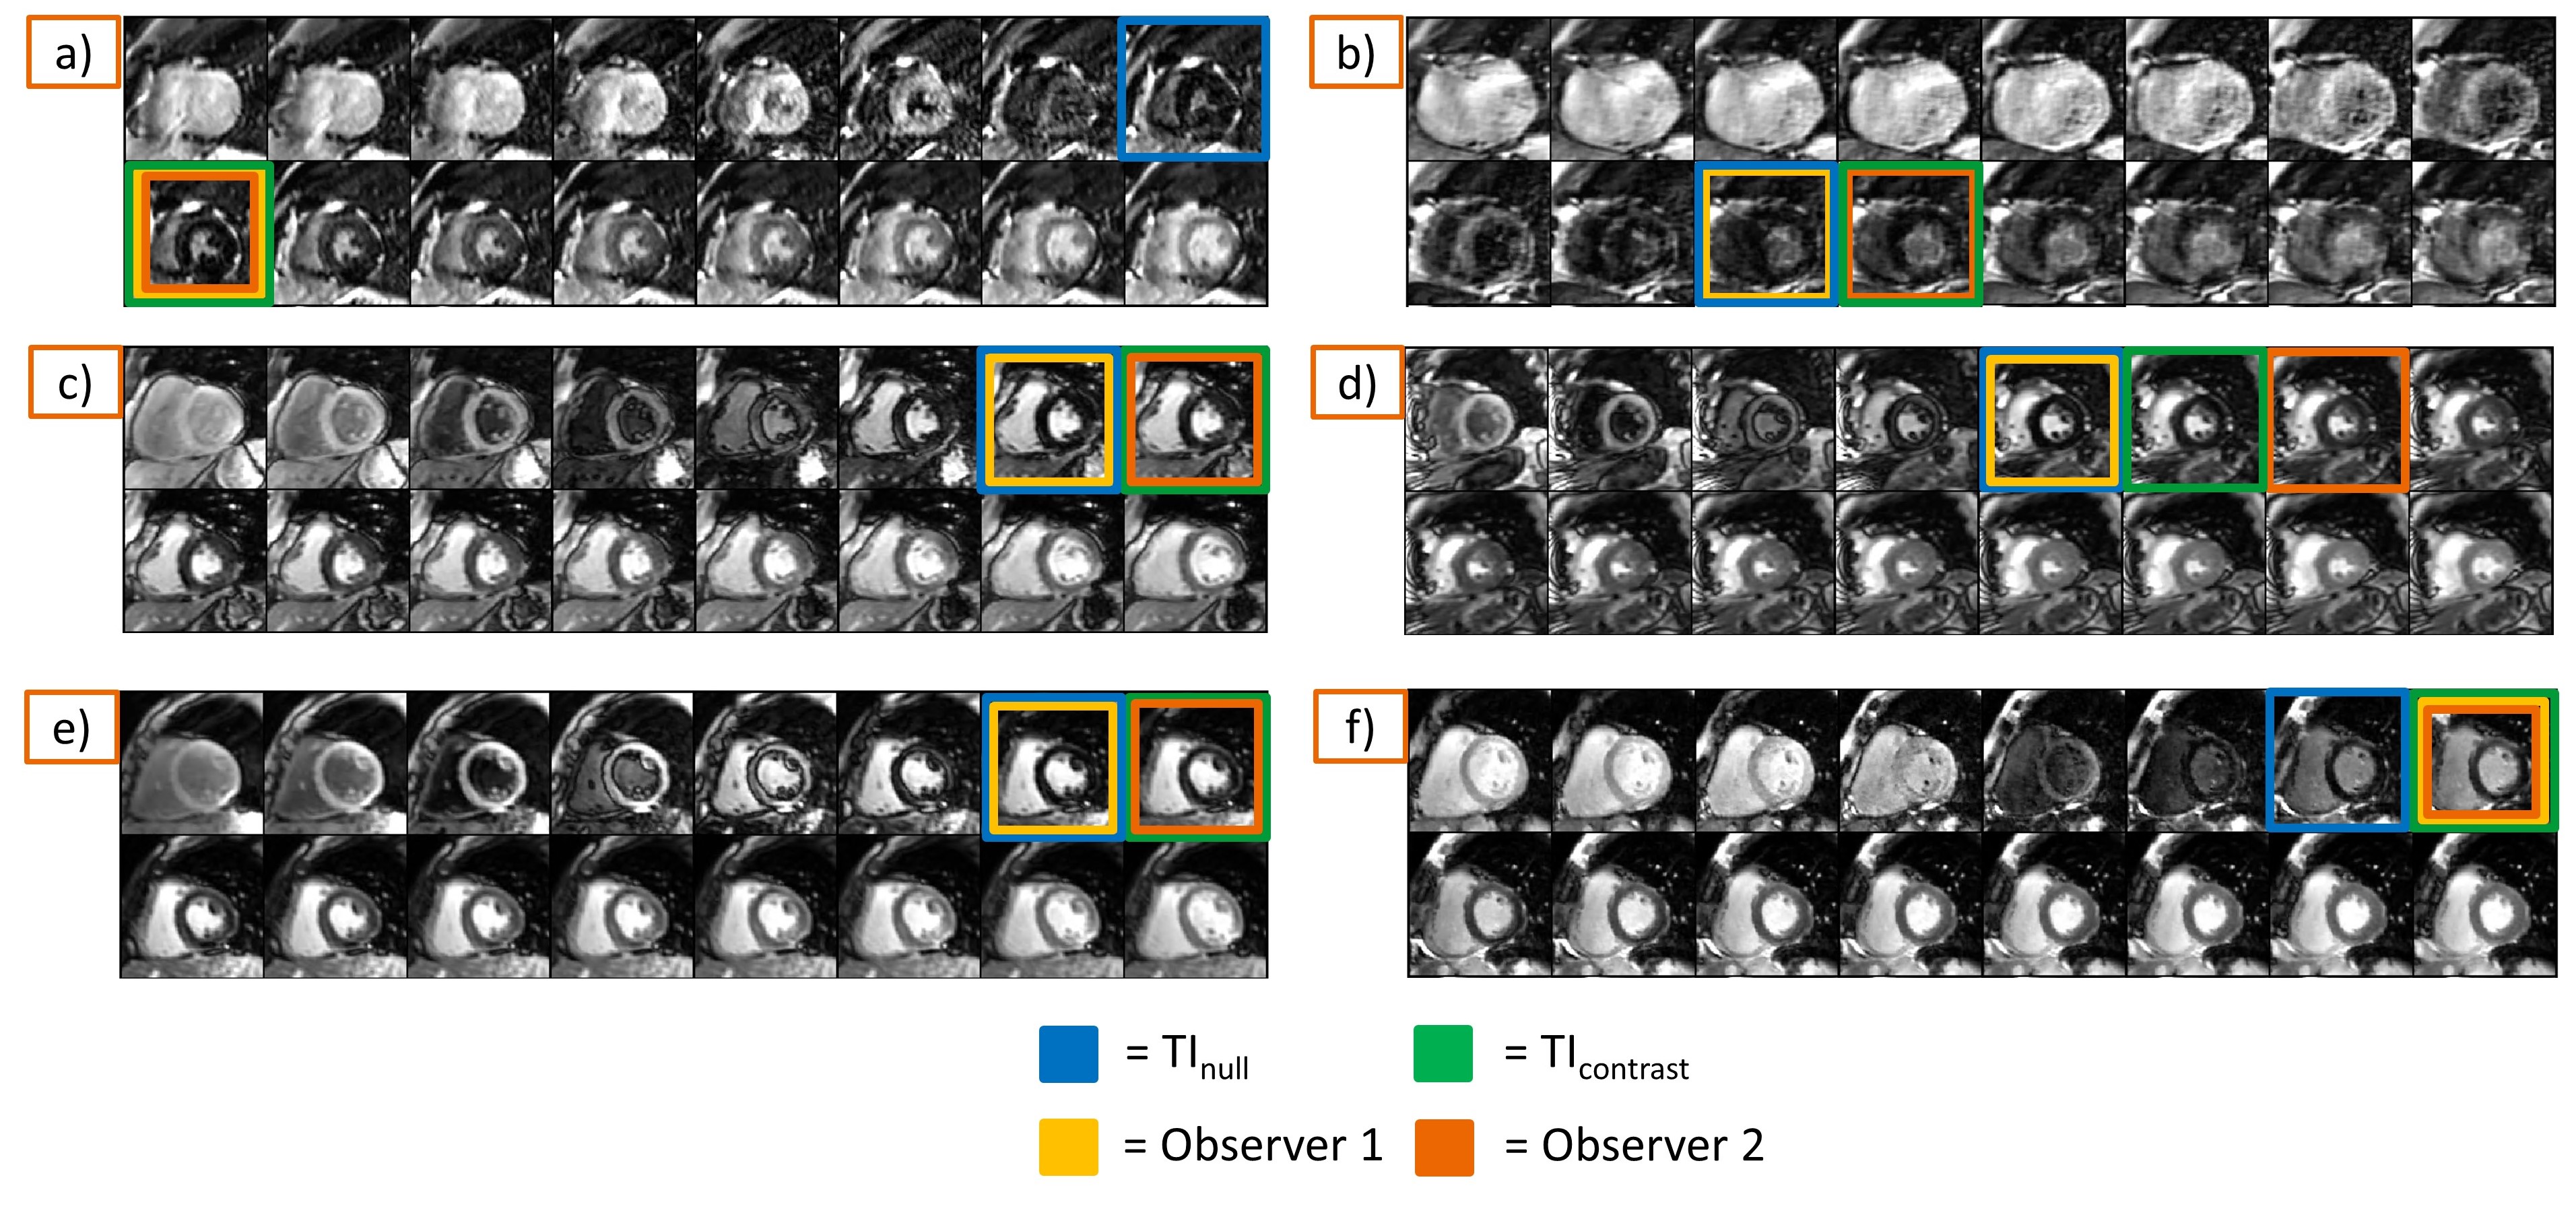
Figure 4: Qualitative results of the system output and the
observers' annotation. The illustrated images show the first 16 phases of the standardized
TI scout series. In a), b) the results on 1.5T are shown. In c), d) the results
of 3.0T data are shown. In d) the observer 2 was selected one frame later than TIcontrast. However, the deviation is negligible. In e) series
acquired without- while in f) with compressed sensing on the same patient with
4min 30s in between.
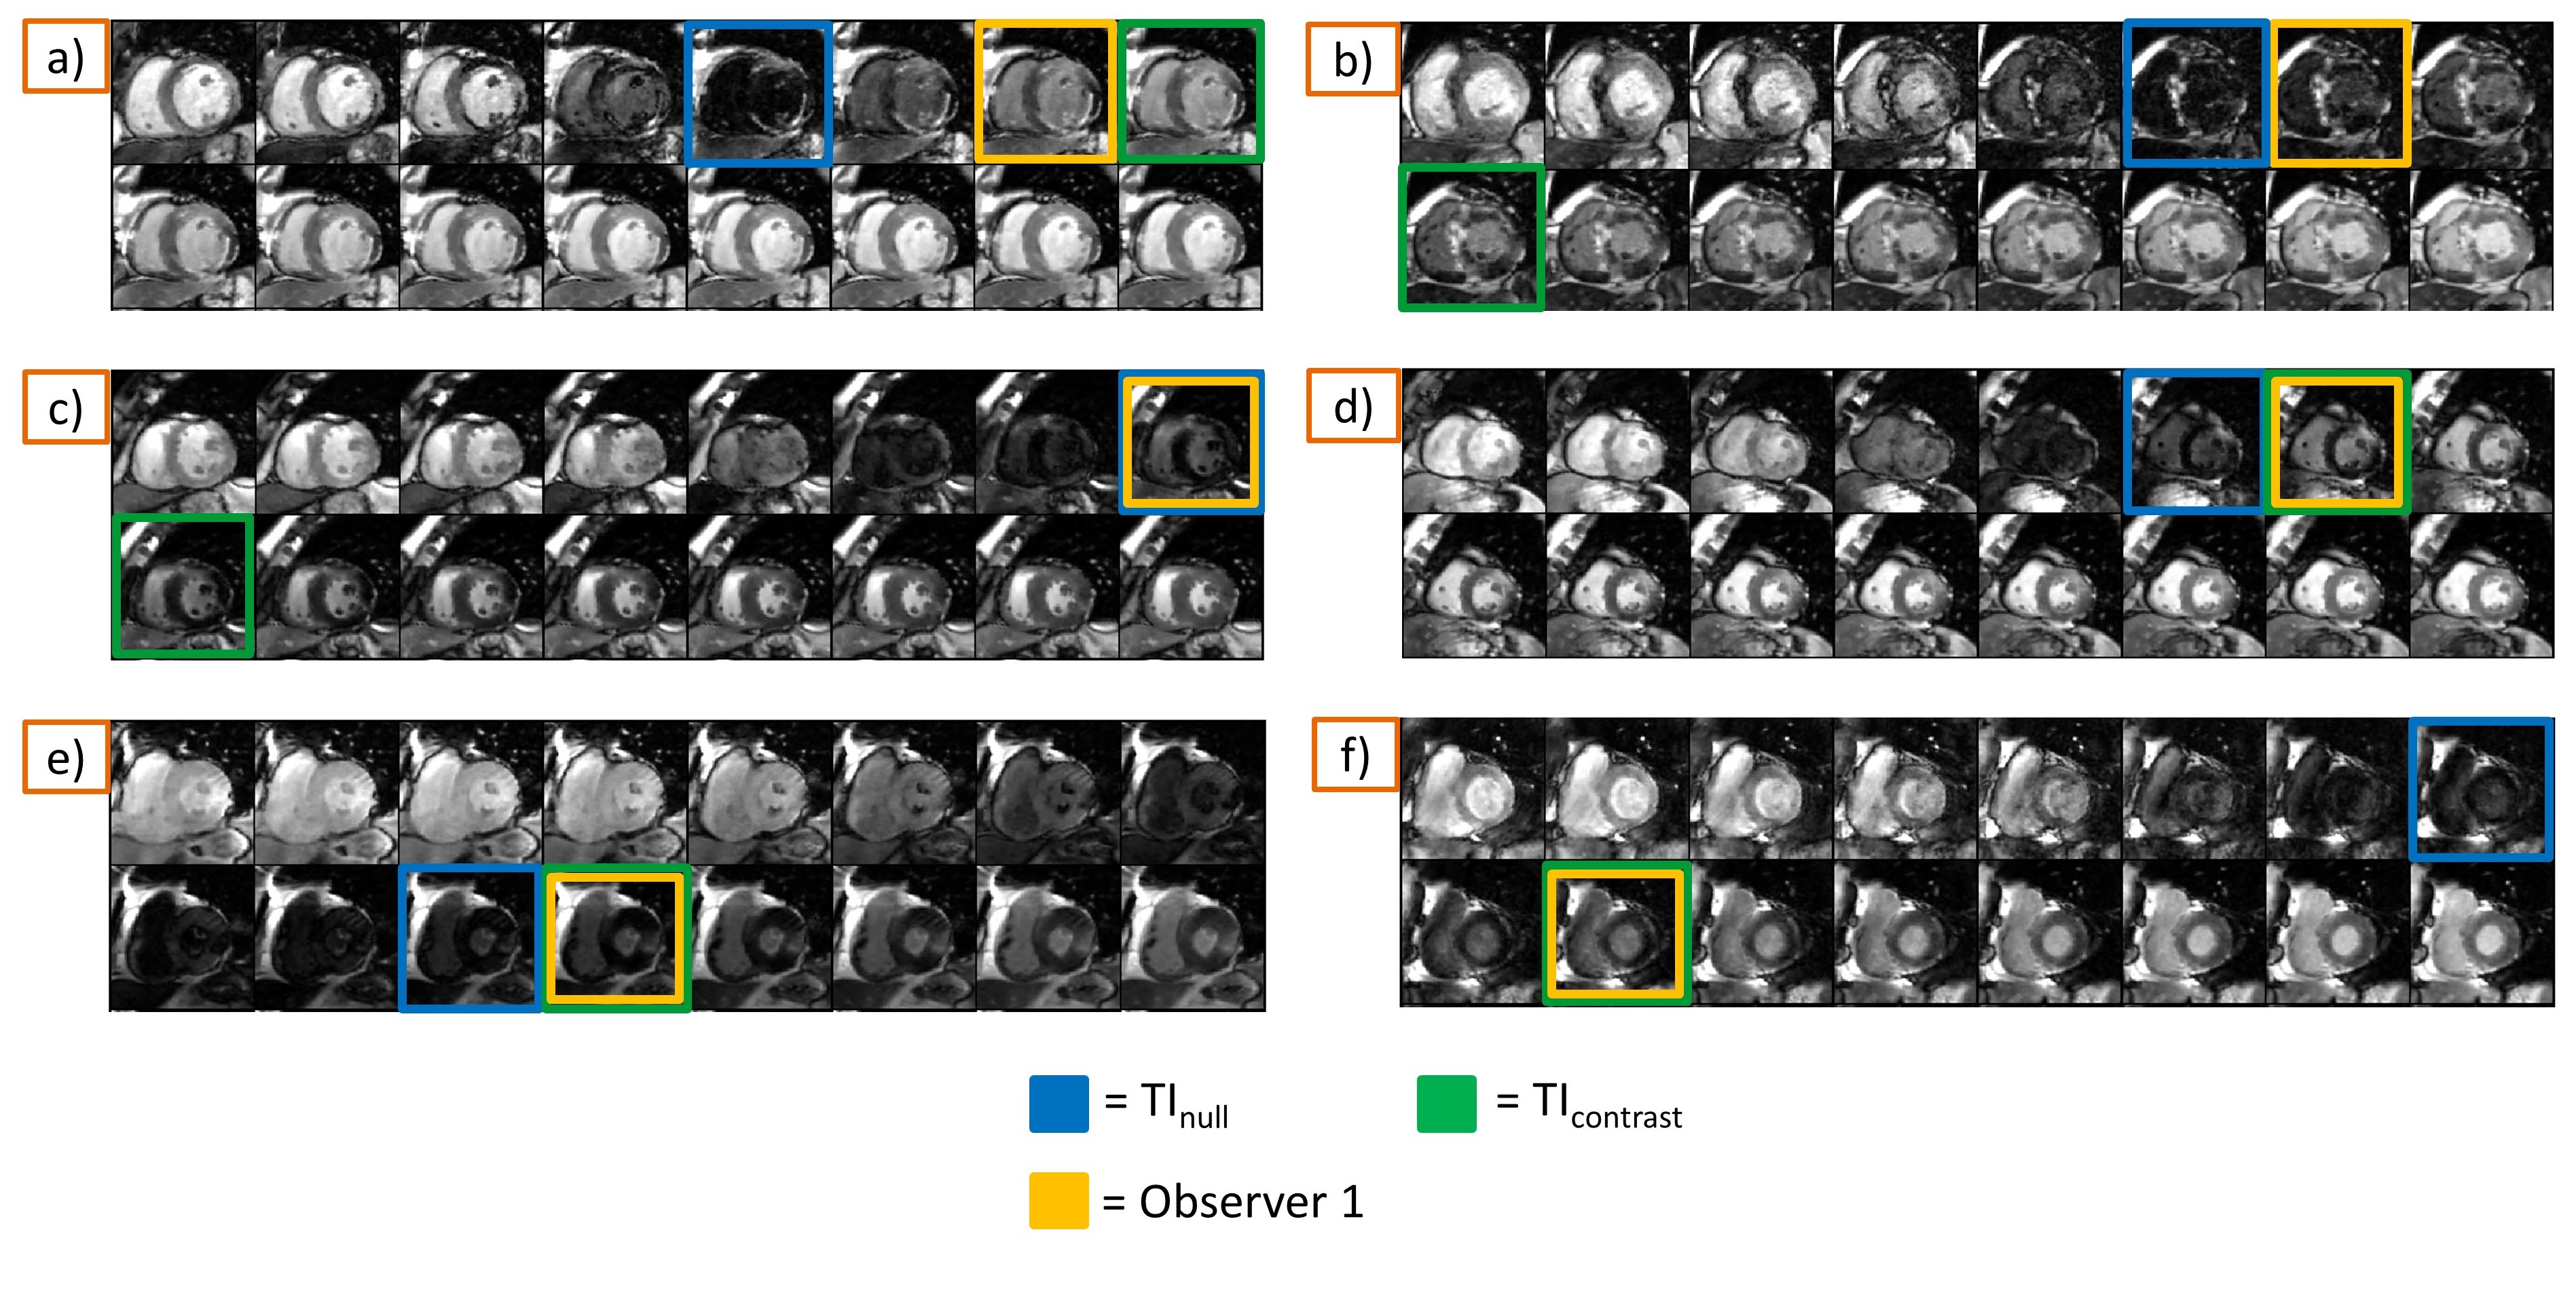
Figure 5: Qualitative results of the output of the system on
a prospective patient study are shown. In a) patient with scar, in b) patient
diagnosed with hypertrophic cardiomyopathy, in c) patient with a small lesion, in
d), e), and f) patients without lesions.