0209
Is the inversion time important? A study of the reciprocal influence of inversion time and b-value on diffusion and longitudinal relaxation in MRI
Tomasz Pieciak1,2, Maryam Afzali3, Fabian Bogusz1, Dominika Ciupek1, Derek K. Jones3, and Marco Pizzolato4,5
1AGH University of Science and Technology, Kraków, Poland, 2LPI, ETSI Telecomunicación, Universidad de Valladolid, Valladolid, Spain, Valladolid, Spain, 3Cardiff University Brain Research Imaging Centre (CUBRIC), School of Psychology, Cardiff University, Cardiff, United Kingdom, 4Department of Applied Mathematics and Computer Science, Technical University of Denmark, Kongens Lyngby, Denmark, 5Signal Processing Lab (LTS5), École polytechnique fédérale de Lausanne (EPFL), Lausanne, Switzerland
1AGH University of Science and Technology, Kraków, Poland, 2LPI, ETSI Telecomunicación, Universidad de Valladolid, Valladolid, Spain, Valladolid, Spain, 3Cardiff University Brain Research Imaging Centre (CUBRIC), School of Psychology, Cardiff University, Cardiff, United Kingdom, 4Department of Applied Mathematics and Computer Science, Technical University of Denmark, Kongens Lyngby, Denmark, 5Signal Processing Lab (LTS5), École polytechnique fédérale de Lausanne (EPFL), Lausanne, Switzerland
Synopsis
The nervous tissue microstructure can be characterized by sensitizing the MRI signal to diffusion. The advent of multi-parametric sequences enabled the collection of diffusion data at different echo and inversion times. While the link between diffusion and transverse relaxation has undergone several investigations, in this work we characterize the relationship between the diffusion and longitudinal relaxation, and quantify the reciprocal influence of b-values and inversion time on the quantification of T1 and of diffusion metrics, interpreting our findings on in vivo data in the light of numerical simulations, and showing evidence that longitudinal relaxation locally modifies the diffusion contrast.
Introduction
Magnetic resonance imaging (MRI) can be used to infer information about the tissue microstructure. While the diffusive properties of the microstructure can be investigated with diffusion MRI1,2, relaxation parameters such as the echo time (TE) and the inversion time (TI) can be used to weigh the signal according to the transverse (T2, T2*) or longitudinal relaxation (T1) times using multi-parametric sequences such as ZEBRA6. While the dependency of the diffusion signal on the transverse relaxation has been widely investigated9, and the longitudinal relaxation on the crossing fibres7,8, and joint T1/T2/diffusion spectroscopic analyses have been presented14, in this work we characterize, on one hand, the influence of the T1-weighting on Diffusion Tensor Imaging (DTI)3 and Mean Apparent Propagator (MAP)4,5 metrics and, on the other, the influence of the diffusion-weighting on the estimation of T1.Methods and materials
For the analysis, we simulated a multi-parametric signal and used in vivo data, from which we obtained DTI3 and MAP-MRI4,5 metrics at different TI, and T1 estimates at different b-values.Multi-parametric data: The ZEBRA6 sequence provides the relaxation and diffusion information at the same time. The combined contrast along one diffusion encoding direction is given by:
$$S(TI,TE,b) \propto (1 - 2 \exp(-TI/T_1))\exp(-TE/T_2)\exp(-bD),$$
where, $$$b$$$, is the b-value and $$$D$$$ is the diffusion coefficient.
In silico data: The synthetic signal is generated using a two-compartment model10 considering the effect of $$$T_1$$$/$$$T_2$$$ relaxation times on the intracellular and extracellular compartments. The intracellular compartment is modeled with dispersed sticks, while the extracellular is modeled with dispersed axisymmetric tensors (see Fig.1):
$$S_{(TI,TE=80\ \mathrm{ms},b, \mathbf{g})}/S_{(TI, TE=80\ \mathrm{ms}, b = 0)} = f (1 - 2 \exp(-TI/T_1^a))\exp(-TE/T_2^a) \int_{\mathbb{S}^2} W(\mathbf{n}) \exp\left(-b D_a(\mathbf{g}\cdot\mathbf{n})^2\right) d\mathbf{n} \\ + (1-f) (1 - 2 \exp(-TI/T_1^e))\exp(-TE/T_2^e) \exp(-bD_e^\perp) \int_{\mathbb{S}^2} W(\mathbf{n}) \exp\left(-b(D_e^{\mid\mid}-D_e^\perp)(\mathbf{g}\cdot\mathbf{n})^2\right) d\mathbf{n}.$$
In vivo data: Data from five healthy subjects was selected from the MUDI challenge dataset6,13. The data were acquired using clinical Philips Achieva 3T scanner (Best, Netherlands) with a modified single-shot PGSE EPI sequence6 over four $$$b$$$-shells at $$$\{5, 10, 20, 30\} \times 10^2 \ \mathrm{s}/\mathrm{mm}^2$$$ with 105 diffusion gradient directions, $$$TI \in [20, 7322.7] \ \mathrm{ms}$$$, $$$TE \in \{80,105,130\} \ \mathrm{ms}$$$. We interpolated the datasets with a spline interpolation over each b-value and gradient direction to obtain a fully sampled lattice over the space (TI, TE, b).
Diffusion metrics: We used two representations: 1) DTI estimated with15 (b-value at $$$1000 \ \mathrm{s}/\mathrm{mm}^2$$$, 21 gradient directions) from which we calculated FA and MD, 2) MAPL4,5 (all b-values, 105 gradient directions, regularization parameter $$$\lambda=0.2$$$) from which we calculated RTOP, RTAP, RTPP, MSD, and QIV.
Longitudinal relaxation: The longitudinal T1 relaxation maps were estimated for each b-value separately using a non-linear least squares.
Atlases: Regions of interest (ROIs) over white and gray matter (WM, GM) were obtained with the John Hopkins University DTI-based atlas16 and sub-striatal regions atlas17 both using the FSL 5.0.1118.
Results
As illustrated in Fig.1, we investigated the expected behavior using the synthetic model while selecting diffusivities and T1/T2 values according to the literature19,20,21. We observe a specific “up-and-down/down-and-up” behavior in all the indices, after which the measures converge to fixed values at higher TI.In Fig.2 we report the visual inspection of the metrics retrieved under different TIs. We observe that the maps report the same behavior as that predicted in the synthetic results. We also visually see that the changes in contrast across TI is relevant, a sign that different T1 populations manifest different diffusion properties. The pairwise differences optically confirms the “up-and-down” trend previously observed within silico experiments, which is mainly due to the nature of the inversion recovery signal.
The “up-and-down” trend is better quantified by the boxplots in Fig.3. In comparison to the synthetic experiment, the peak value is shifted towards higher TI. We notice that all the measures show a consistent behaviour over WM/GM regions.
In the last two figures, we characterize the effects of the diffusion-weighting on the estimation of T1. Indeed, this analysis can reveal whether there are compartments with various T1 having different diffusive properties. By increasing the b-value, more and more restricted compartments are selected, hence only those compartments contribute to the calculated T1. Fig.4 illustrates the different T1 maps calculated, and their differences for one representative subject, while the boxplots in Fig.5 demonstrates the trend of T1 as a function of b-value.
Conclusions
We studied the effect of inversion time on the DTI and MAP-MRI metrics. The results show that as we increase the inversion time the contrast between the GM/WM in DTI and MAP-MRI indices increases. This can be interpreted in the light of their different average T1 values.- The “up-and-down” behavior predicted with in silico and verified experimentally suggests that inversion times far from the time of inversion guarantee more stable metrics.
- The inversion time could be used to tune the contrast of the diffusion metrics to be sensitive to the specific tissue types.
- The results of Fig. 5 demonstrate the presence of different T1 compartments in all of the regions, as the distribution of T1 values reduces as the b-value increases.
- Such a behavior suggests that intra-axonal T1 estimates would be enabled by acquiring data at different TIs while using high b-values, similarly to what done by9 for T2.
Acknowledgements
Tomasz Pieciak acknowledges the Polish National Agency for Academic Exchange for grant PN/BEK/2019/1/00421 under the Bekker programme and the Ministry of Science and Higher Education (Poland) under the scholarship for outstanding young scientists. Maryam Afzali and Derek K. Jones are supported by a Wellcome Trust Investigator Award (096646/Z/11/Z) and a Wellcome Trust Strategic Award (104943/Z/14/Z). Fabian Bogusz acknowledges AGH University of Science and Technology, Kraków, Poland (16.16.120.773). Marco Pizzolato acknowledges the European Union’s Horizon 2020 research and innovation programme under the Marie Marie Skłodowska-Curie grant agreement No 75446.References
- Le Bihan, D., Mangin, J.F., Poupon, C., Clark, C.A., Pappata, S., Molko, N. and Chabriat, H., 2001. Diffusion tensor imaging: concepts and applications. Journal of Magnetic Resonance Imaging, 13(4), pp.534-546.
- Alexander, D.C., Dyrby, T.B., Nilsson, M. and Zhang, H., 2019. Imaging brain microstructure with diffusion MRI: practicality and applications. NMR in Biomedicine, 32(4), p.e3841.
- Basser, P.J., Mattiello, J., LeBihan, D.. Estimation of the effective self-diffusion tensor from the NMR spin echo. Journal of Magnetic Resonance, Series B 1994;103(3):247–254.
- Ozarslan, E., Koay, C.G., Shepherd, T.M., Komlosh, M.E.,Irfanŏglu, M.O., Pierpaoli, C., Basser, P.J.. Mean apparent propagator (MAP) MRI: a novel diffusion imaging method for mapping tissue microstructure. NeuroImage 2013;78:16–32.
- Fick, R.H., Wassermann, D., Caruyer, E. and Deriche, R., 2016. MAPL: Tissue microstructure estimation using Laplacian-regularized MAP-MRI and its application to HCP data. NeuroImage, 134, pp.365-385.
- Hutter, J., Slator, P.J., Christiaens, D., Teixeira, R.P.A., Roberts,T., Jackson, L., Price, A.N., Malik, S., Hajnal, J.V.. Integrated and efficient diffusion-relaxometry using ZEBRA. Scientific Reports 2018;8(1):1–13.
- De Santis, S., Assaf, Y., Jeurissen, B., Jones, D.K. and Roebroeck, A., 2016. T1 relaxometry of crossing fibres in the human brain. Neuroimage, 141, pp.133-142.
- De Santis, S., Barazany, D., Jones, D.K. and Assaf, Y., 2016. Resolving relaxometry and diffusion properties within the same voxel in the presence of crossing fibres by combining inversion recovery and diffusion‐weighted acquisitions. Magnetic resonance in medicine, 75(1), pp.372-380.
- McKinnon, E. T., & Jensen, J. H. (2019). Measuring intra‐axonal T2 in white matter with direction‐averaged diffusion MRI. Magnetic resonance in medicine, 81(5), 2985-2994.
- Novikov, D.S., Veraart, J., Jelescu, I.O. and Fieremans, E., 2018. Rotationally-invariant mapping of scalar and orientational metrics of neuronal microstructure with diffusion MRI. NeuroImage, 174, pp.518-538.
- Zhang, H., Schneider, T., Wheeler-Kingshott, C., Alexander, D..NODDI: practical in vivo neurite orientation dispersion and den-sity imaging of the human brain. Neuroimage 2012;61(4):1000–1016.
- Gudbjartsson, H. and Patz, S., 1995. The Rician distribution of noisy MRI data. Magnetic Resonance in Medicine, 34(6), pp.910-914.
- Pizzolato M., Palombo M., Bonet-Carne E., Tax Ch.M.W., Grussu F., Ianus A., Bogusz F., Pieciak T., Ning L., Larochelle H., Descoteaux M., Chamberland M., Blumberg S.B., Mert-zanidou T., Alexander D.C., Afzali M., Aja-Fernández S., Jones D.K., Westin C-F., Ra-thi Y., Baete S.H., Cordero-Grande L., Ladner T., Slator P.J., Hajnal J.V., Thiran J-P.,Price A.N., Sepehrband F., Zhang F., Hutter J., Acquiring and predicting MUlti-dimensionalDIffusion (MUDI) data: an open challenge, Medical Image Computing and Computer As-sisted Interventions Conference (MICCAI), Computational Diffusion MRI, 2020
- Kim, D., Doyle, E.K., Wisnowski, J.L., Kim, J.H. and Haldar, J.P., 2017. Diffusion‐relaxation correlation spectroscopic imaging: a multidimensional approach for probing microstructure. Magnetic resonance in medicine, 78(6), pp.2236-2249.
- Chang, L.C., Jones, D.K. and Pierpaoli, C., 2005. RESTORE: robust estimation of tensors by outlier rejection. Magnetic Resonance in Medicine: An Official Journal of the International Society for Magnetic Resonance in Medicine, 53(5), pp.1088-1095.
- Mori, S., Wakana, S., Van Zijl, P.C. and Nagae-Poetscher, L.M., 2005. MRI atlas of human white matter. Elsevier.
- Tziortzi, A.C., Searle, G.E., Tzimopoulou, S., Salinas, C., Beaver, J.D., Jenkinson, M., Laruelle, M., Rabiner, E.A. and Gunn, R.N., 2011. Imaging dopamine receptors in humans with [11C]-(+)-PHNO: dissection of D3 signal and anatomy. Neuroimage, 54(1), pp.264-277.
- Smith, S.M., Jenkinson, M., Woolrich, M.W., Beckmann, C.F., Behrens, T.E., Johansen-Berg, H., Bannister, P.R., De Luca, M., Drobnjak, I., Flitney, D.E. and Niazy, R.K., 2004. Advances in functional and structural MR image analysis and implementation as FSL. Neuroimage, 23, pp.S208-S219.
- Lancaster, J., Hardies, L.J., Andrews, T. and Fox, P., 2000. MRI assessment of myelination in the 18q-syndrome using T1. Neuroimage, 5(11), p.S489.
- Veraart, J., Novikov, D.S. and Fieremans, E., 2018. TE dependent Diffusion Imaging (TEdDI) distinguishes between compartmental T2 relaxation times. NeuroImage, 182, pp.360-369.
- Wang, Y., van Gelderen, P., de Zwart, J.A. and Duyn, J.H., 2020. B0-field dependence of MRI T1 relaxation in human brain. NeuroImage, p.116700.
Figures

The effect of inversion time on DTI and MAP-MRI metrics using synthetic data. We assume two scenarios; 1) the same $$$T_1$$$/$$$T_2$$$ relaxation times for the intra- and extracellular compartments, 2) two different relaxation times for each compartment. We repeat the experiment over 100 repetitions generating the samples contaminated with Rician noise12 (SNR = 20) and calculate the mean changes of the metrics using the sample mean (FA, MD, MSD, QIV) and geometric mean (RTOP, RTAP, RTPP).
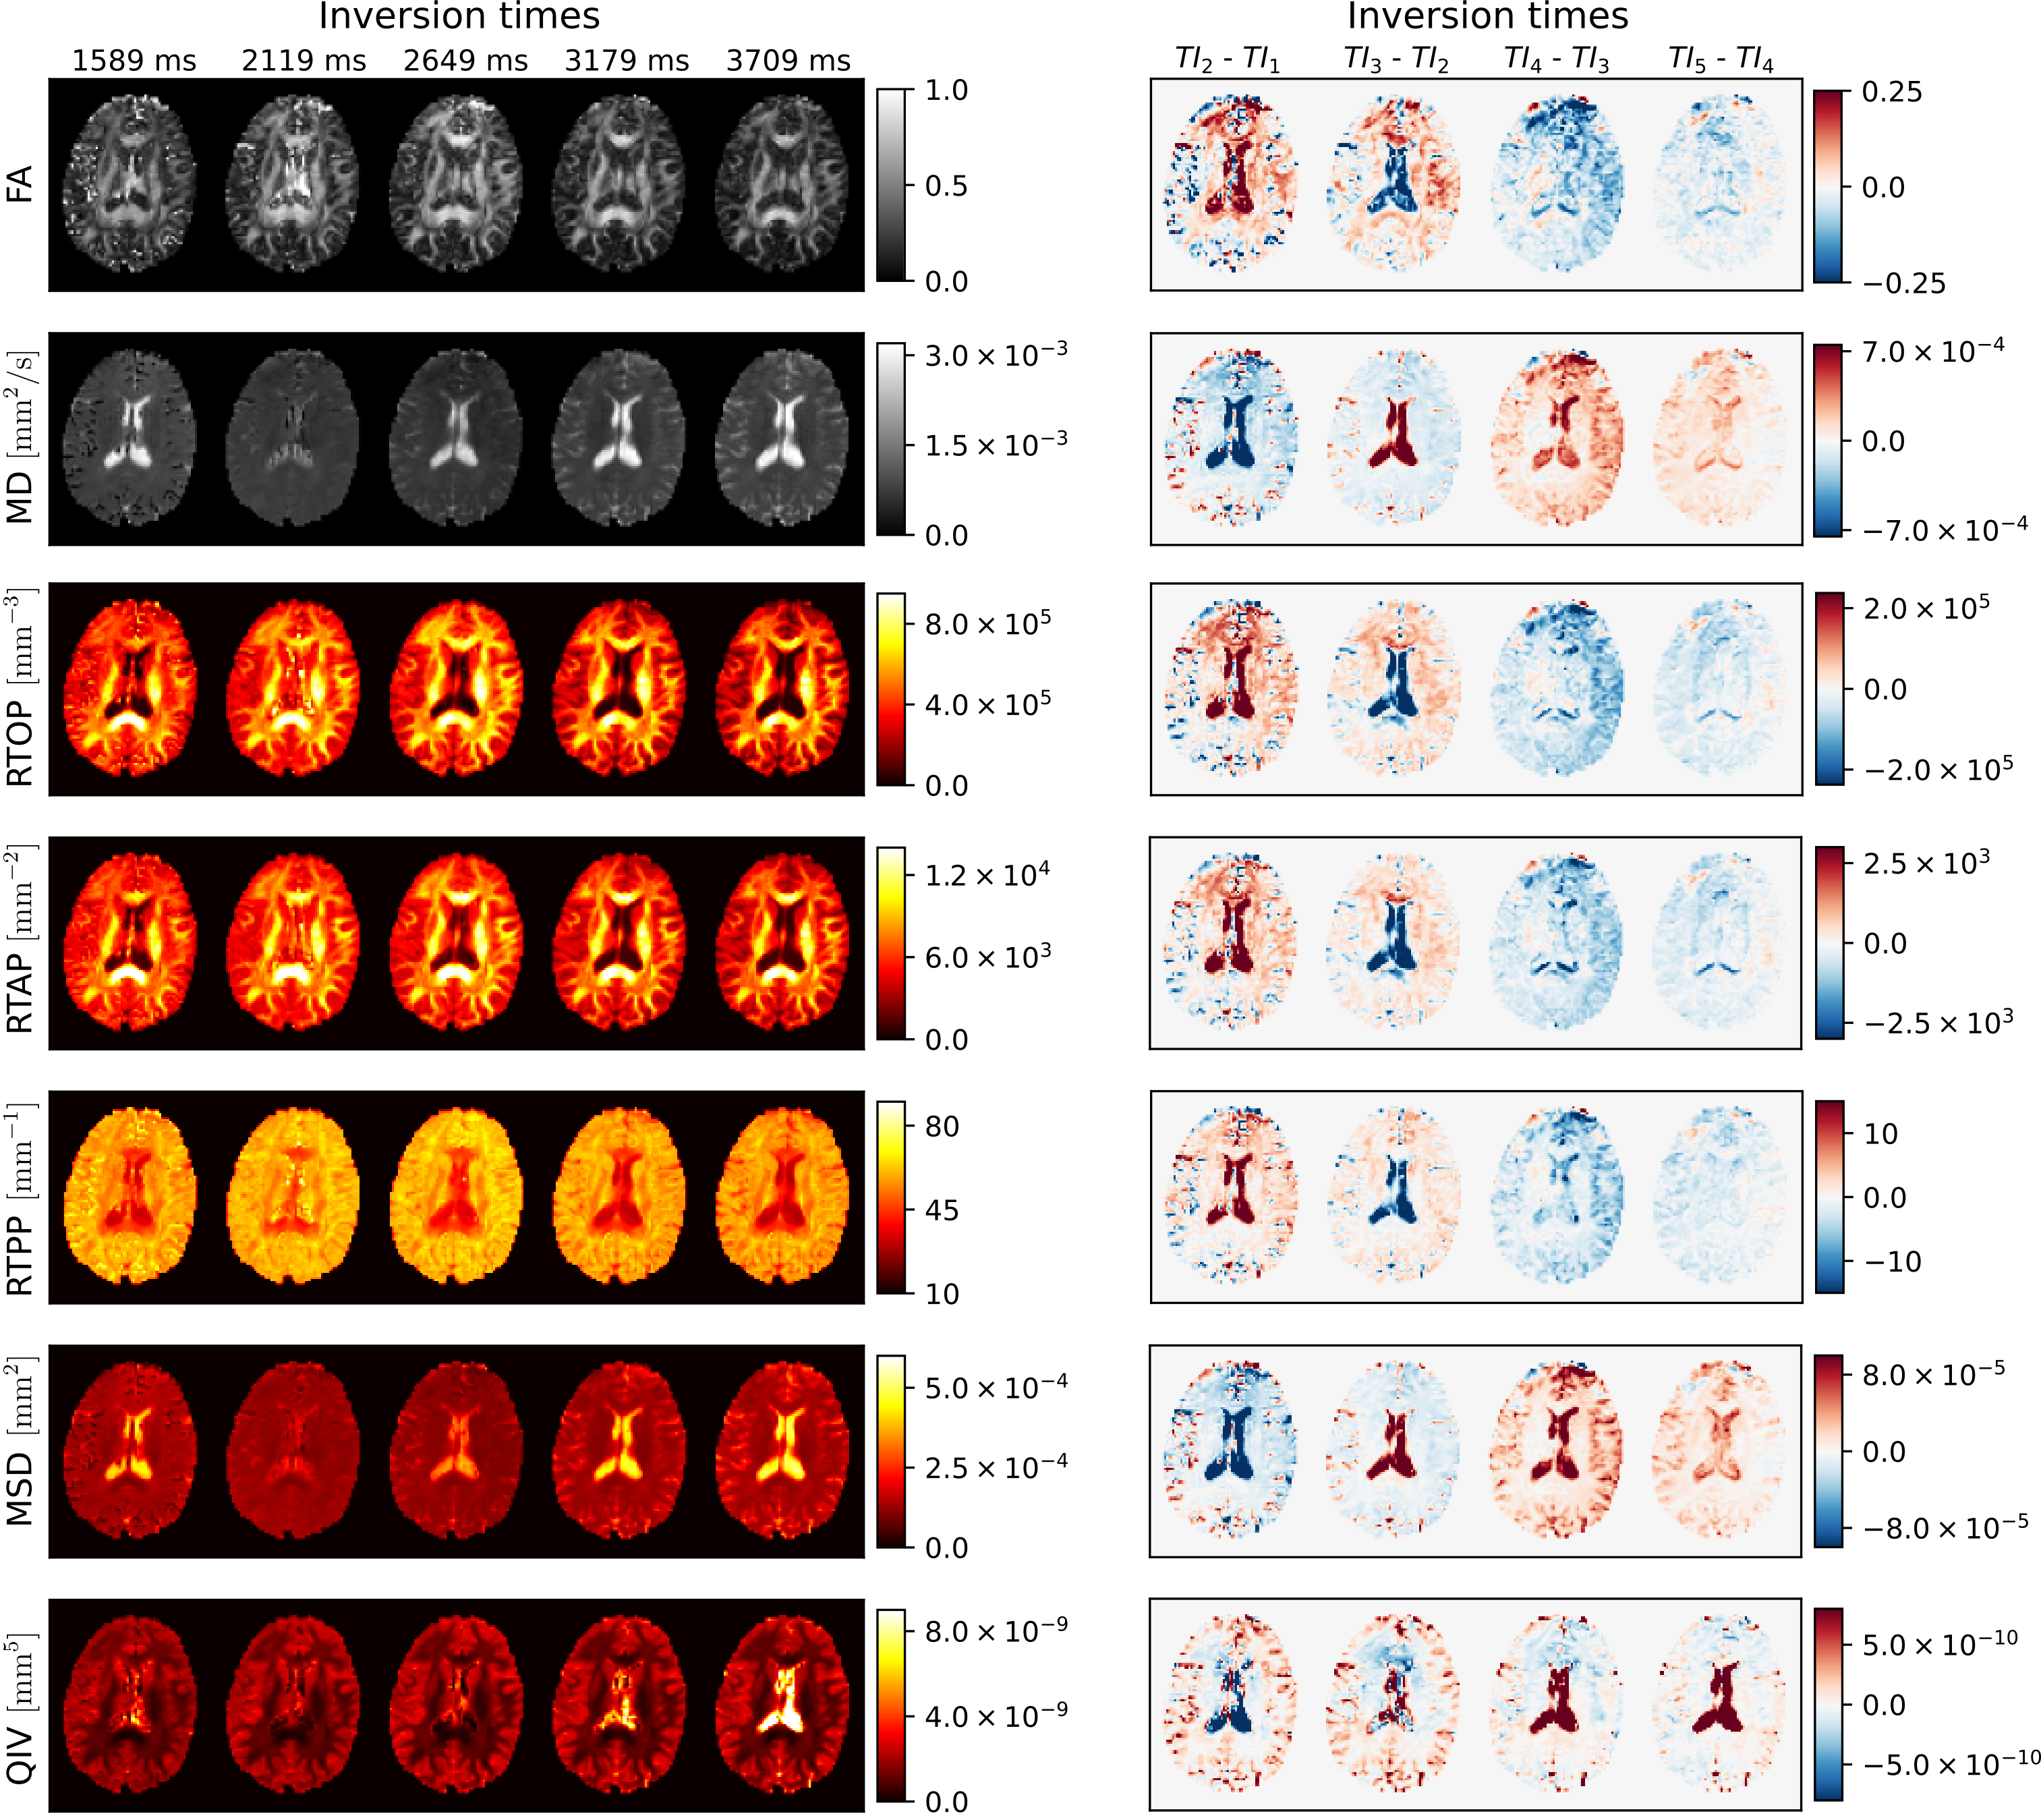
Visual inspection of DTI and MAP-MRI metrics under different inversion times (left) and pairwise differences between the representations at $$$k+1$$$ and $$$k$$$-th inversion times (right). For example, in the first column we observe the difference between the maps obtained at $$$TI_2=2119 \ \mathrm{ms}$$$ and $$$TI_1=1598 \ \mathrm{ms}$$$, in the second column the difference between $$$TI_3=2649 \ \mathrm{ms}$$$ and $$$TI_2=2119 \ \mathrm{ms}$$$, and so on.
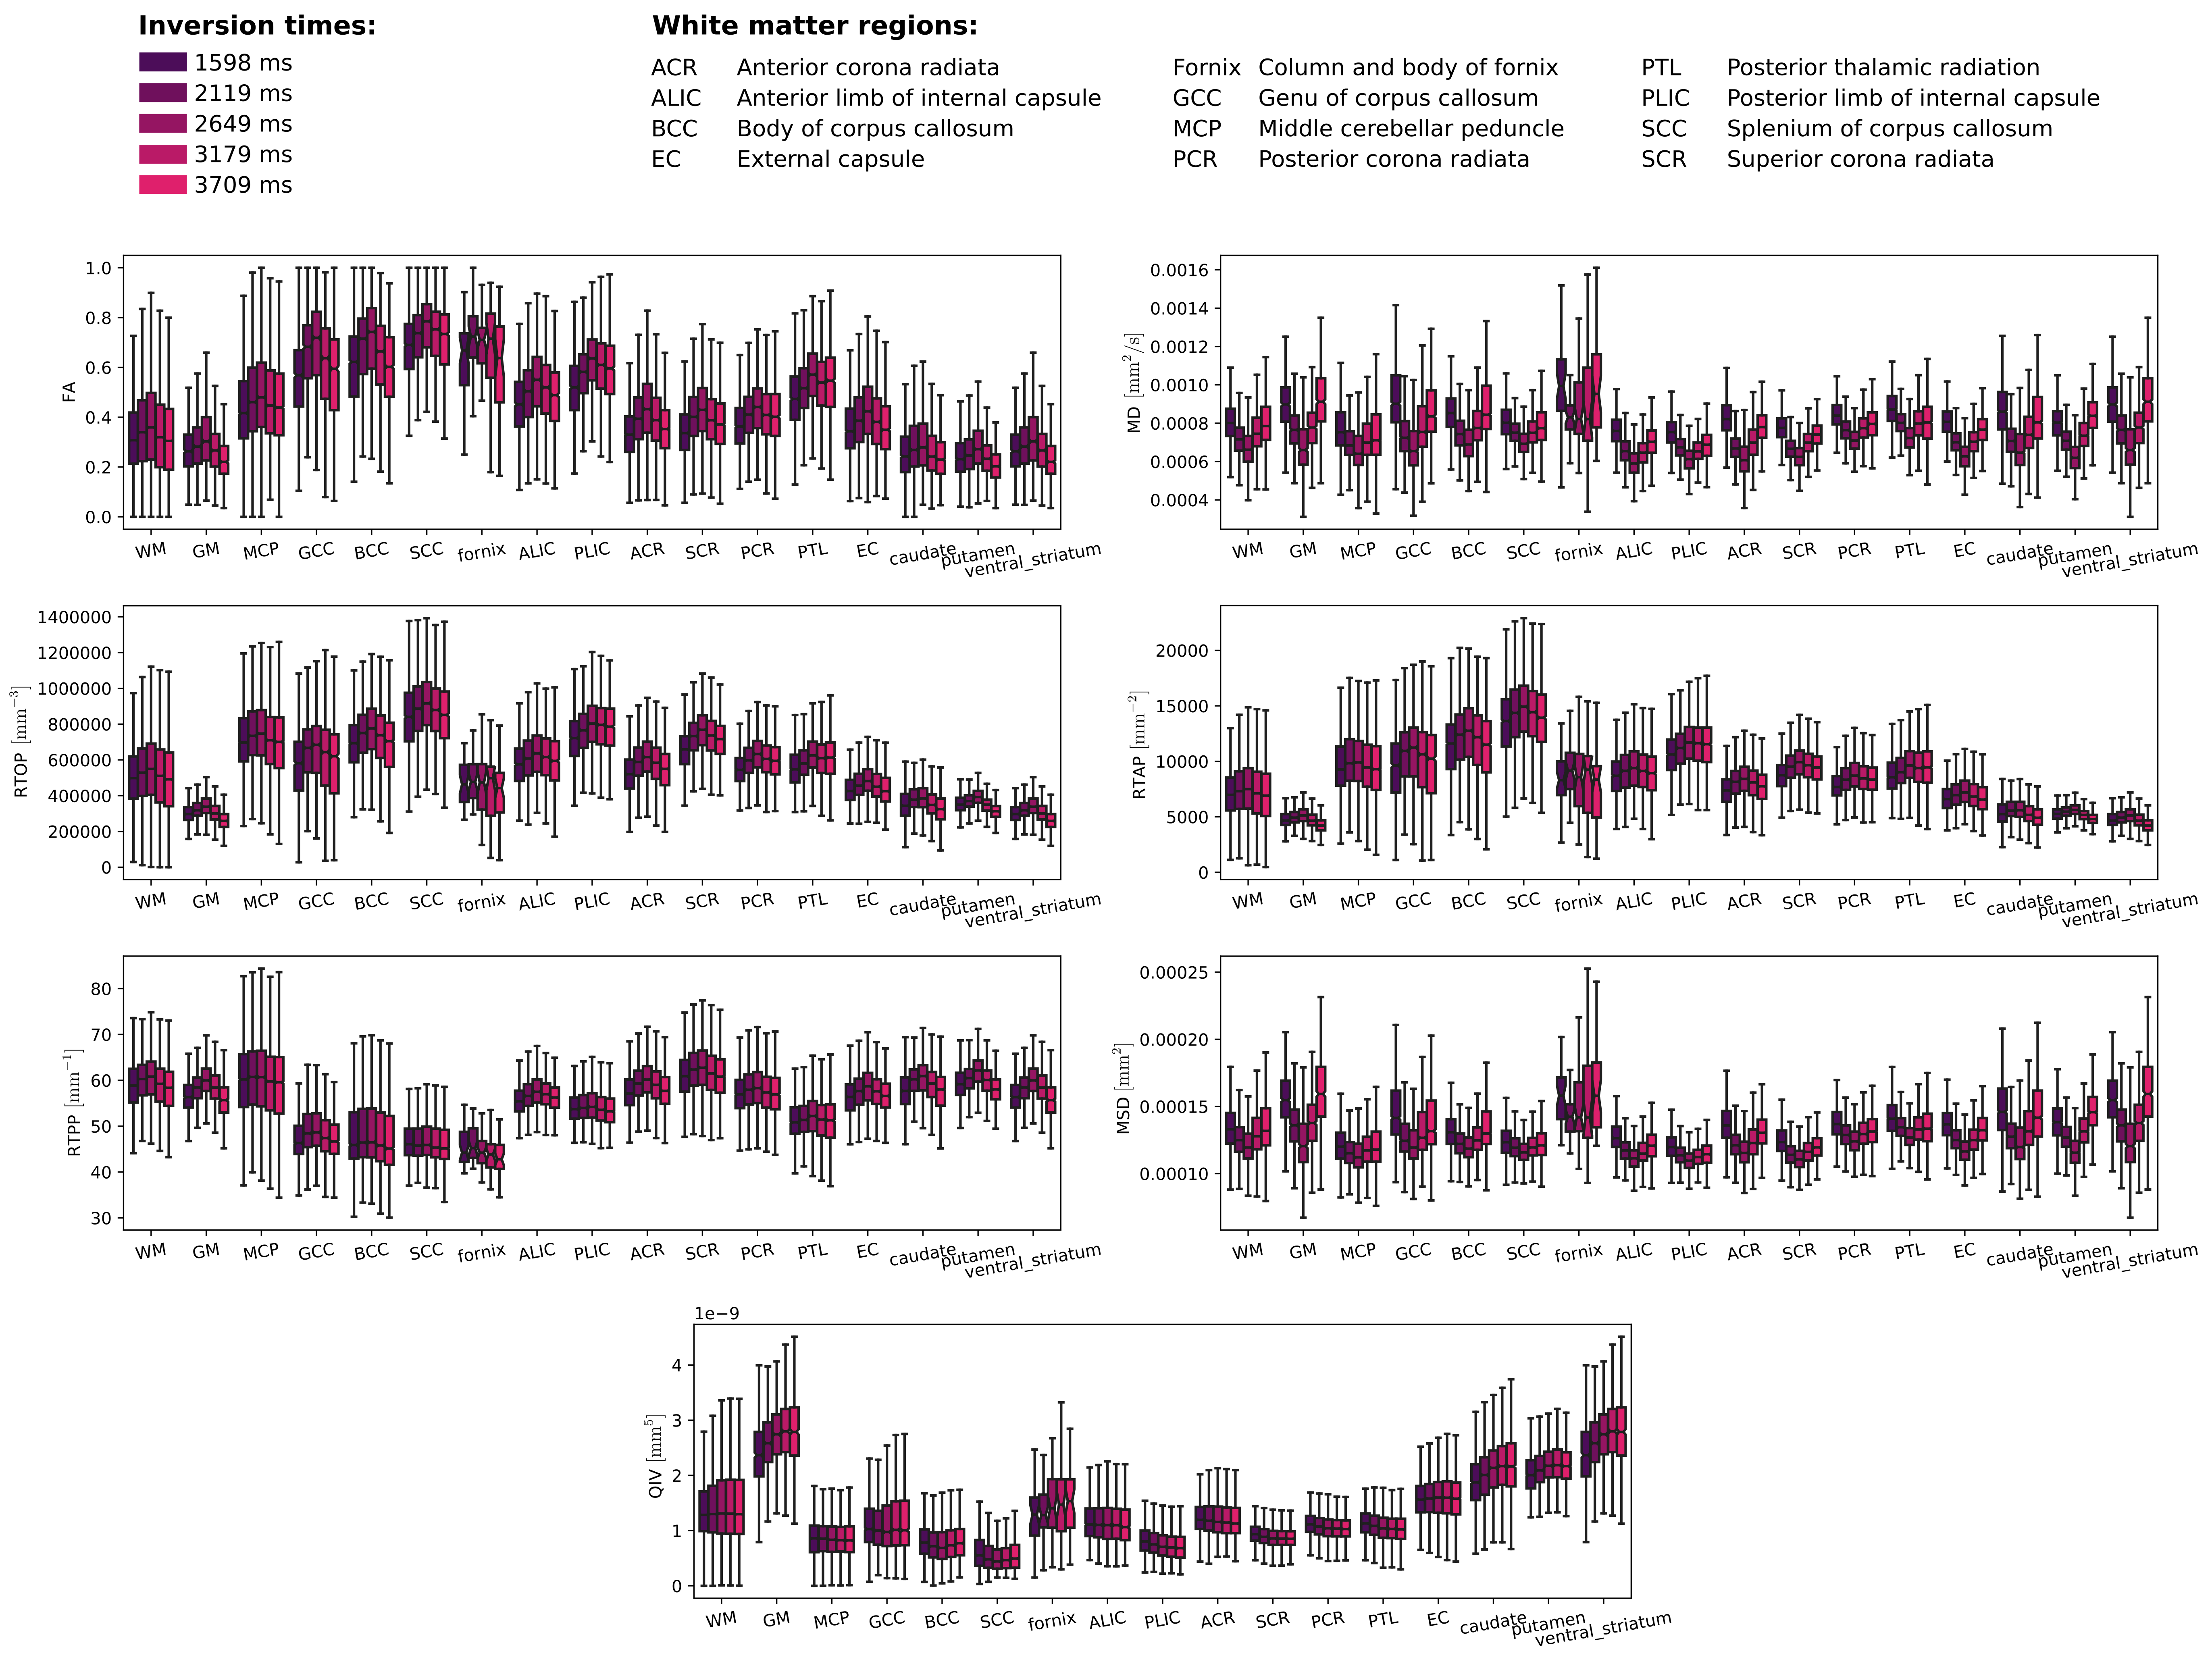
Effect of the inversion time (TI) on the estimated DTI (FA, MD) and MAP-MRI (RTOP, RTAP, RTPP, MSD, QIV) measures over various region-of-interests in white matter (WM) and gray matter (GM) areas. The box plots present the first, the second (median) and the third quartile, respectively. The whiskers denote minimal and maximal values over the region-of-interest.
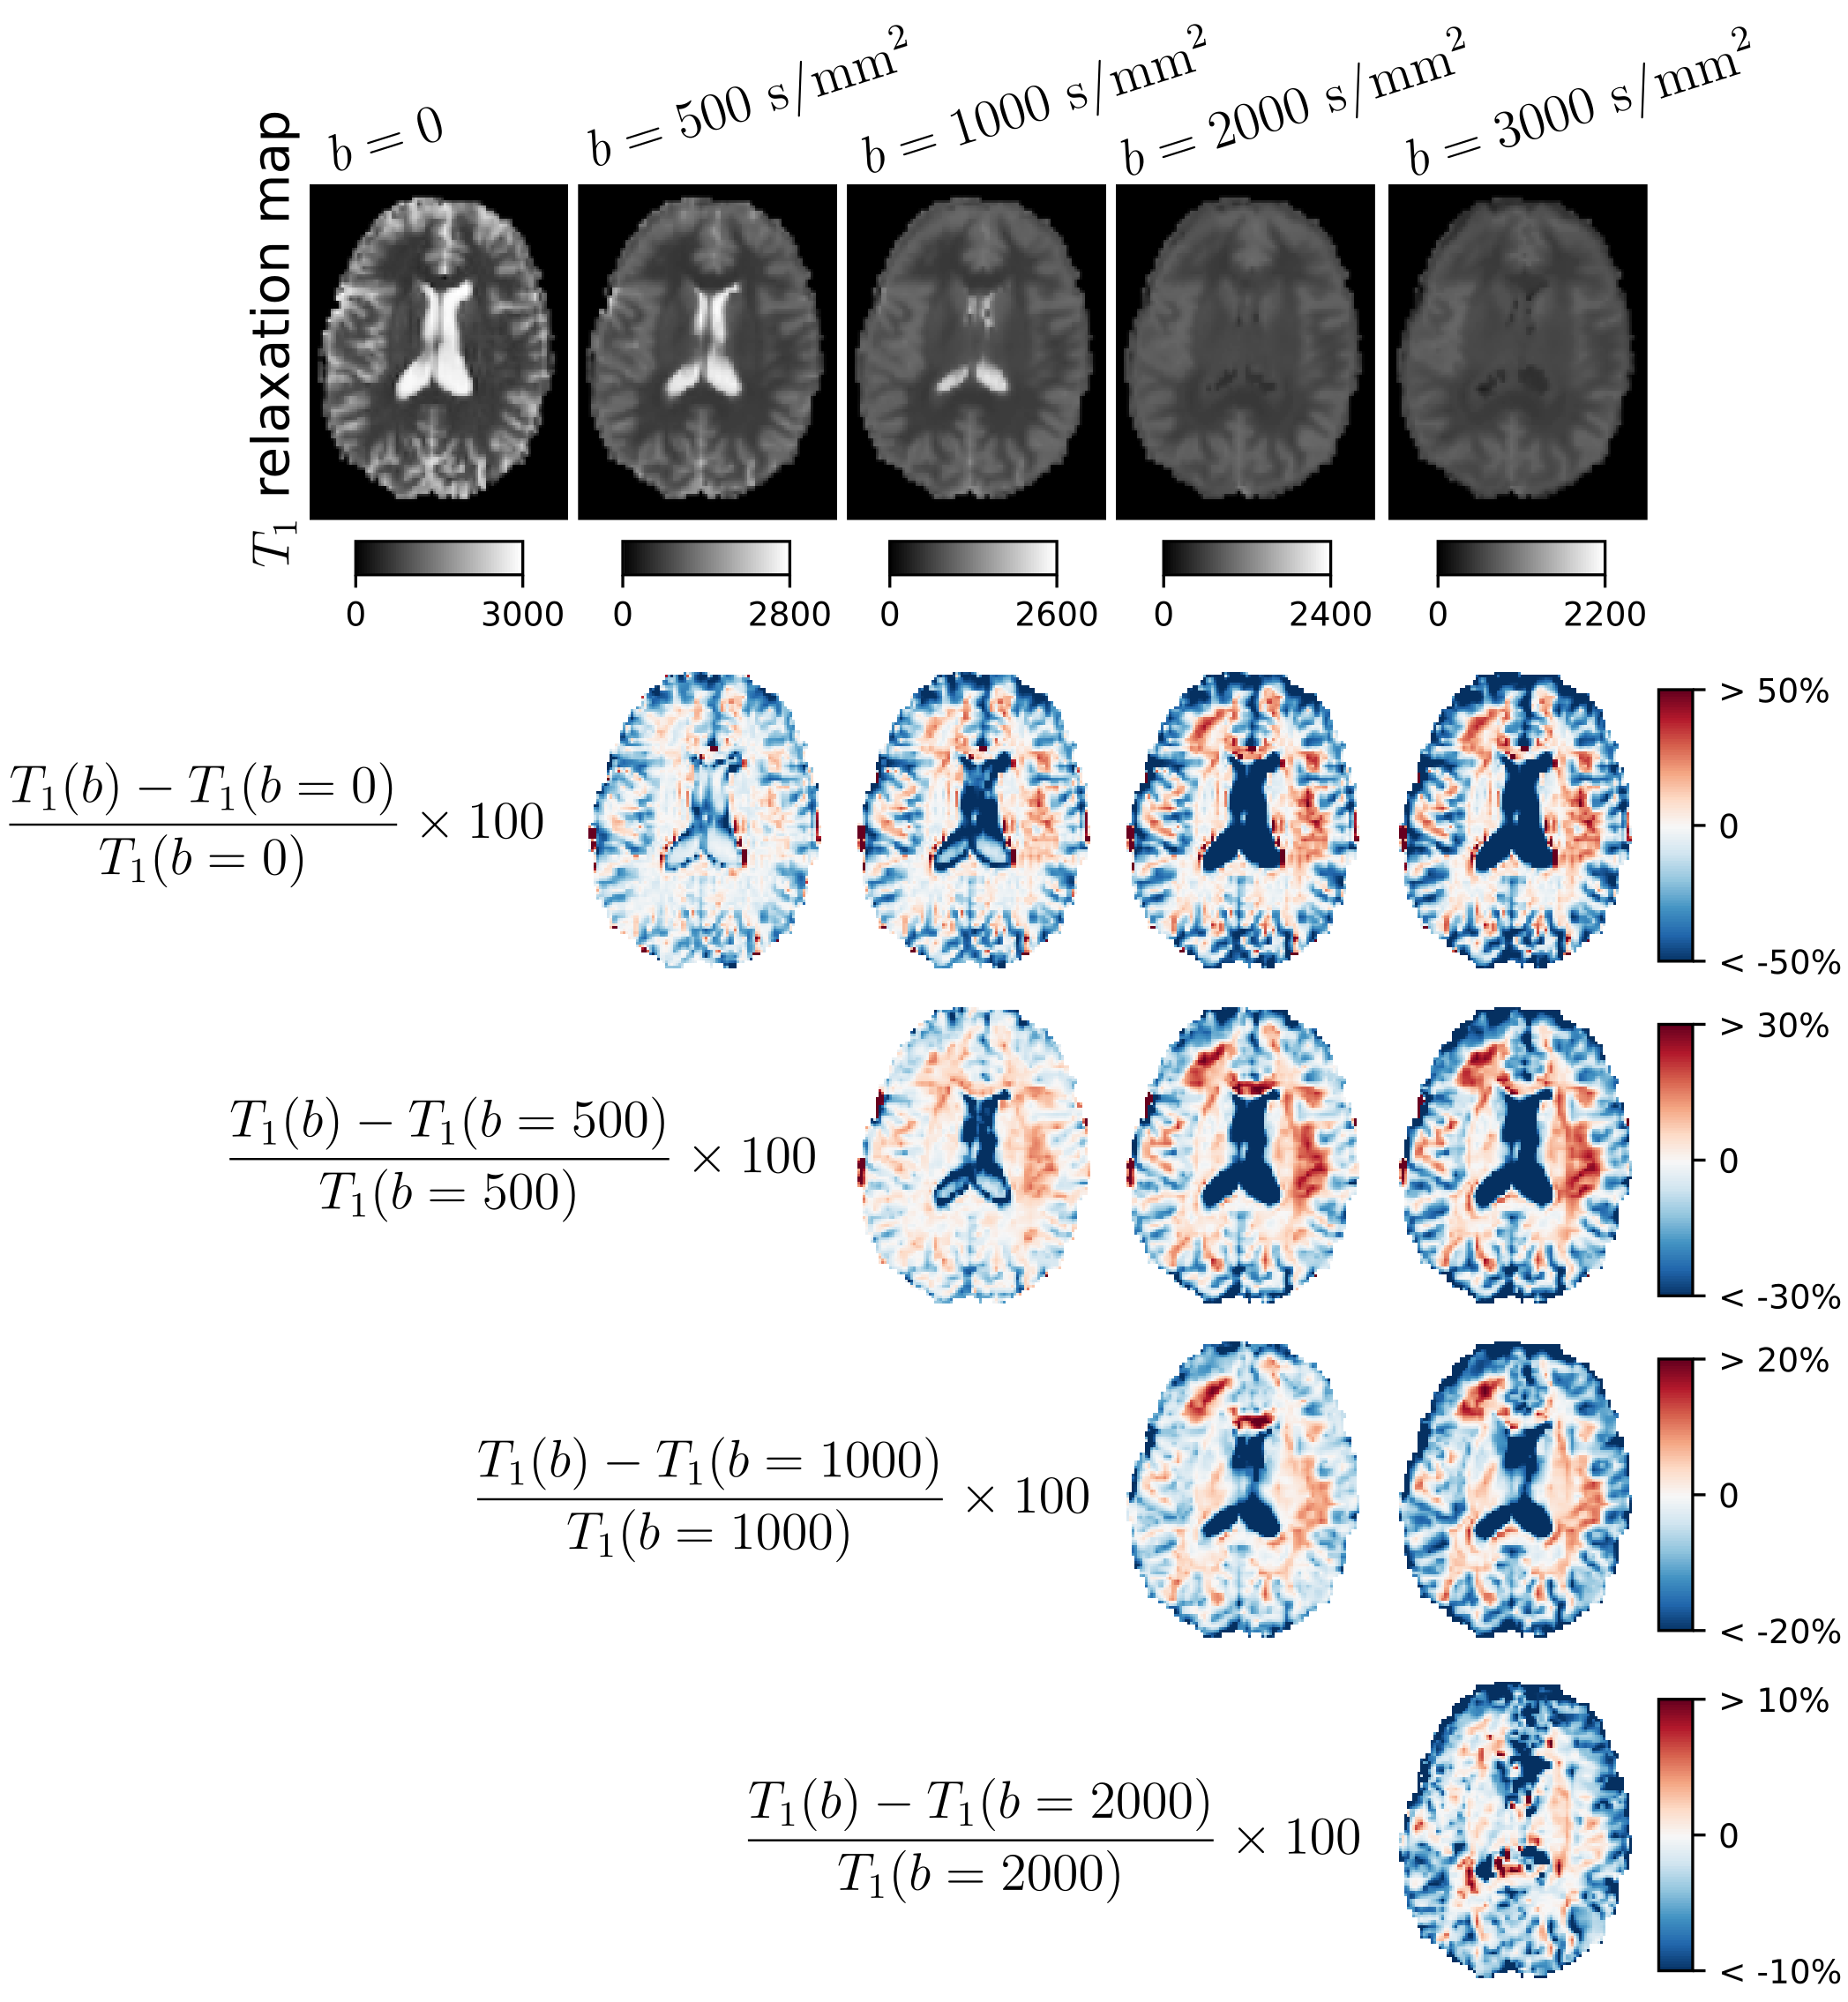
The longitudinal $$$T_1$$$ relaxation maps (in milliseconds) estimated under different $$$b$$$-values (top) and relative differences (in %) between $$$T_1$$$ relaxation maps obtained at two $$$b$$$-values (bottom). Each formula presents the way of calculating the differences presented in the row. For example, the first row presents the relative differences between $$$T_1$$$ relaxation map at $$$b=500 \ \mathrm{s}/\mathrm{mm}^2$$$ and $$$b=0$$$, $$$b=1000 \ \mathrm{s}/\mathrm{mm}^2$$$ and $$$b=0$$$, and so on.
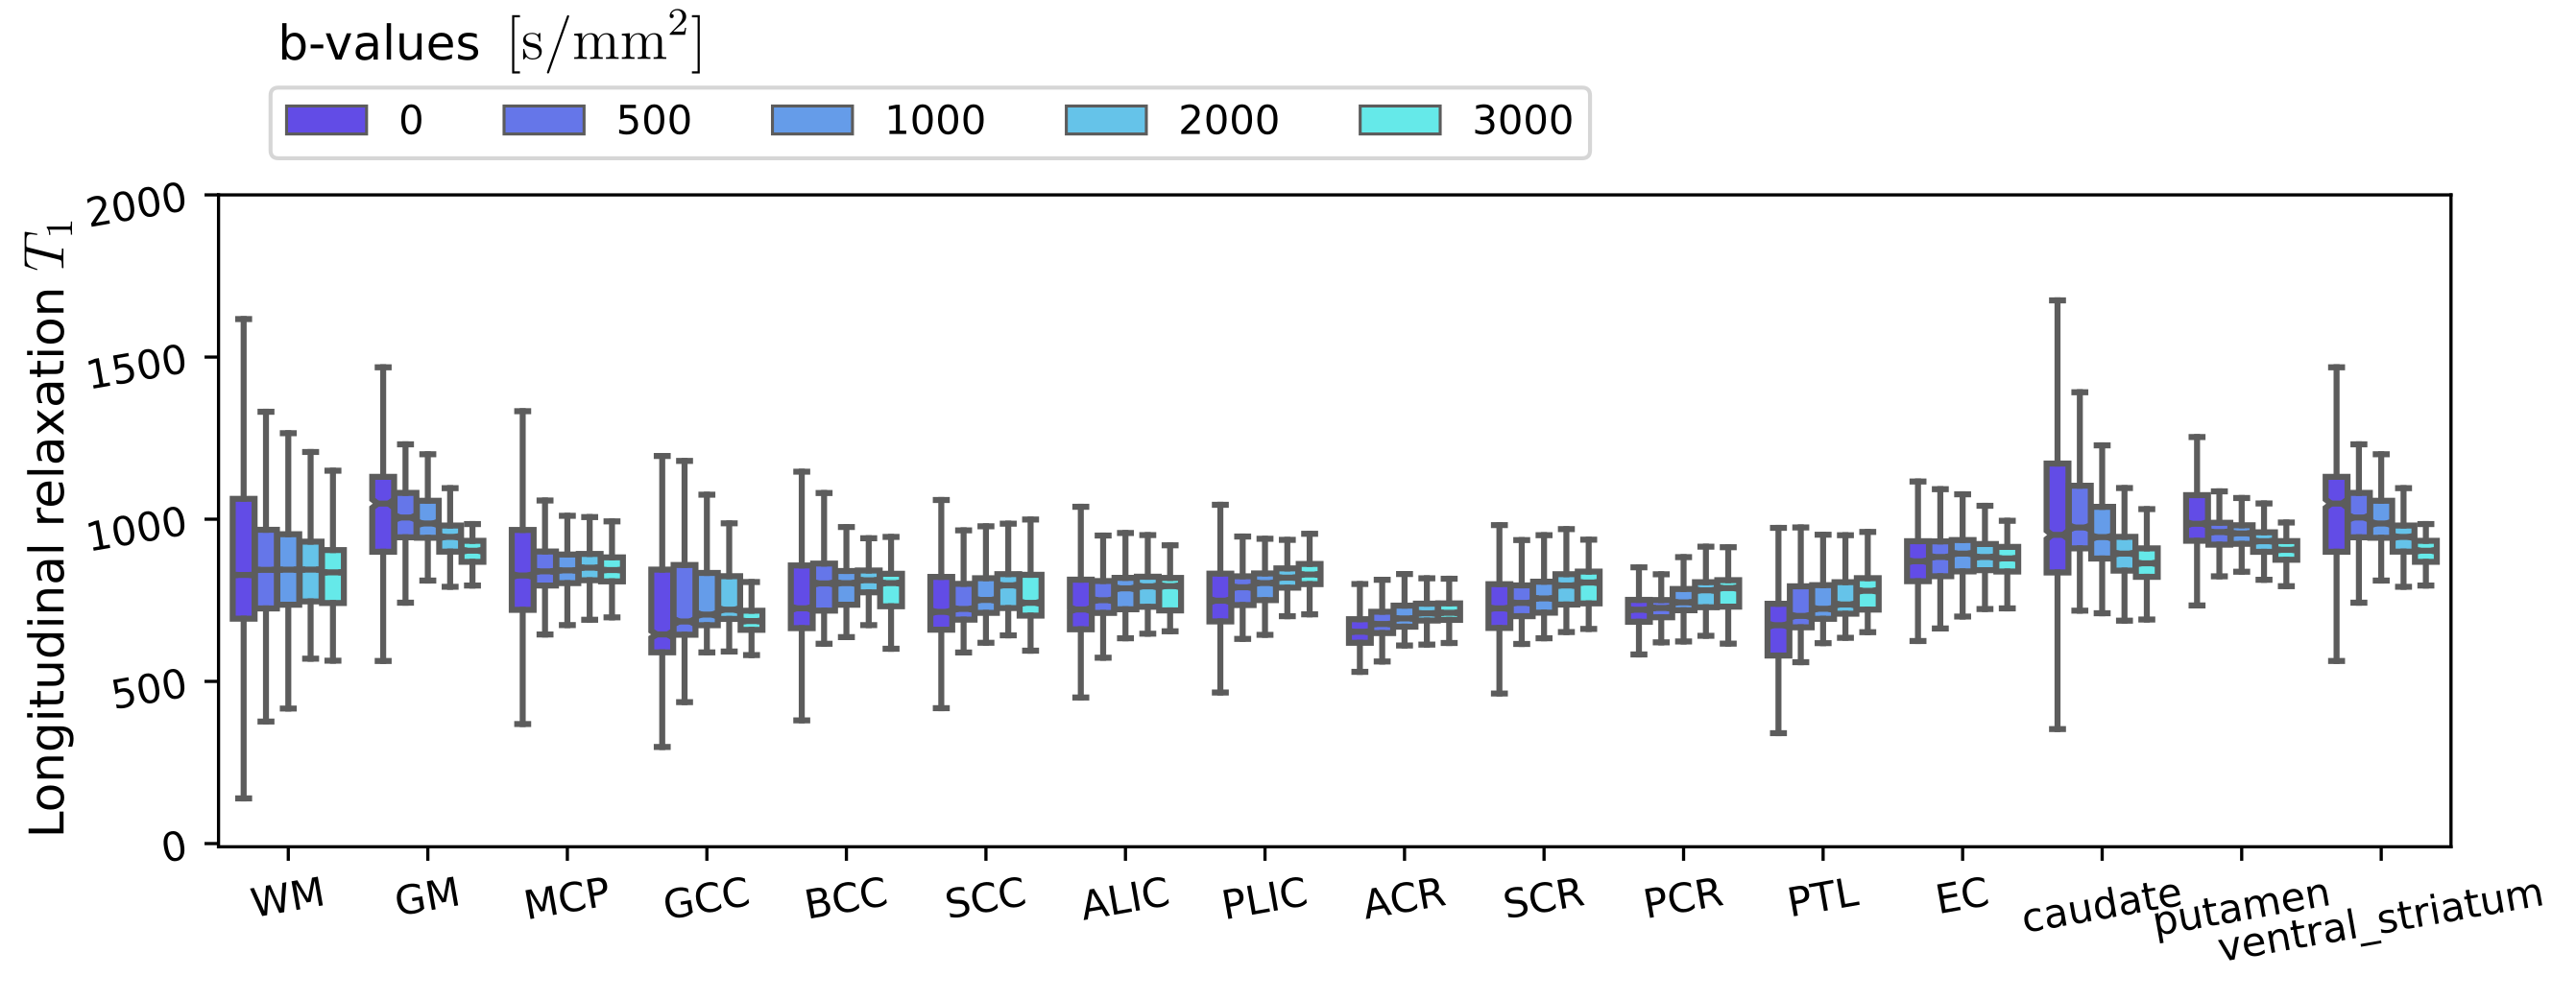
Effect of the b-value on the estimated longitudinal relaxation time $$$T_1$$$ (in milliseconds) over various white and gray matter region-of-interests, including five subjects. The box plots present the first, the second (median) and the third quartile respectively, while the whiskers denote minimal and maximal values over the region-of-interest.