0095
Delineating perfusion and the effects of vascularisation patterns across the hippocampal subfields at 7T
Roy AM Haast1, Sriranga Kashyap2, Mohamed D Yousif1, Dimo Ivanov2, Benedikt A Poser2, and Ali R Khan1
1Centre for Functional and Metabolic Mapping, Western University, London, ON, Canada, 2Maastricht University, Maastricht, Netherlands
1Centre for Functional and Metabolic Mapping, Western University, London, ON, Canada, 2Maastricht University, Maastricht, Netherlands
Synopsis
Intra-hippocampal perfusion patterns have remained unexplored so far but might carry important information to study disease pathogenesis. In this study we used arterial spin labeling (ASL) combined with time-of-flight angiography acquired at 7T to delineate perfusion and the effects of vascularisation patterns across the hippocampal subfields. We found that (i) imaging hippocampal perfusion in vivo is feasible using ASL at 7T, (ii) perfusion could serve as biomarker to differentiate hippocampal subfields, but that (iii) the impact of the dense macrovascular network varies based on characteristics such as distance and diameter.
Introduction
Structural changes of the hippocampal formation, such as atrophy, are well-established biomarkers in numerous neurodegenerative diseases linked to memory loss1. More recently, inter-subject variation in hippocampal vascularization patterns were found to render cerebral vascular disease patients differently susceptible for cognitive – and in particular, memory – performance loss2,3. Naturally, these differential hippocampal vascularization patterns might allude to inter-subject, as well as intra-hippocampal variability in terms of perfusion. However, hippocampal perfusion has not been systematically characterized yet. Here, we aimed to study the hippocampal perfusion and the relation to its macrovascularization across its subfields using arterial spin labeling4 and time-of-flight angiograms acquired using 7T MRI.Methods
Acquisition: All data were acquired on a whole-body 7T Magnetom MRI scanner (Siemens Healthineers) with a 32-channel head-coil (Nova Medical) on eleven healthy subjects (mean age 26±3.2 years, 5 males). A 1.5 mm3 2D-EPI ASL sequence with FAIR QUIPSSII labeling was used4 with TR/TE/TI1/TI2=2861/14/700/1800 ms, 32 axial slices, matrix=128x128, echo-spacing=69 ms, Bw=1698 Hz/px, PF=6/8, GRAPPA=3 (FLEET5 reference [N=48]), 100 paired repeats (tag-control interleaved), eight runs of 4:49 min each. Long TR (20 s) calibration images were also acquired for readout distortion correction and perfusion quantification. 3D TOF data was acquired using five slabs of 44 slices, TR/TE= 15/3.59 ms, base resolution=448, PF=6/8, GRAPPA=3, Nreflines=24, and TA=5:50 min to reconstruct vasculature. At least three 4:41 min runs of high-resolution T2w TSE images with TR/TE=9000/105 ms, 50 coronal slices, base resolution=512, GRAPPA=2, Nreflines=27, in-plane resolution=0.4 mm, slice thickness=1.0 mm were acquired for hippocampal segmentation. Dielectric pads (2.8:1 calcium titanate in deuterated water) were used to improve labeling efficiency and B1 in the medial temporal lobes.Analysis: The M0 ASL data were motion-corrected using SPM12 and distortion-corrected using FSL-TOPUP. All processed ASL runs were used to obtain the average perfusion-weighted image. A quantitative perfusion map was then computed in native space using the PASL model6 as implemented in FSL’s oxford_asl function. Data were coregistered and resampled onto the high-resolution T2w space using greedy7. For hippocampal analyses, the hippocampus was manually segmented in ITK-SNAP8 using isotropic resampled (0.3 mm3) T2w data. The hippocampal macrovasculature was then reconstructed by filtering the TOF angiography data for vessel-like structures near the hippocampal boundaries using the workflow by Bernier et al. 20189, reconstructed and further refined in 3D using MeVisLab10. Distance to the closest vessel and corresponding vessel diameter were calculated for each hippocampal voxel. Finally, for comparison across subfields and visualization purposes, the perfusion- and macrovasculature-based maps were unfolded and projected onto the hippocampus using an in-house developed coordinate system11.
Results
Perfusion-weighted data are shown for one representative subject on the left (subject 1, Figure 1) and one with a clear strong vasculature influence (indicated by dashed red boxes) on the right (subject 2). In general, a clear contrast is visible between hippocampal gray matter (within white outlines in A) and neighboring white matter tissue. The surface and flatmap representations in B and C, respectively, demonstrate the importance of the unfolding approach to properly isolate and assess intra-hippocampal perfusion patterns. Within this unified hippocampal coordinate system, average perfusion-weighted maps (left, Figure 2), as well as its quantitative counterpart (right) in A and B, show inter-subfield variability with a slightly stronger differentiation after quantification. Perfusion is lowest in CA1 (29.8 ml/100 g/min) and highest in CA4/DG (37.7 ml/100 g/min). Moreover, the average perfusion-weighted signal and its variation across subjects vary as a function of the number of included runs but stabilize at the ~5 runs mark (i.e, 500 volumes, C).Macrovascular aspects of the hippocampus are shown in Figure 3A with vessel diameter and the distance to the most nearby vessel across the hippocampus mapped onto the respective 3D reconstructions for subject 2. Figure 3B and C show the corresponding across subjects average patterns and values. Compared to the other subfields, CA1 is situated more distant from detectable vessels while thickest vessels are found especially more close to the subiculum. Figure 4 shows the correlation between the different perfusion- and vascular-based metrics. Both average perfusion (A) and inter-subject variability (B) decreases with increasing distance but this pattern varies as a function of vessel diameter (i.e., smaller or larger than 2 mm radius). Larger vessels seem to dominate the higher average perfusion regime while variability across subjects decreases more rapidly as a function of distance for hippocampal tissue dominated by smaller vessels.
Discussion
The current work is the first to systematically show and characterize perfusion patterns across the hippocampal gray matter. Analyses of the ASL data in the unfolded space reveal that the subfields hold distinct perfusion-weighted properties that intensifies after quantification and stabilizes with the inclusion of a total of 500 paired repeats. Most importantly, the magnitude and variability of the perfusion signal across subjects appears to spatially vary and to be linked to the nearby macrovasculature. Both distance to, as well as diameter of the most proximal vessel seem to impact perfusion characteristics. Taken together, these results suggest that quantification of hippocampal perfusion is possible and could potentially provide a novel approach to study hippocampal pathologies. Nevertheless, perfusion patterns need to be interpreted with care and ideally after regressing out potential macrovasculature biases.Acknowledgements
The author Roy AM Haast is supported by a BrainsCAN postdoctoral fellowship for this work. Scanning was carried out at Scannexus B.V., Maastricht, The Netherlands.References
[1] Squire, L. R., et al. (2004) Annu. Rev. Neurosci. 27, 279–306. [2] Spallazi et al. (2019) Neuroimage Clin. 2019;21:101609. [3] Perosa et al. (2020) Brain 2020 Feb 1;143(2):622-634. [4] Ivanov et al. (2017) Magn Reson Med. Jul;78(1):121-129. [5] Polimeni et al. (2016) Magn Reson Med. Feb;75(2):665-79. [6] Alsop et al. (2015) Magn Reson Med. Jan;73(1):102-16. [7] Yushkevich et al. (2016) Alzheimer's & Dementia: The Journal of the Alzheimer's Association, 12(7), pp.P126-P127. [8] Yushkevich et al. (2006) Neuroimage. Jul 1;31(3):1116-28. [9] Bernier et al. (2018) Hum Brain Mapp. Dec;39(12):4962-4975. [10] Ritter et al. (2011) IEEE Pulse. 2(6):60-70. [11] DeKraker et al. (2018) Neuroimage. Feb 15;167:408-418.Figures
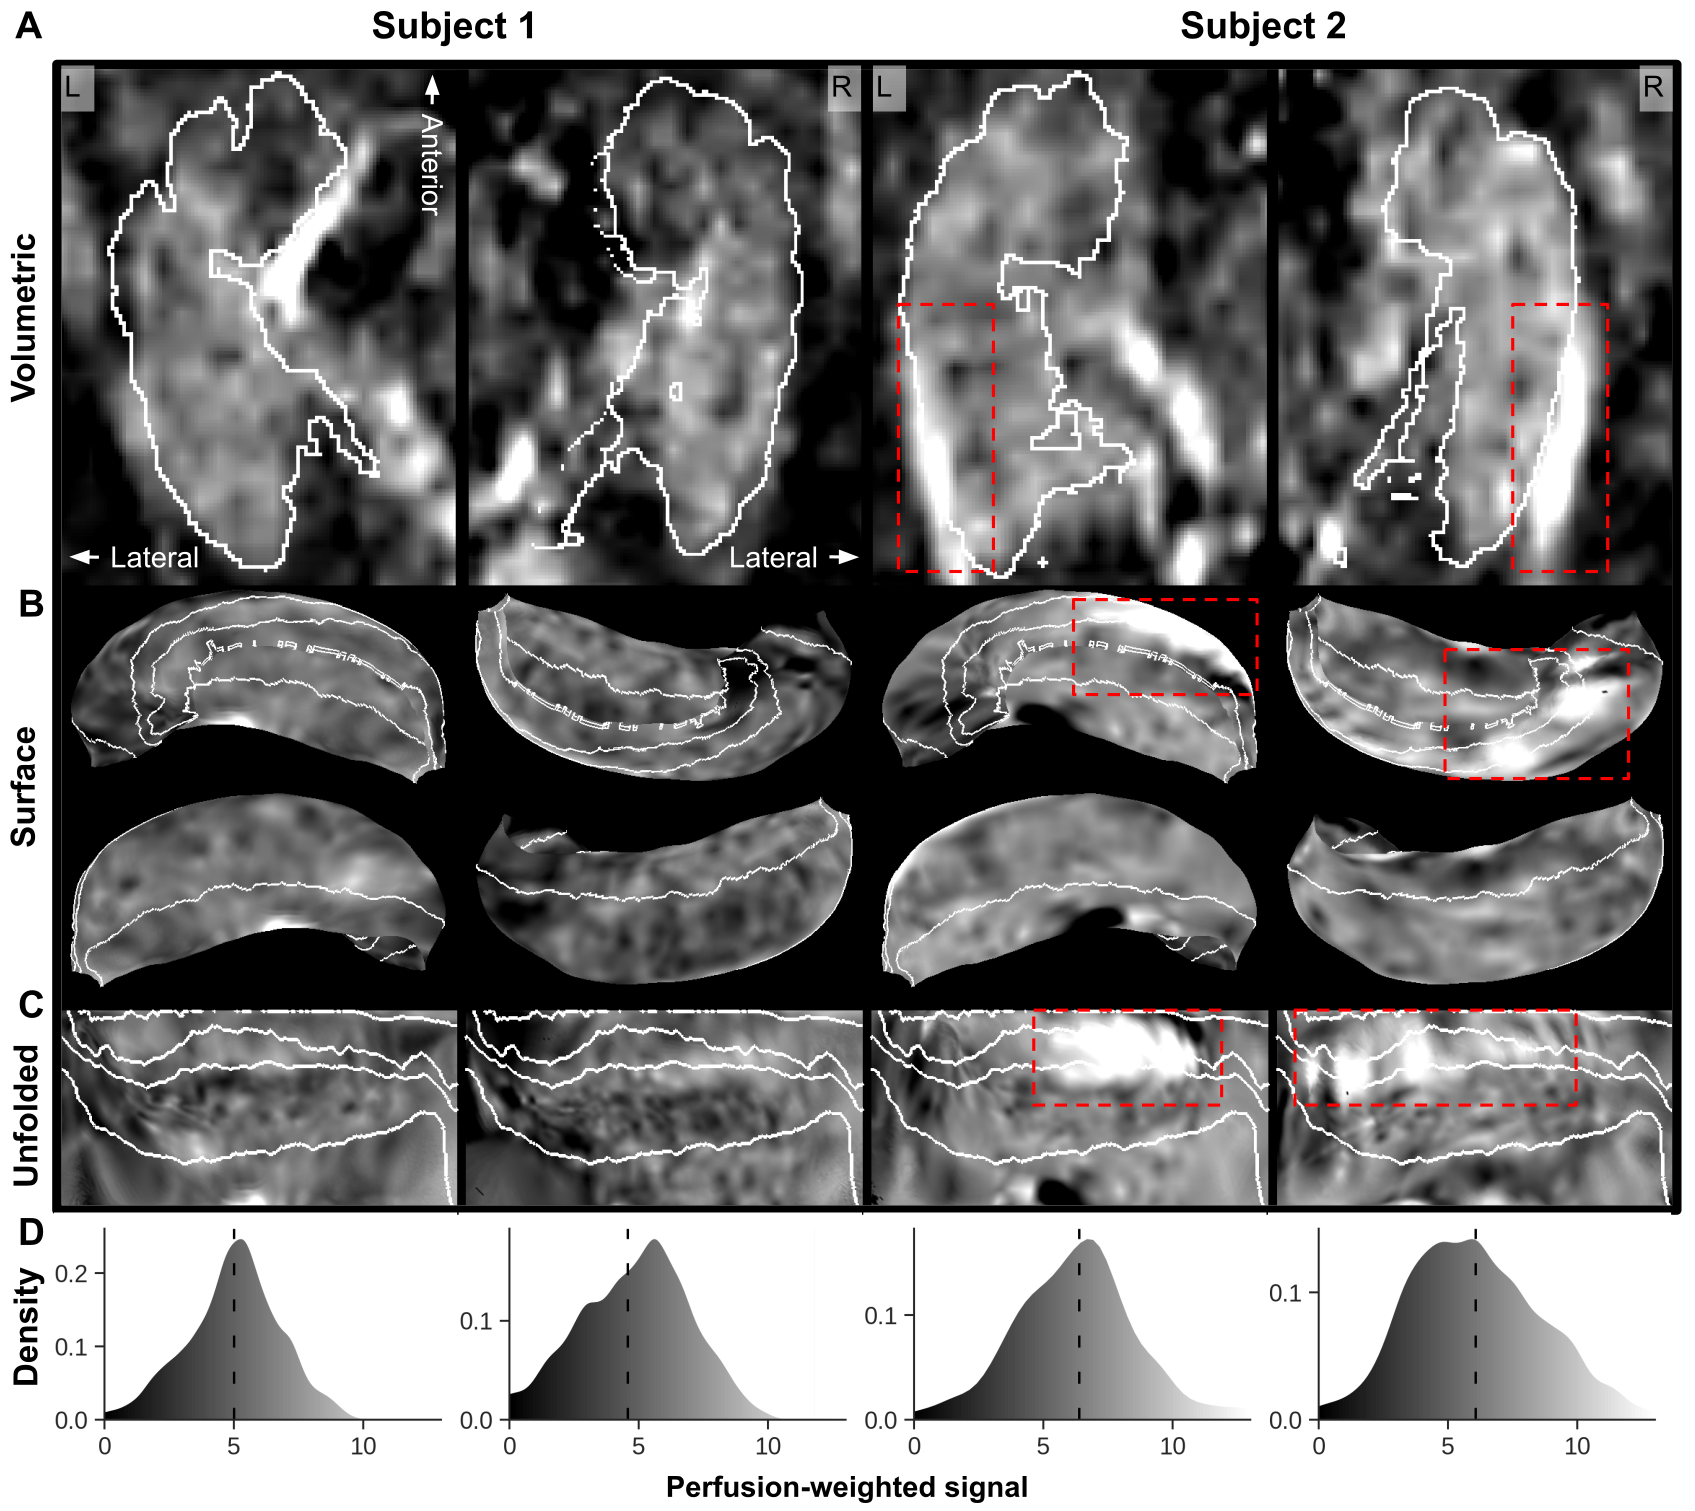
Volumetric (A), surface (B) and unfolded (C) perfusion-weighted images for both left (‘L’) and right (‘R’) hemispheres from two subjects. White outlines demarcate the hippocampal region in A and subfields in B and C. Corresponding hippocampal distribution plots are displayed in D with average perfusion-weighted signals represented as vertical dashed lines.
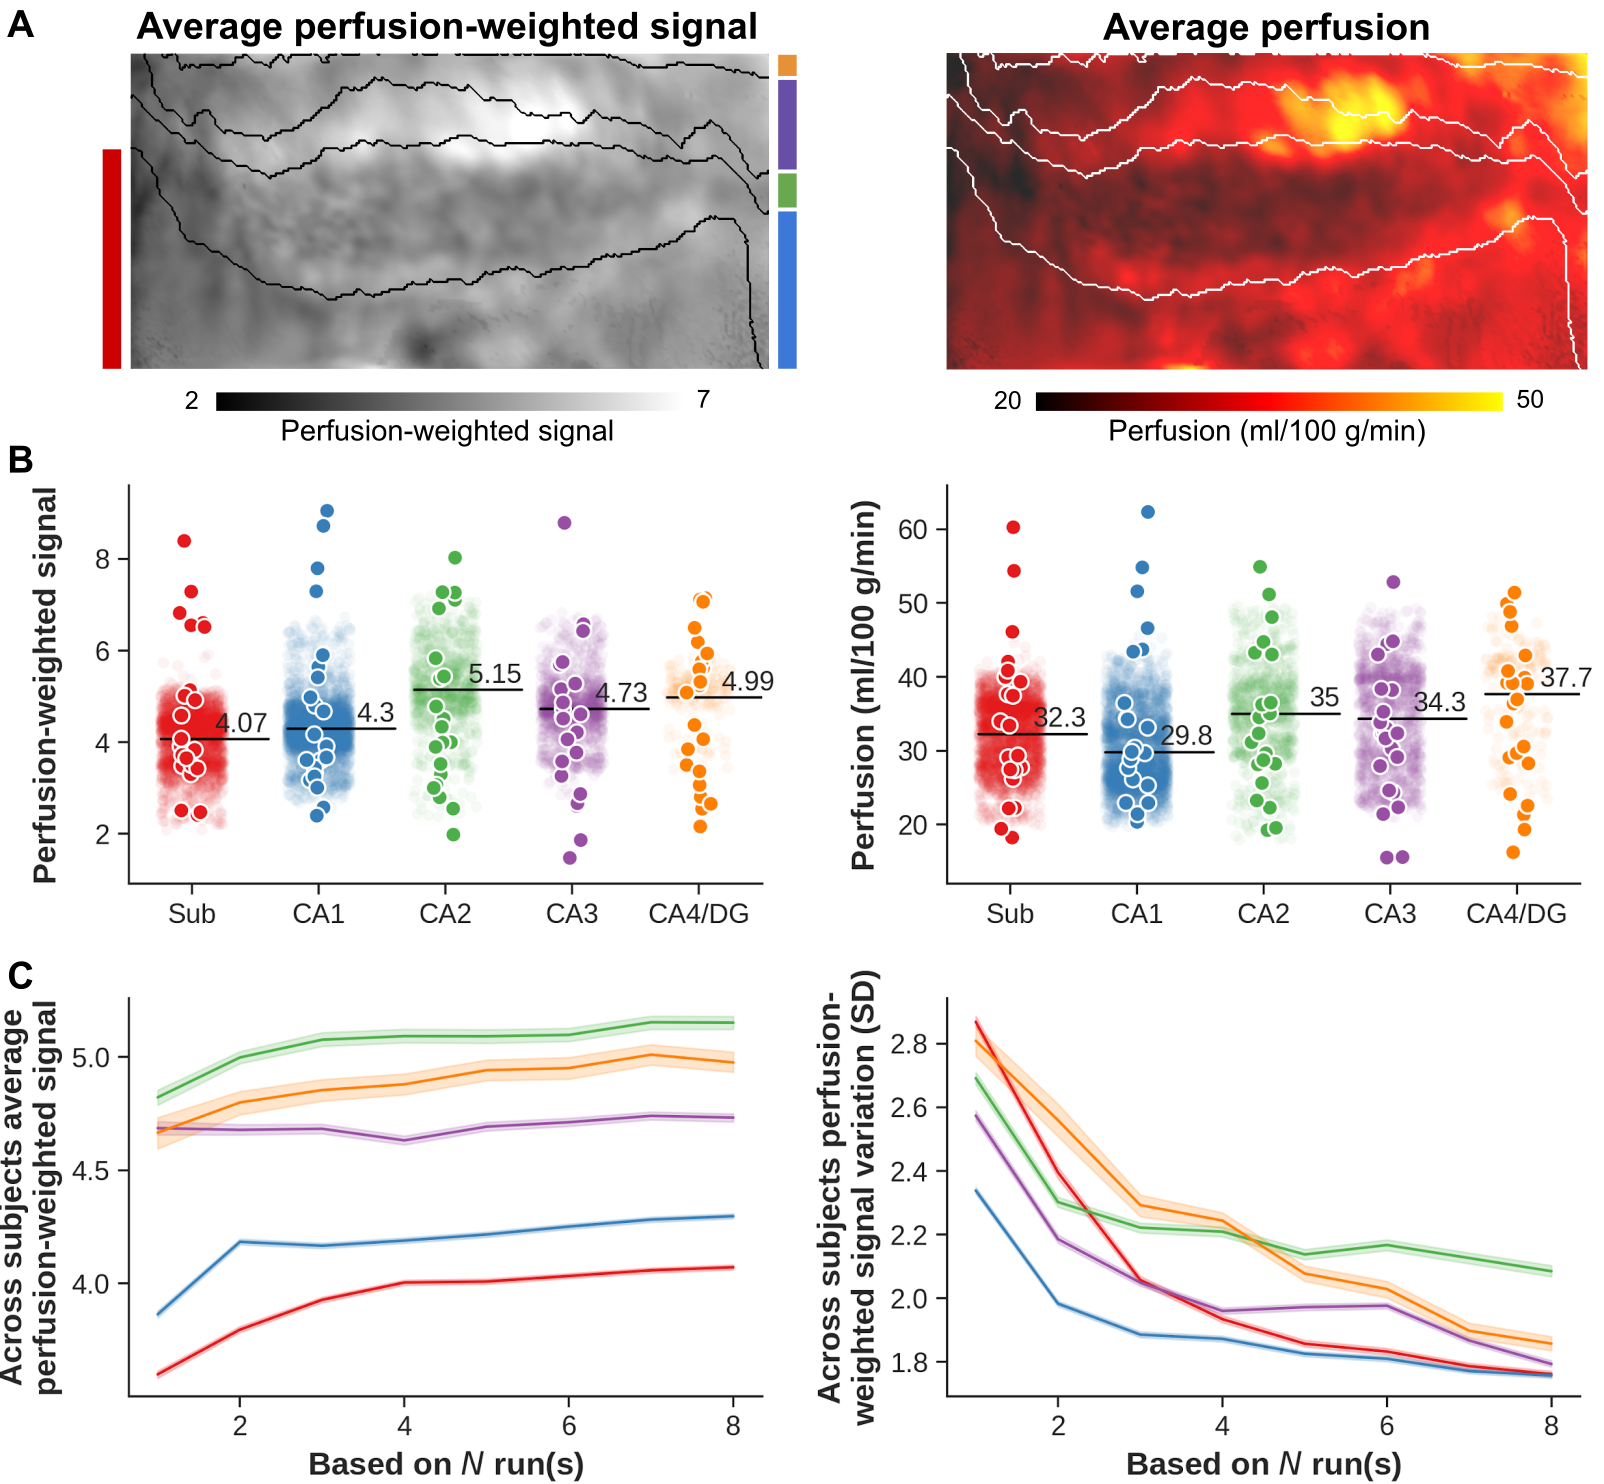
Across subjects average (A) perfusion-weighted (left) and perfusion (right) flatmaps. Subfield-specific averages, per subject and hemisphere, are shown in B for both perfusion-weighted (left) and perfusion metrics (right). Semi-transparent points show vertex-wise averages. Across subjects average perfusion-weighted signal (left) and standard variation (right), as a function of number of included runs and separated per subfield (colored lines) are displayed in C.
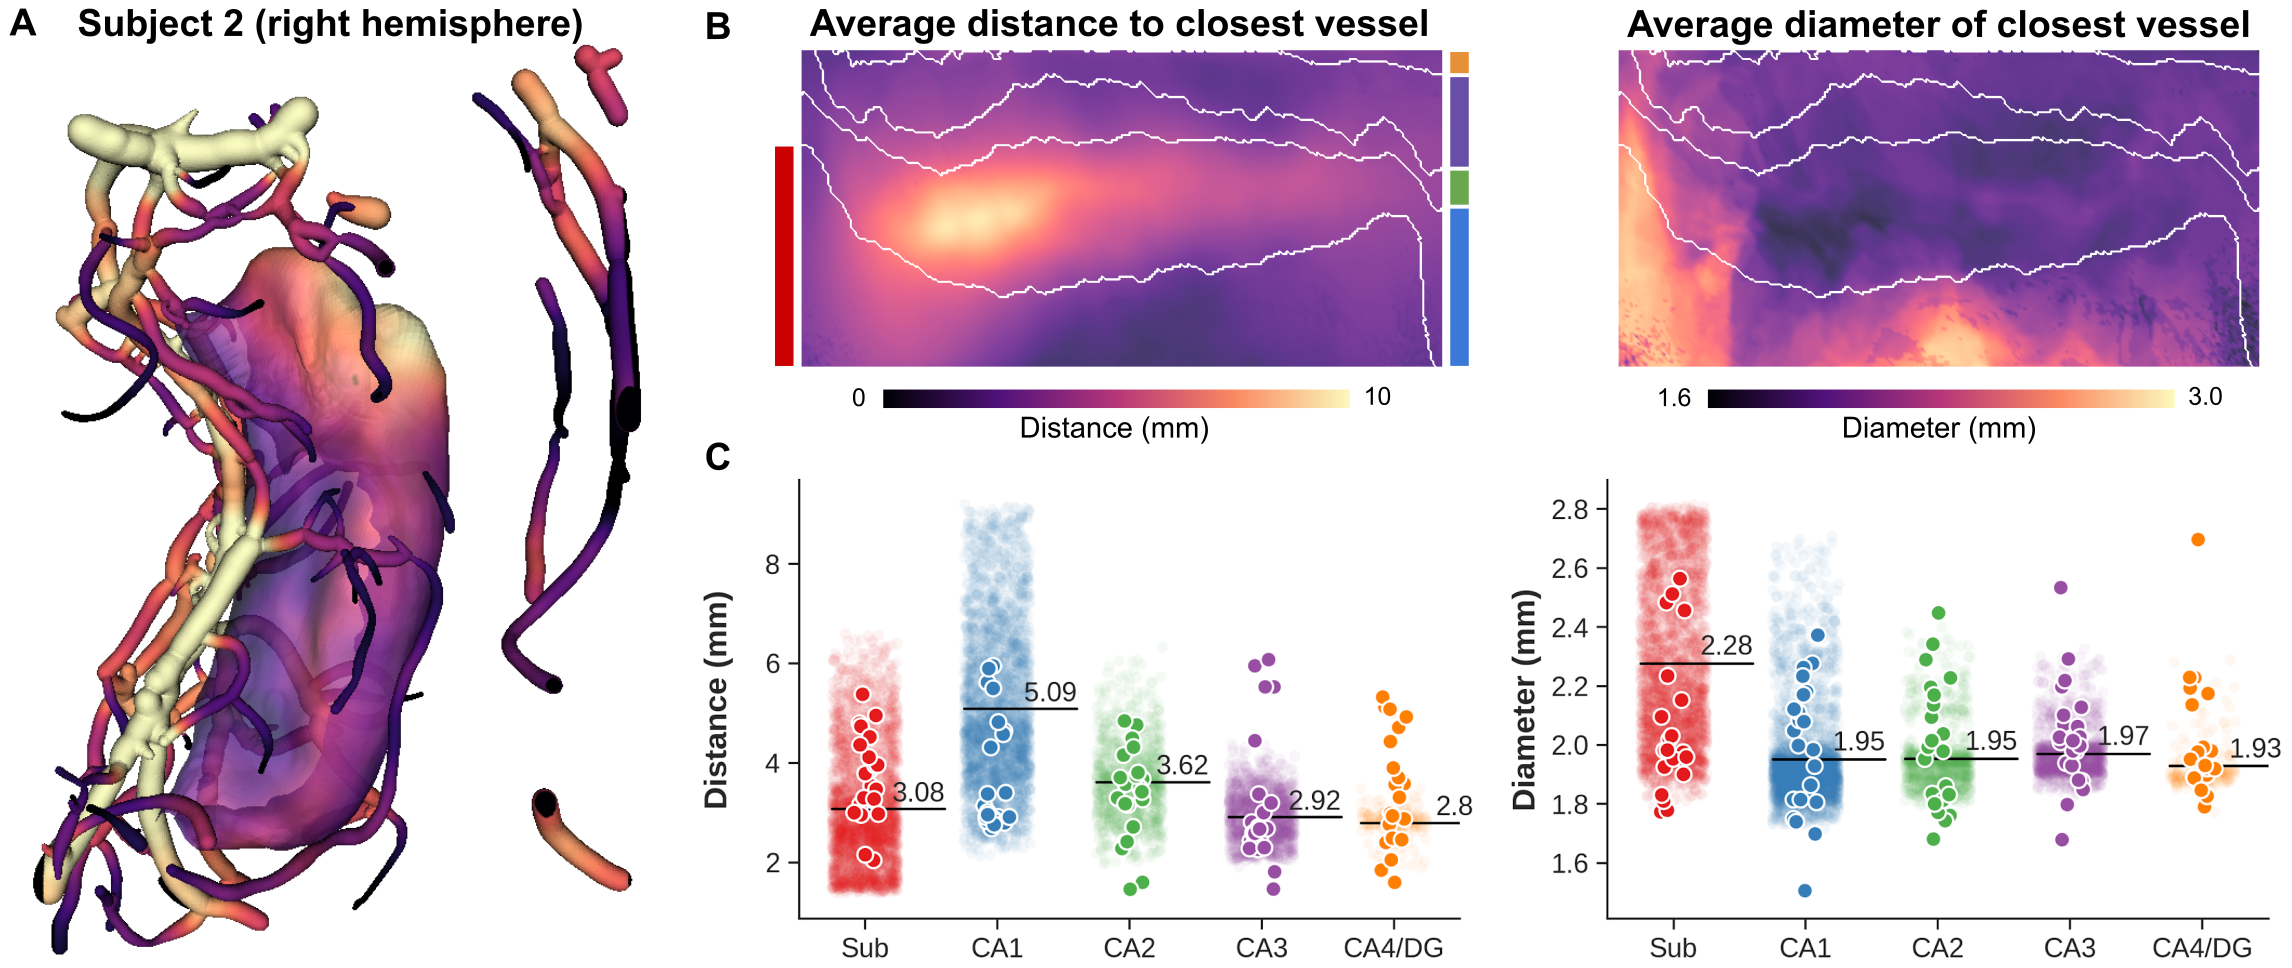
Single-subject hippocampal macrovasculature (A) with distance to closest vessel mapped onto the hippocampal surface whereas the vasculature reconstruction is color-coded for vessel diameter. Average distance (left) and diameter (right) flatmaps are shown in B and subject-specific averages in C. Semi-transparent points show vertex-wise averages.
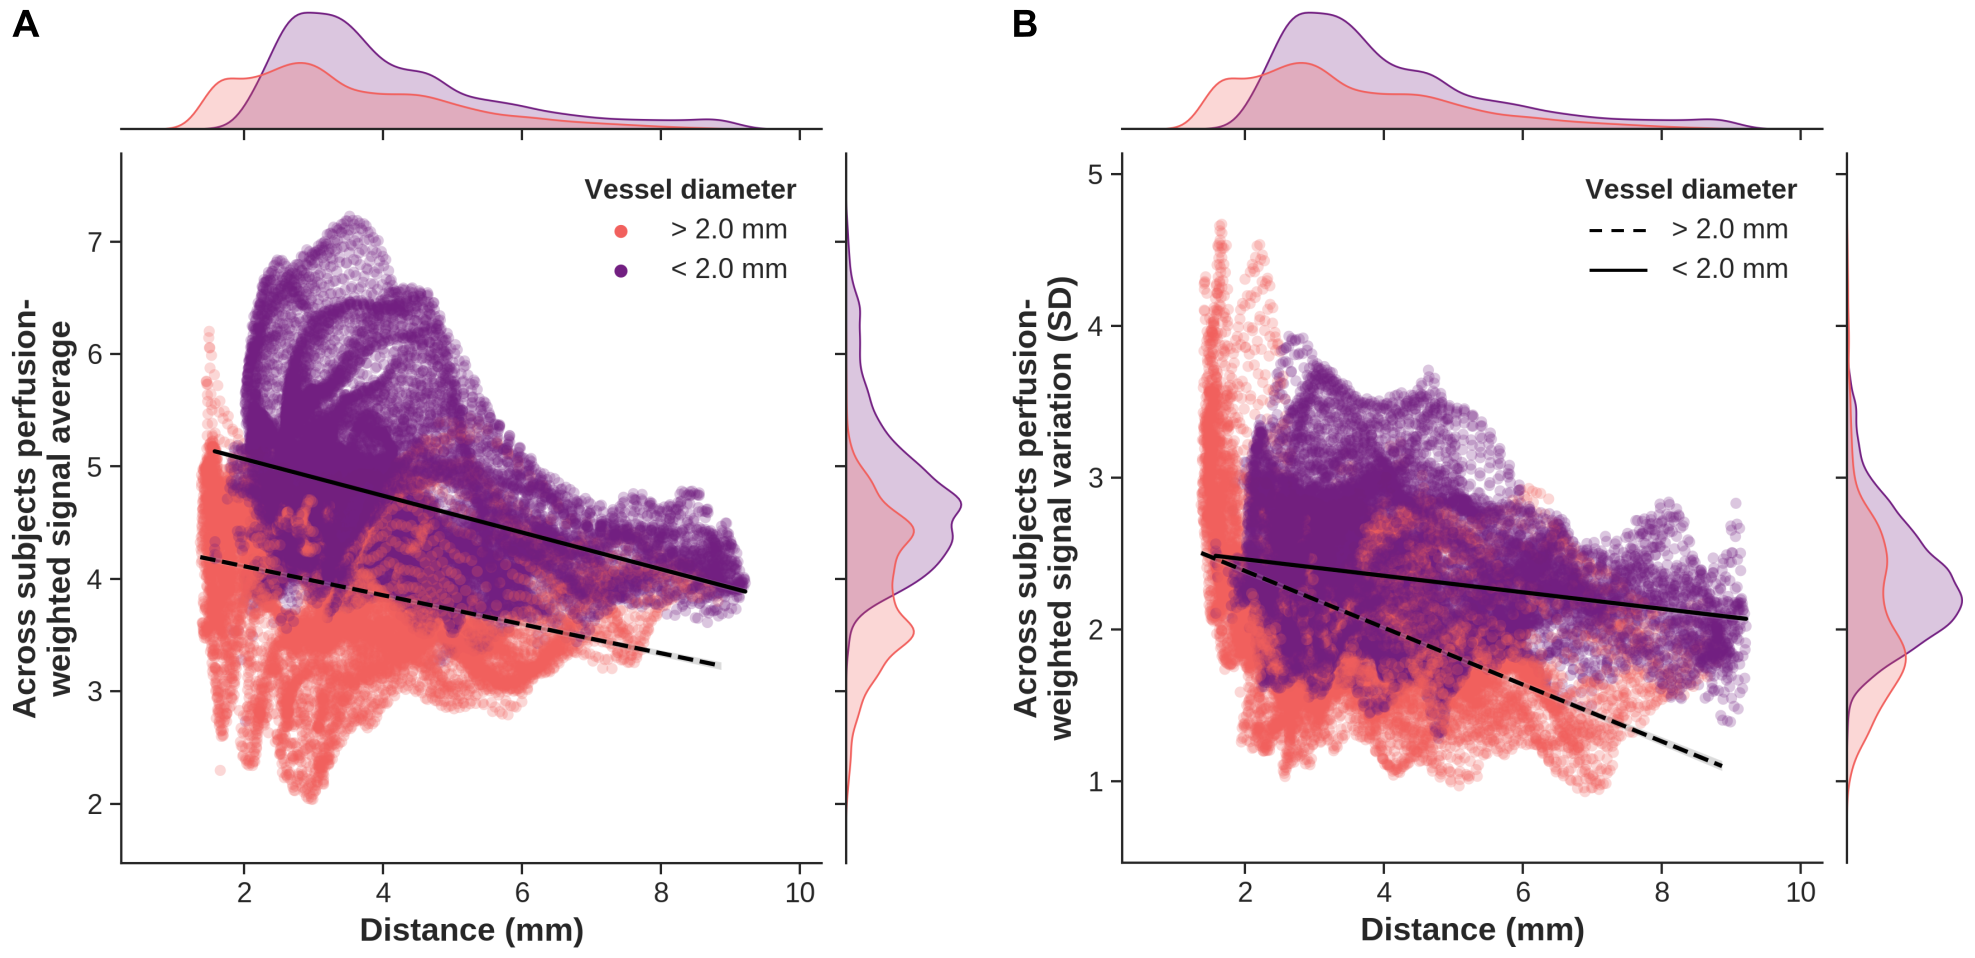
Correlation analyses between vertex-wise perfusion-weighted average across-subjects (A, y-axis), standard variation (B, y-axis) and distance (x-axes). Marginal plots show distribution for the metric displayed along that axis. Points are color-coded based on the diameter of most nearby vessel. Overlaid solid and dashed lines indicate corresponding best fits for each category of diameter.